Strifor Volatility Map Pro
- Indicators
-
Strifor (Mauritius) Ltd
 Welcome to Strifor!
Our mission is to promote a culture of conscious trading in the financial markets. - Version: 1.60
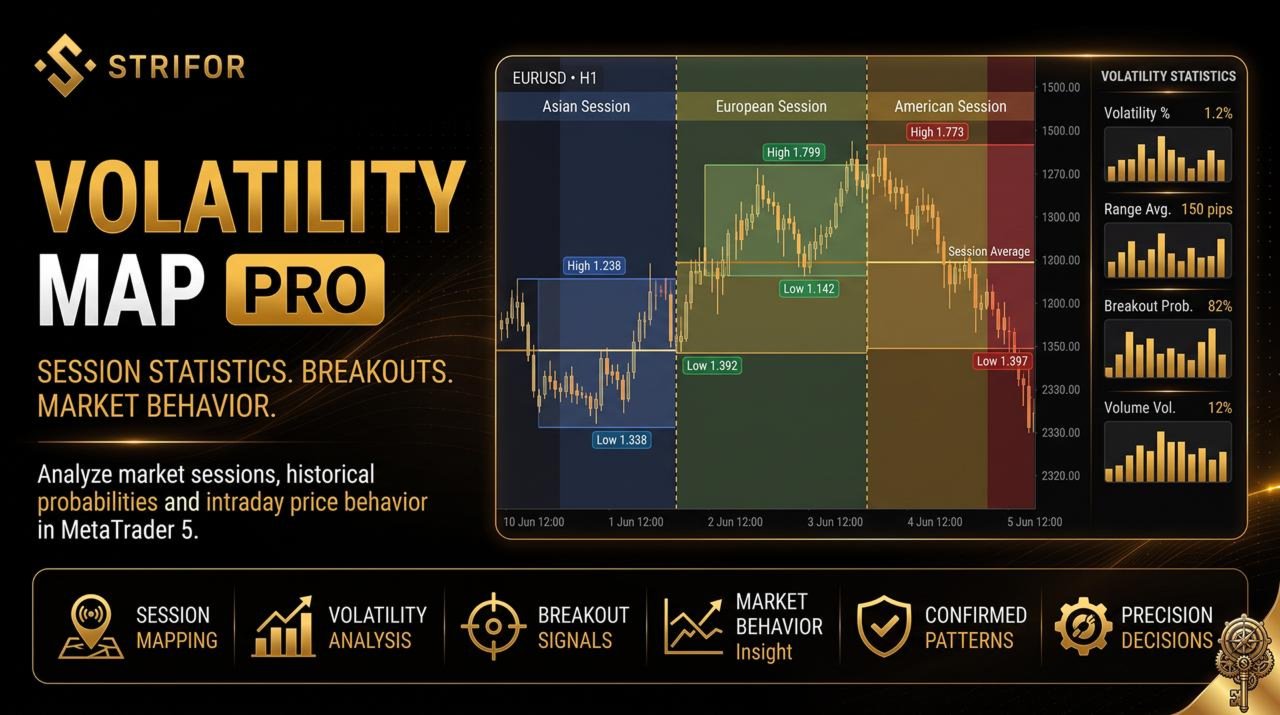
Volatility Map Pro is an analytical indicator for MetaTrader 5 designed to study intraday market behavior, trading session statistics, range breakouts, and historical price patterns.
The indicator analyzes the Asian, European, and US trading sessions, compares current market conditions with historical data, and helps traders assess how closely current price action matches previously observed scenarios.
Rather than focusing solely on the current price, Volatility Map Pro provides additional statistical context, including market state, current volatility, relationships between trading sessions, post-breakout behavior, and historical outcome distributions.
The indicator does not generate ready-made Buy/Sell signals. Its purpose is to help traders understand intraday market structure and make informed decisions using historical statistics.
KEY FEATURES
-
Current Market Analysis — identifies the current market state, evaluates price direction, and analyzes intraday performance.
-
Session Statistics — analyzes performance, volatility, and price behavior during the Asian, European, and US trading sessions.
-
Session Flow Analysis — examines how the European session historically responds to Asian session movements and how the US session continues or reverses the European session's direction.
-
Range Breakout Statistics — evaluates the historical frequency of breakouts beyond previous session highs and lows, returns to the range, and post-breakout price extensions.
-
Daily High & Low Statistics — analyzes when daily highs and lows have historically formed.
-
Historical Scenario Analysis — identifies similar historical market conditions and examines the distribution of their outcomes.
-
Expected Close Visualization — displays the statistically estimated session closing range, median, and upper and lower boundaries directly on the chart.
-
Automatic Session Map — visually marks trading sessions on the price chart.
1. TODAY — CURRENT MARKET
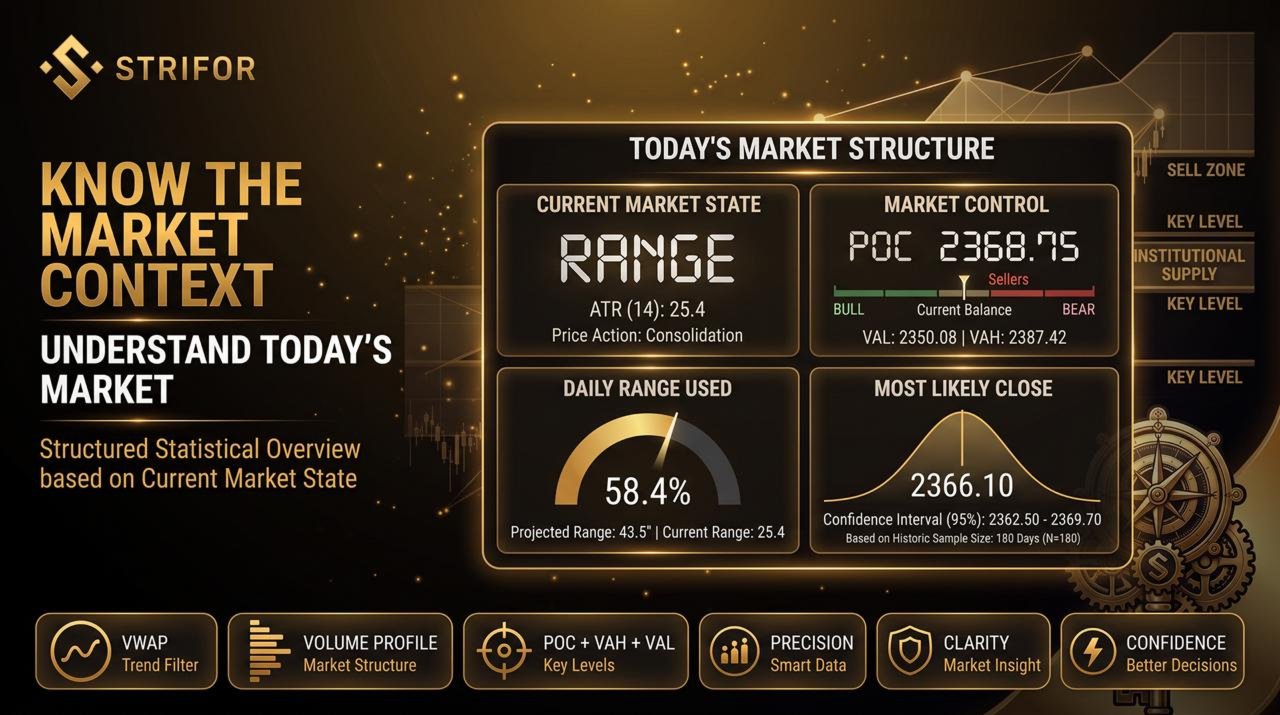
The main dashboard provides a quick overview of current market conditions.
The indicator automatically identifies the active trading session and displays key market parameters:
-
Market State — classifies the current market environment, including trends, ranges, and false breakouts.
-
Current Control — evaluates the current advantage of buyers or sellers.
-
Today Performance — displays daily price changes and the performance of individual trading sessions.
-
Range Used — shows the percentage of the average daily ATR range already covered by price.
-
Most Likely Close — identifies the most frequent historical closing scenario under comparable market conditions.
Additional information includes the historical sample size, the probability difference between the leading scenarios, and statistical signal quality metrics.
2. STATS — SESSION STATISTICS
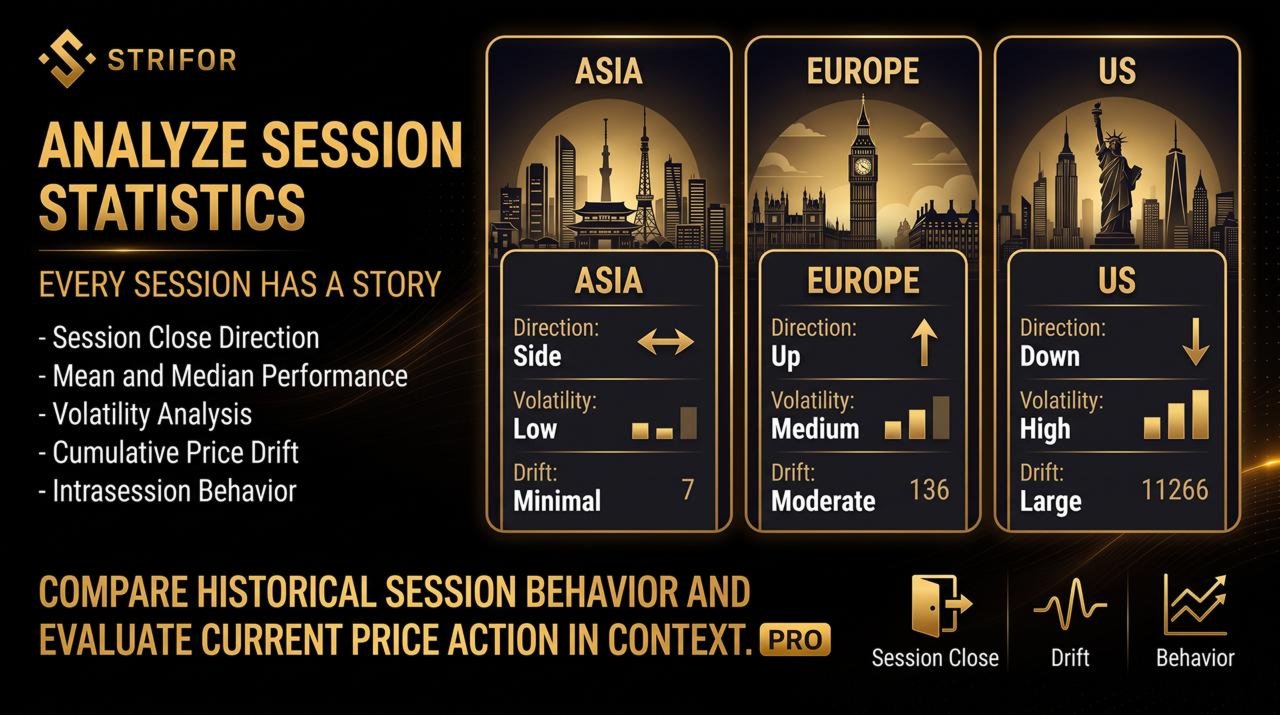
This section provides a detailed analysis of the historical behavior of a selected trading session.
Available metrics include:
-
Session Close Direction — how frequently the session closed above its opening price, below its opening price, or with little change.
-
Historical Baseline — the long-term distribution of session outcomes used to compare recent results with historical behavior.
-
Cumulative Drift — the cumulative directional movement across recent consecutive sessions.
-
Performance — average and median price changes.
-
Volatility — the average session range and the current session's position relative to historical observations.
-
Intrasession Behavior — the frequency of trends, ranges, reversals, range expansions, and false breakouts within a session.
These statistics help traders compare current market behavior with both recent and long-term historical patterns.
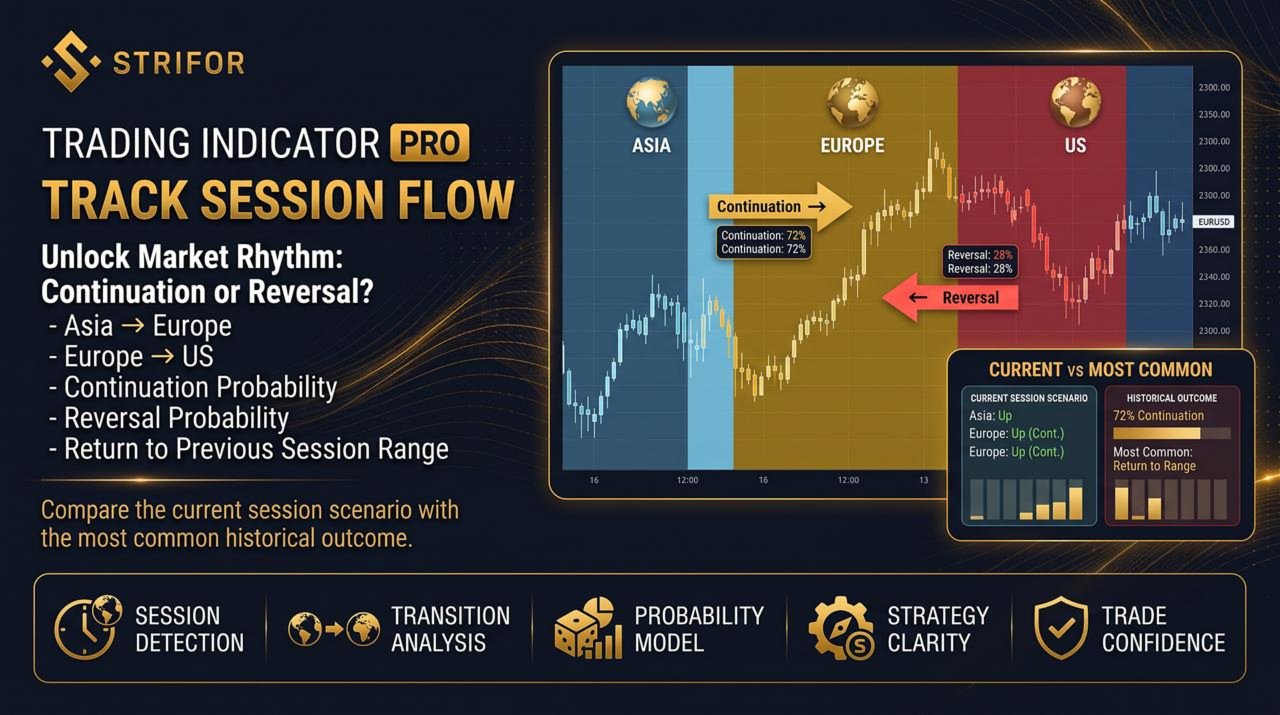
3. FLOW — SESSION FLOW
FLOW analyzes the relationship between consecutive trading sessions:
-
Asia → Europe
-
Europe → US
When a previous session ends with an upward move, a downward move, or a range-bound market, the indicator shows which scenarios have occurred most frequently during the following session.
The analysis covers:
-
Continuation of the previous move.
-
Directional reversal.
-
Return toward the previous session's range.
-
Closing near or within the previous session's range.
CURRENT represents the developing scenario for the current trading day, while MOST COMMON identifies the most frequent historical outcome under comparable conditions.
FLOW helps traders understand not only the direction of the previous session, but also how the market has typically behaved afterward in similar situations.
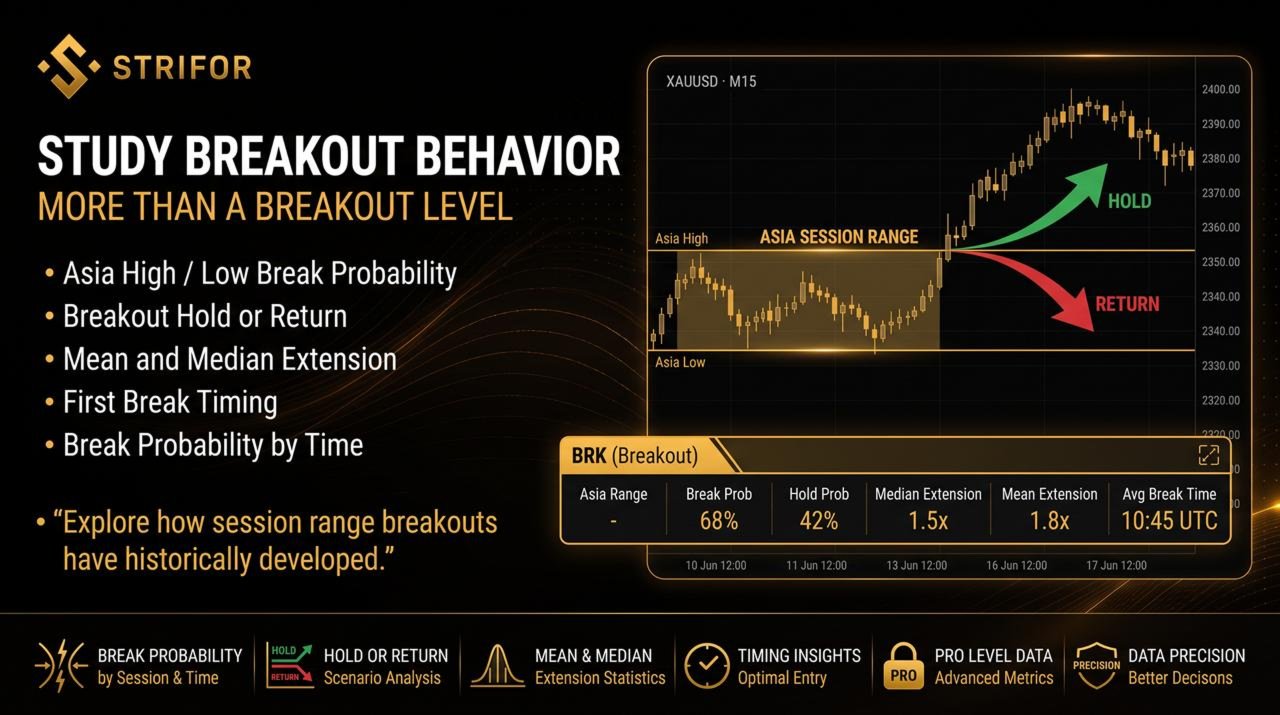
4. BRK — RANGE BREAKOUTS
This section focuses on breakouts beyond the ranges of previous trading sessions.
For example, when analyzing the European session relative to the Asian session range, the indicator evaluates the following metrics:
-
Probability of Break — the historical frequency of price breaking above the Asian session high or below its low.
-
Hold / Return — how frequently price remains beyond the broken boundary or returns inside the previous range.
-
Extension — the average and median price extension following a breakout.
-
First Break Timing — the distribution of the time when the first breakout occurs after the session opens.
-
Probability Break Has Occurred By — the cumulative probability that a breakout has occurred by a specific point in the session.
This section helps distinguish the likelihood of an initial range breakout from the historical frequency of price holding beyond the boundary or continuing its movement.
5. DAY STATS — DAILY STATISTICS
DAY STATS analyzes the structure of the trading day and the historical distribution of daily price extremes.
The indicator shows when the following have most frequently formed:
-
Daily High — the highest price of the trading day.
-
Daily Low — the lowest price of the trading day.
The analysis covers the Asian, European, and US sessions, as well as the periods between them.
Additional statistics examine price behavior around previous daily levels and price movement following the US session open.
This information helps traders study intraday market structure and the historical timing of daily highs and lows.
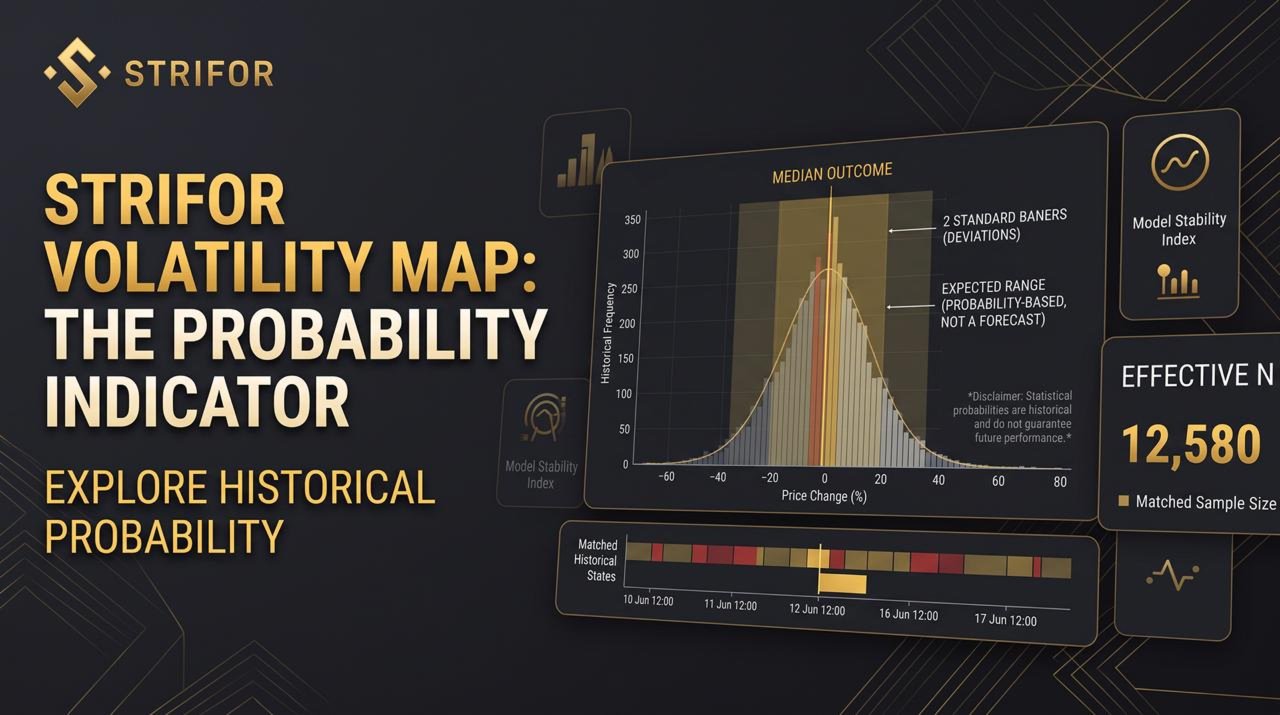
6. RCH — RESEARCH / HISTORICAL MODEL
The Research section provides a deeper analysis of current market conditions using historical analogues.
The model selects historical observations that match the characteristics of the current session and analyzes the distribution of their outcomes.
Key metrics include:
-
Matched States — the number of historical market states matching the comparison criteria.
-
Expected Close — the statistically estimated closing range.
-
Median — the median value of the historical outcome distribution.
-
Outcome Distribution — the distribution of possible closing scenarios relative to the previous session's range.
-
Effective N — the effective sample size available for statistical analysis.
-
Probability Spread — the difference between the probabilities of the leading scenarios.
-
Historical Accuracy / Model Stability — additional metrics for evaluating the quality and stability of the historical model.
This section allows traders to assess not only the most frequent scenario, but also the amount of available historical information, the distribution of alternative outcomes, and the stability of the statistical estimates.
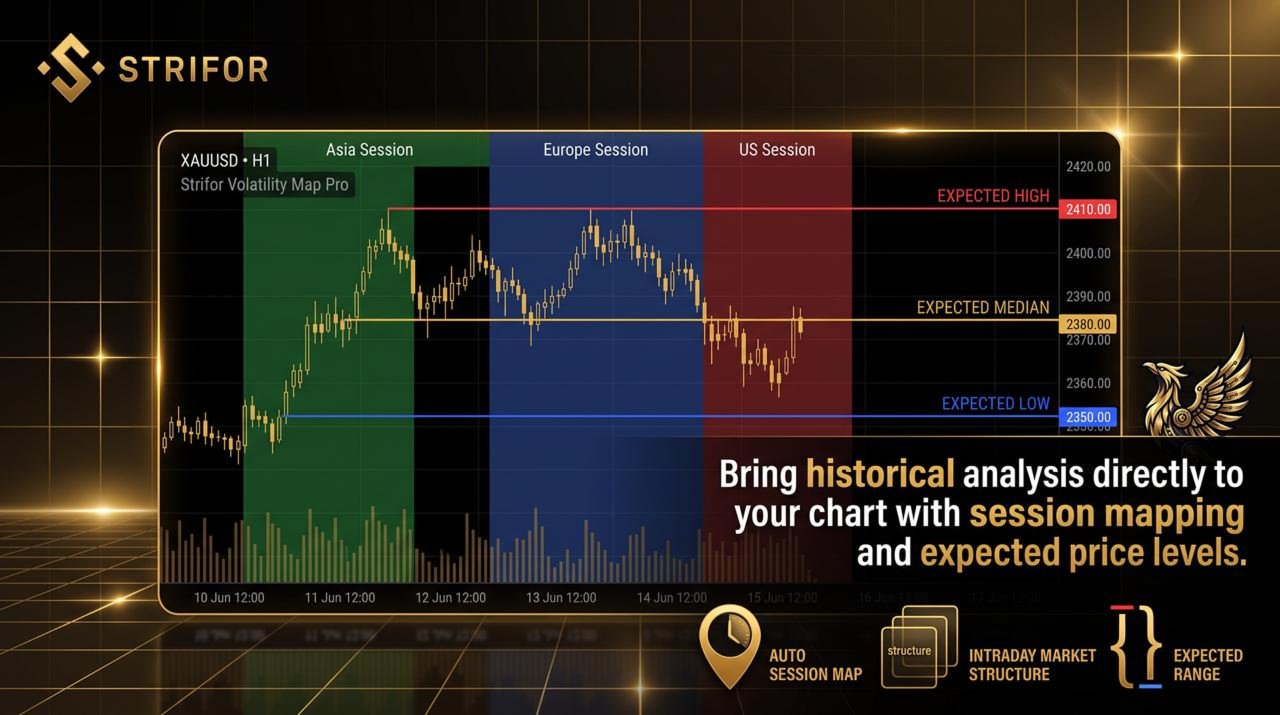
7. EXPECTED CLOSE ON CHART
Volatility Map Pro displays statistical estimates directly on the price chart.
-
Expected High — the upper boundary of the expected closing range.
-
Median — the median value of the historical distribution.
-
Expected Low — the lower boundary of the expected closing range.
These lines allow traders to compare the current price with the statistically estimated session closing range and observe how actual price action relates to historical analogues.
The displayed levels are statistical estimates, not guaranteed price targets.
8. SESSION MAP
Session Map automatically marks trading sessions directly on the price chart.
Traders can visually compare the sequence of Asia → Europe → US sessions, examine the direction and performance of completed sessions, and evaluate the relationships between their respective ranges.
This feature transforms a standard price chart into a visual map of intraday market behavior, combining price action analysis with historical statistics.
WHO IS VOLATILITY MAP PRO FOR?
The indicator may be useful for:
-
Intraday traders analyzing price movements throughout the trading day.
-
Breakout traders studying range boundaries and breakout behavior.
-
Forex and index traders examining intraday volatility.
-
Session-based strategy users who analyze market behavior across different trading sessions.
-
Statistical traders looking to complement technical analysis with historical data and scenario analysis.
WHY CHOOSE VOLATILITY MAP PRO?
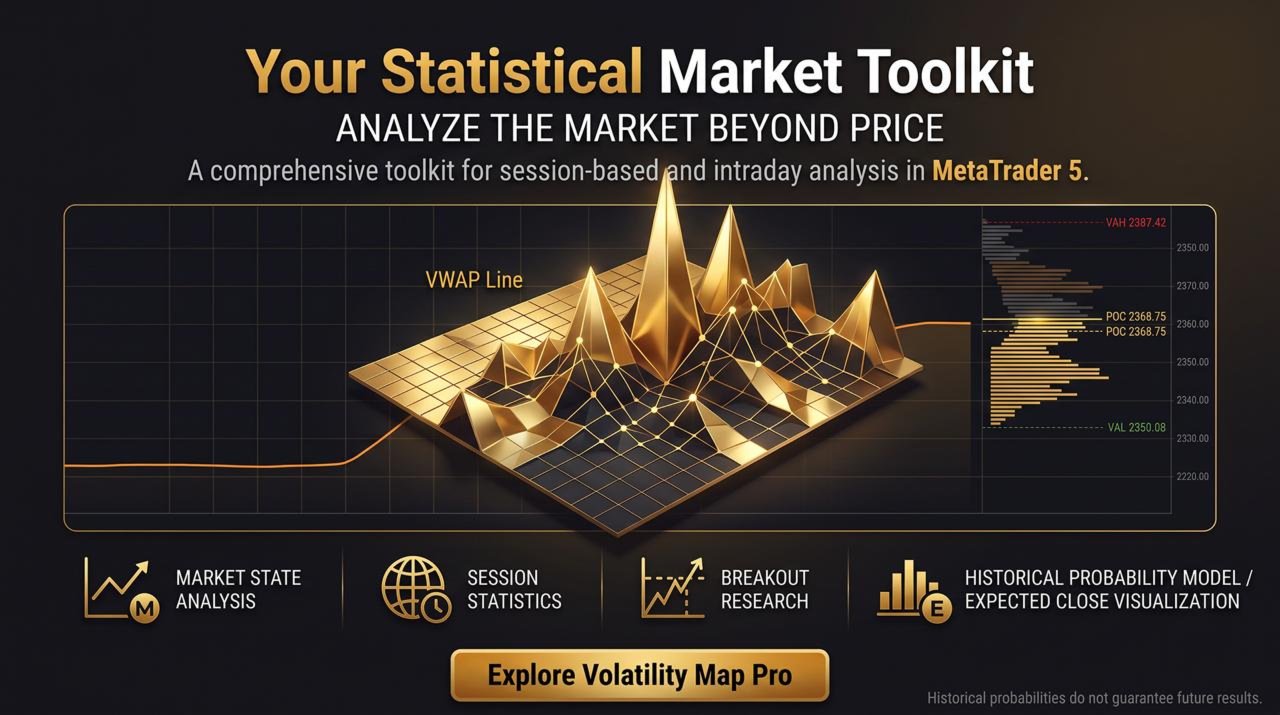
Volatility Map Pro combines current market analysis, trading session statistics, breakout research, and historical scenario comparison in one analytical tool for MetaTrader 5.
It helps traders investigate practical market questions:
-
What is happening in the market right now?
-
How does current volatility compare with historical conditions?
-
How has the market behaved under similar circumstances?
-
How frequently have breakouts led to continued movement or a return inside the range?
-
When have daily highs and lows most frequently formed?
-
How extensive and stable is the historical sample supporting a particular scenario?
Instead of relying exclusively on visual chart analysis, traders gain additional statistical information to support their independent assessment of market conditions.
Volatility Map Pro is a market analysis tool, not a ready-made trading signal generator.
IMPORTANT DISCLAIMER
Volatility Map Pro is intended for analytical and informational purposes only. Historical statistics, probabilities, and model estimates do not guarantee similar outcomes in the future. The indicator does not replace an independent trading strategy or appropriate risk management. All trading decisions and their outcomes remain the responsibility of the user.