Signal Confirm

Signal Confirm watches one symbol and tells you when a trend setup has passed a fixed chain of checks. It works on any symbol and any chart timeframe. It reads only the M1 prices, the prices of the oscillator timeframe (M5 by default) and the daily prices your terminal already has, does not use any server, does not send anything out, and does not open, change or close orders. It shows what happened and when; the decision stays with you.

What It Does

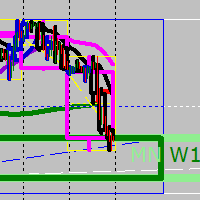
When the chain below is complete, the indicator draws an arrow on the entry candle (the candle that follows the confirming one) and, for the newest mark, three horizontal lines: the entry price, the stop and the target, all carrying the prefix SConf_ in their names. A short text in the corner of the chart says at which step the current setup is, shows the newest mark and the lot size that would risk the chosen percent of the account balance at that stop; the balance is only read and shown, nothing is sent. Earlier marks stay on the chart (the newest few hundred at most) so that you can see how each setup developed afterwards.

How A Setup Is Confirmed

Step 1, trigger: the momentum oscillator on its own timeframe (M5 by default) is at or above 55 (at or below minus 55 for a short setup), the M1 candle closes beyond the previous day's high (low), and the move from the previous close is at least 0.7 percent. The percentage is an input and should be lowered for currency pairs and raised for crypto symbols. Step 2, touch: within 480 minutes the price comes back to the trend dots on the same side (the dots are calculated inside this indicator, no other indicator is needed). The setup is dropped if the dots flip to the other side or the oscillator falls to 25 (for a short setup: rises to minus 25). Step 3, confirmation: within 120 minutes after the touch, the first M1 candle that closes beyond the extreme of the previous candle in the direction of the setup, with the dots on the same side and the oscillator at least 45 away from zero. By default the confirmation counts only inside two time windows of the UTC day (06:30 to 08:30 and 12:30 to 14:30); the windows can be changed or switched off. The entry mark is placed at the open of the next M1 candle. The stop is the dots level of the confirming candle and the target is 1.5 times the stop distance. The indicator then replays the setup on the prices that followed: the target, the stop, or the stop after break-even (the stop moves to the entry once the price has moved in its favour by half of the stop distance). When one candle reaches both the stop and the target, the replay counts the stop first. No new setup is searched while that replayed trade is still open, so marks never overlap, and the corner text can keep saying that it waits for a trigger during that time. At most three marks are drawn per day.

Reading The Chart

Blue arrows mark long setups, orange arrows mark short setups; both colours are inputs. The description of every arrow (open the arrow's properties) gives the entry, stop and target and how the setup ended on the prices that followed. For the newest mark the lines show where entry, stop and target lie; they run to the candle after the one on which the replayed trade ended (for a trade that is still open, one hour ahead of the latest candle). The corner text names the current step: waiting for a trigger, waiting for the touch, or waiting for the confirmation. If the history is not loaded yet the corner shows a short message and the marks appear when the data arrives.

Input Parameters

OscLong and OscShort - the trigger levels of the oscillator. OscConfirm - the level needed at the confirmation. OscCancel - the level that cancels a setup. DailyChangePct - the minimum move from the previous close. TouchWaitMin and ConfirmWaitMin - the time limits of step 2 and step 3. ProxAtr - how close to the dots counts as a touch, as a share of the average true range. StopBufAtr - an extra stop distance beyond the dots. TakeProfitK - the target as a multiple of the stop distance. MaxPerDay - the daily limit of marks. UseSessions with Win1From, Win1To, Win2From and Win2To - the two time windows as HHMM in UTC. ServerWinter, ServerSummer and UsDstRule - your broker's time zone. RiskPercent - the risk used for the lot size shown in the corner. HistBars - how many M1 candles are replayed. OscTF, OscWin, OscMult, DotsMult, AtrPer and EmaN - the oscillator timeframe, its normalising window and the trend-line settings of the oscillator and of the M1 dots. ShowLevels - draw the entry, stop and target lines of the newest mark. AlertPopup and AlertSound - the alerts. ColorLong and ColorShort - the colours of the arrows.

Alerts

An on-screen alert (if AlertPopup is on) and a sound (if AlertSound is on) come as soon as the confirming candle has closed and a new mark is drawn. There are no push messages, no e-mail and no sending of anything out of the terminal.

History And Data

The indicator needs M1 history of the symbol, the history of the oscillator timeframe (M5 by default) and D1 history that covers the replayed period; while that history is loading, the chart shows a short waiting message. On the first start it replays the last HistBars M1 candles to draw the older marks; after that it updates once per finished minute. Marks near the very start of the loaded history may differ from marks calculated with more history, because the oscillator depends on the path of the price.

Code Check

We checked the released build against an independent implementation of the same rules, written in Python and fed with the same terminal prices, on four symbols: gold, oil, a stock index and a crypto symbol. 57 marks came from the run with the time windows off and 21 from the run with them on, most with deliberately relaxed thresholds to get a sample large enough to compare. Every mark matched in time, side and entry price, and the terminal journal showed no errors from the indicator. The comparison checks that the code does what is described here; it does not say anything about how the setups behave in the market.

What This Product Is Not

It is not a trading signal service, it does not predict the market and it does not promise any result. A mark means only that a setup passed the checks above, nothing more. The time limits and distances that are not fixed by any single rule are our own choices; they are exposed as inputs so you can change them.

Notes

No trading functions, no network access, no files. Screenshots in this listing show the indicator on a demo symbol. They were taken with lowered thresholds (smaller oscillator levels and daily move, a wider touch distance, the time windows switched off, up to six marks a day) so that several marks fit on one chart; with the default values marks are rarer.

Support

Questions and bug reports through the product page comments. Please attach the symbol, the chart timeframe and the broker server time of the problem.

Recommended products
Sarangani Venom
Sherwin Dennis Tava Ruiz
sarangani venom is 100% profitable, easy to use indicator, a chart without indicator is stressful and will lead you to many losses, this indicator is pleasing to the eye that will gives you more confident to trade when there is signal, your computer will gives sound and the spider will animate, it can be used to all time frame and to all currency, you have many options, when the candlestick touches to upper line it is buy, when it touches to lower line it is sell, when the rope is pull to buy ar
The purpose of this new version of the MT4 standard indicator provided in your platform is to display in a sub-window multiple timeframes of the same indicator with its divergences. See the example shown in the picture below. But the display isn't like a simple MTF indicator. This is the real display of the indicator on its timeframe. Here's the options available in the FFx divergences indicator: Select the timeframes to be displayed (M1 to Monthly). Define the width (number of bars) for each ti
Crypto_Forex Indicator "FORCE index and 2 Moving Averages" for MT4. No repaint. - This indicator is excellent for momentum trading into the trend direction. - "FORCE index and 2 Moving Averages"  Indicator allows you to see Fast and Slow Moving Averages of Force index. - Force index is one of the top indicators that combines   price and volume data   into a single value. - Force index itself is powerful oscillator - that measures the amount of power used to move the price. - Indicator gives opp
Crypto_Forex Indicator "Stochastic Speed" for MT4 - great predictive tool, No Repaint. - The calculation of this indicator is based on equations from physics. - Stochastic Speed is the 1st derivative of Stochastic itself. - It is recommended to use Stochastic Speed indicator for Scalping momentum trading strategies to catch momentum main wave after correction (see pictures). - If Stochastic Speed is above 0 - this is positive speed: price momentum goes up. - If Stochastic Speed is below 0 - thi
SL Currency Heatmap
Chalin Saranga Jayathilake
5 (5)
Back testing can't; get indicator full performance  Trading the currency markets is a complex business. With so many pairs and multiple timeframes it is almost impossible to monitor them all – but with with the Currency Heatmap you can. The Currency Heatmap indicator delivers the information you need to base your trading decisions on the entire spectrum of currency pairs derived from the 8 major currencies; namely the US dollar, the Euro, the British Pound, the Swiss Franc, the Japanese Yen, t
Supply Demand Zone Lines Indicator Background The system automatically searches for supply and demand zones in the Chart and draws real-time key price lines. Traders can trade according to the price trading lines. Main Features The system automatically searches for supply and demand zones. The system also draws real-time key price lines. Traders can trade according to the price trading lines. Therefore, traders who use the supply and demand zone strategy no longer need to spend time looking for
The trading statistics indicator notifies the trader of the aggregate income of the trading account for different time intervals. The indicator has wide display settings on the graph. There is a choice of one of the two display languages on the chart- English and Russian. Settings Indicator language (ENG, RUS) - Select the language to display on the chart; To control the magic (-1: any magic) - Entering the Magic for control (-1: any Magic); Angle of indicator tie - Selecting the angle of the c
Indicador Taurus All4
Fabio Oliveira Magalhaes
Taurus All4 Taurus All4 is a high-performance indicator, it will tell you the strength of the trend, and you will be able to observe the strength of the candle. Our indicator has more than 4 trend confirmations. It is very simple and easy to use. Confirmation Modes Candle Trend Confirmations: When the candle switches to light green the trend is high. When the candle switches to light red the trend is reverting down. When the candle changes to dark red the trend is low. Trendline Trend Confirm
The indicator builds current quotes, which can be compared with historical ones and on this basis make a price movement forecast. The indicator has a text field for quick navigation to the desired date. Options: Symbol - selection of the symbol that the indicator will display; SymbolPeriod - selection of the period from which the indicator will take data; IndicatorColor - indicator color; Inverse - true reverses quotes, false - original view; Next are the settings of the text field, in w
Range Predictor
Suvashish Halder
Introducing the Range Predictor : Your Ultimate Guide to Future Trading Ranges! Imagine having the power to see into the future of market moves— Range Predictor brings this dream to life. Designed to deliver real-time, predictive support and resistance levels , this tool goes beyond standard indicators, offering trend direction insights and precise range forecasts . Whether you're a day trader or a swing trader, the Range Predictor is your all-in-one toolkit for mastering the markets. MT5 Ver
FutureTrade
Andrey Spiridonov
3 (2)
FutureTrade is one of the few indicators that predicts the price right on the price chart. The indicator calculation algorithm is based on the fast Fourier transform. Given the oscillatory behavior of the price, the Fourier function predicts its future behavior. The indicator should be attached in the usual way to a chart with the trading instrument specified symbol and with the M15 timeframe. This timeframe is the most optimal for working with any symbols. Once started, the indicator calculates
GeoWprPro
Georgij Komarov
WPR by Profile, or WPR for Professionals Geo_WprPro is one of the well-known currency profile indicators. It simultaneously displays two WPR indicators with different parameters in the matrix form on all timeframes of multiple currency pairs forming the currency profile . As follows from the description, " WPR is a leading indicator that often goes ahead of the price chart. The oscillator frequently reaches extreme values before the price reversal as if anticipating that event: it almost always
Renko Alerts
Jermaine Wedderburn
Renko Charts now have the alerts, we need. There are four alert types to choose from for notification on screen, email or phone notification. The alert types also have buffers for use with automation. This indicator can be incorporated with any system that requires renko charts. The four (4) alert types are: Three-bar Formation; Pinbar; Maubozu and Engulfing Bar The alerts may also be adjusted by settings found in the input window of the indicator.
PipFinite Breakout EDGE
Karlo Wilson Vendiola
4.93 (488)
The Missing Edge You Need To Catch Breakouts Like A Pro. Follow a step-by-step system that detects the most powerful breakouts! Discover market patterns that generate massive rewards based on a proven and tested strategy. Unlock Your Serious Edge Important information here www.mql5.com/en/blogs/post/723208 The Reliable Expert Advisor Version Automate Breakout EDGE signals using "EA Breakout EDGE" Click Here Have access to the game changing strategy that will take your trading to the next l
Divergence Matrix Pro for MetaTrader 4 Divergence Matrix Pro is a confirmed multi-oscillator divergence indicator for MetaTrader 4. It detects regular and hidden divergence between price and selected oscillators, then presents the confirmed structure through divergence lines, pivot labels, action markers, an optional current-timeframe Matrix Panel and optional alerts. The indicator is an analysis and confirmation tool. It does not open or close trades, and the signal score is not a win rate or a
SRP Pro
Farhad Kia
5 (1)
Strong Retracement Points Pro edition! SRP (Strong Retracement/Reversal Points) is a powerful and unique support and resistance indicator. It displays the closest important levels which we expect the price retracement/reversal! If all level are broken from one side, it recalculates and draws new support and resistance levels, so the levels might be valid for several days depending on the market! If you are still hesitating to start using this wonderful tool, you can check this link to see how ef
Prophet
Andriy Sydoruk
Prophet is a trend indicator. Shows the direction of turning points. Can be used with an optimal risk-to-profit ratio. The arrows indicate favorable moments and directions for entering the market. Uses one parameter for setting (adjust from 1 to 3). The probability of a successful trend is very high. In the course of work, the take-profit is much larger than the stop-loss! Works on all currency pairs and on all timeframes.
This indicator is another variant of the famous powerful indicator Fibonacci-SS https://www.mql5.com/en/market/product/10136 but has different behaviour in placing Pending Order and TP Line. Automatically places Fibonacci retracement lines from the last highest and lowest visible bars on the chart with: An auto Pending Order (Buy/Sell). Taking Profit 1, Taking Profit 2 is pivot point and Taking Profit 3 for extended reward opportunity. The best risk and reward ratio. Simple and powerful indicat
Smart Trend Forecasting Slope-Based Trend Analysis Indicator with Alert Support Overview Smart Trend Forecasting is a slope-based trend analysis indicator derived from a classic moving average trend model originally developed by Wizard Serg and referenced in Forex Magazine #104. The indicator is designed to monitor: Trend direction Momentum shifts Trend transition conditions Moving average slope behavior It includes visual markers and configurable alert notifications for trend state changes. Ma
Watch the Clock
David Leander Tschacher
Watch the Clock shows a clock at a desired position. The clock is useful if you want to check when a candle closes. You can also set an alert to be prepared before the news. ️ Watch the Clock works also in the strategy tester. ️ Watch the Clock requires a minimum of CPU power. ️ Watch the Clock can improve your manual style of trading. Inputs Alert -> At which time should the alert occur? Time Shift in Minutes -> Should the time be incremented by x minutes? Size -> The font size of the tim
Most professional traders declare strict compliance with risk management. This simple tool allows quick calculation of trading lot size in accordance with the following basic risk management rules: The maximum allowable risk is set as a fixed percentage of the account deposit (for example, 1-2%). The risk is measured as a distance in points between the order opening level and the stop loss level. It is always difficult for beginners to calculate trade lot based on the risk value, so this indicat
The arrow indicator "Cool volumes" is based on tick volumes on Mt4. The indicator itself tracks the number of volumes to buy or sell in a certain period of time (timeframe selection). And when there is an abnormal excess of the volume of sellers or buyers, it gives a signal to sell or buy. Colored histograms are drawn in the lower window, where the green color shows the predominance of buyers at the moment, which means a potential immediate reversal to increase in this price range. The red co
Sinyal Tren Non-Repaint Cerdas Pro Smart Non-Repaint Trend Signal Pro adalah indikator teknis yang ampuh dan sangat andal yang dirancang untuk MetaTrader 4. Indikator ini menggabungkan logika pengikut tren yang cerdas dengan pelacakan pembalikan berbasis momentum untuk memberikan sinyal panah Beli dan Jual dengan probabilitas tinggi dan siap pakai langsung pada grafik Anda. Dengan menyaring kebisingan pasar, indikator ini membantu baik trader pemula maupun veteran untuk menangkap pergerakan pas
Gold Signal Swing Pro XAUUSD with Auto TP SL (MT4) — 7-Layer Filter + RR Guarantee System for XAUUSD Swing Trading No repaint. No redraw. No lag. All signals lock after confirmation. Bonus for buyers: Get AI Zone Radar ($59 value) + PDF manual free with purchase. Send me a message on MQL5 after buying. AI Zone Radar: https://www.mql5.com/en/market/product/175834 MT5 version also available: https://www.mql5.com/ja/market/product/177643?source=Site +Profile+Seller Used and trusted by gold traders
Szia! Egy indikátorral. Több idő gyertyájának kirajzoltatása egy charton. Különböző színek rendelhetők a long és short gyertyákhoz. Vonal vastagsága állítható. A gyertya kitöltése engedélyezhető. Hello! With an indicator. Drawing multiple time candles on a chart. Different colors can be ordered for long and short candles. Line thickness can be adjusted. Filling the candle can be allowed. Videó: https://www.youtube.com/watch?v=-9bequnAw-g&amp ;ab_channel=GyulaKlein
Achieving Goal is a trend indicator for the MetaTrader 4 trading platform. This indicator allows you to find the most likely trend reversal points. You will no longer find a copyright indicator like this. A simple but effective system for determining the forex trend. From the screenshots you can see for yourself the accuracy of this tool. It works on all currency pairs, stocks, raw materials, cryptocurrencies. Are you tired of the constant ups and downs? It is not worth becoming a victim of un
The RSI Panel MTF indicator has been created in order to have the ability to monitor the values of the standard RSI indicator from a multitude of timeframes and symbols on a single chart, as well as to receive timely notifications about the trading opportunities using an audio signal or a notification. The indicator can output both the indicator values, and only the indicator signals (confirmed and expected). A user-friendly feature for selecting the required symbol has been implemented - simply
Forex Gump
Andrey Kozak
2.4 (5)
Forex Gump is a fully finished semi-automatic trading system. In the form of arrows, signals are displayed on the screen for opening and closing deals. All you need is to follow the instructions of the indicator. When the indicator shows a blue arrow, you need to open a buy order. When the indicator shows a red arrow, you need to open a sell order. Close orders when the indicator draws a yellow cross. In order to get the most effective result, we recommend using the timeframes H1, H4, D1. There
GoldTrend MT4
Sopany Zemmy
5 (1)
GoldTrend MT4 - is  a leading indicator for Gold on MetaTrader 4 - In Update version has been added new ability on USD pairs     ( AUDUSD, EURUSD, GBPUSD, NZDUSD, USDCAD, USDCHF, USDJPY ) - very easy to use , even for beginners - Stoploss and Take Profit provided - no repaint, no redraw and no lagging  When you decide to enter the global market ,  then there is a technical skill you absolutely must have, - which is all about trends . Why - GoldTrend is different from others : Not only uptre
ToolBox 360 is the swiss knife of all indicators. It is full packed with useful tools to help you with your trading. It can be used to find best entry and exit points and help you to decide if you should open a trade or not. It shows market trends, candlestick formations outside / inside bars and you can sett time based allerts. Main features: Time based Fibonacci lines Choose a start and end time and the indicator shows you Fibonacci lines within the selected time range including range high a
Buyers of this product also purchase
Trend SniperX MT4
Sarvarbek Abduvoxobov
5 (5)
Trend Sniper X is a multi-timeframe trend-following indicator for MetaTrader 5 that helps traders identify trend direction and potential reversal points with clarity and precision. For MT5: https://www.mql5.com/en/market/product/181101 Price Information: The current price is promotional and is subject to change as upcoming updates and new features are released. Code2Profit Channel Master the Market with Multi-Timeframe Analysis! How to Maximize Your Win Rate with Trend Sniper X: Key Rules & Sess
M1 Sniper
Oleg Rodin
4.97 (30)
M1 SNIPER  is an easy to use trading indicator system. It is an arrow indicator which is designed for M1 time frame. The indicator can be used as a standalone system for scalping on M1 time frame and it can be used as a part of your existing trading system. Though this trading system was designed specifically for short-term trading, it still can be helpful for all traders. This trading system can be used with any forex pair and time frame, though lower time frames are recommended from M1 up to M

SR Liquidity
Oleg Rodin
5 (2)
SR Liquidity is a trading indicator designed to reveal the hidden zones where market liquidity concentrates and price reacts most strongly. These special liquidity areas act as powerful support and resistance levels, giving you a clear map of where the market is most likely to reverse. Instead of drawing ordinary Support/Resistance lines, SR Liquidity analyzes real price behavior to detect the zones where buying and selling pressure accumulate. These are actually the pools of liquidity that driv
Top Bottom Tracker is an indicator based on sophisticated algorithms that analyse the market trend and can detect the highs and lows of the trend / MT5 version . The price will progressively increase until it reaches 500$. Next price --> $99 Features No repainting This indicator does not change its values when new data arrives Trading pairs All forex pairs Timeframe     All timeframes Parameters ==== Indicator configuration ==== Configuration parameter // 40 (The higher the value, the
Smart Trend Trading System is a chart indicator for MetaTrader 4 that brings trend information, entry and exit signals, and price levels into one workspace. It combines 10+ trading tools into one system, including trend detection, reversal zones, smart cloud, trailing stop logic, support and resistance, candle coloring, alerts, and multi-timeframe analysis. The system is designed to help you trade different market conditions: Trending markets: Identify the main trend, detect pullbacks, follow mo
Miraculous Indicator Binary & Forex v3 StrategySafe Miraculous Indicator Binary & Forex v3 StrategySafe is a professional trading indicator designed for traders who want clear signals, powerful confirmation tools, and a structured way to analyze both Binary and Forex markets. This version brings a stronger trading experience with advanced dashboards, GANN Law analysis, Square of 9 levels, angle confirmation, and a clean StrategySafe approach that helps traders filter stronger setups instead of e
PRO Renko System
Oleg Rodin
5 (31)
PRO Renko System is a highly accurate trading system specially designed for trading RENKO charts. The ARROWS and Trend Indicators DO NOT REPAINT! The system effectively neutralizes so called market noise giving you access to accurate reversal signals. The indicator is very easy to use and has only one parameter responsible for signal generation. You can easily adapt the tool to any trading instrument of your choice and the size of the renko bar. I am always ready to provide extra support to help
Liquidity Scalper System: a liquidity-based trading system in indicator form. Most indicators only show an arrow, and the trader then has to decide where the stop goes, where the target is and whether the signal can be trusted at all. Liquidity Scalper System covers the full trade cycle: it finds liquidity pools, gives a signal when they are broken, immediately calculates Entry, Stop Loss and three targets, and shows statistics and out-of-sample test results on the panel. The system picks its o
Gann Made Easy
Oleg Rodin
4.84 (172)
Gann Made Easy is a professional and easy to use Forex trading system which is based on the best principles of trading using the theory of W.D. Gann. The indicator provides accurate BUY and SELL signals including Stop Loss and Take Profit levels. You can trade even on the go using PUSH notifications. PLEASE CONTACT ME AFTER PURCHASE TO GET TRADING  INSTRUCTIONS   AND GREAT EXTRA INDICATORS  FOR FREE! Probably you already heard about the Gann trading methods before. Usually the Gann theory is a
Atomic Analyst
Issam Kassas
5 (13)
Atomic Analyst — MetaTrader 4 For product questions, setup guidance, or technical support, message me directly here on MQL5. The indicator turns complex market calculations into simple visual signals, color-coded candles, trend readings, stop-loss levels, and multiple take-profit zones that traders can understand quickly and use in real market conditions. Main Trading Uses: Scalping and intraday trading: Designed for fast decision-making, clear arrows, alerts, candle colors, and structured entry
This is a professional chart indicator designed for traders focused on stability and clear price action. It helps filter market noise and provides clear visual entry and exit zones for your trading decisions. Core Features: Strictly Non-Repainting: The system is built with strict non-repaint logic. What you see on the chart is the true historical performance. Confirmed Signals: Signals are triggered and confirmed only after the candle closes . Once a trading arrow appears on a closed candle, it
Scalper Vault
Oleg Rodin
5 (39)
Scalper Vault is a professional scalping system which provides you with everything you need for successful scalping. This indicator is a complete trading system which can be used by forex and binary options traders. The recommended time frame is M5. The system provides you with accurate arrow signals in the direction of the trend. It also provides you with top and bottom signals and Gann market levels. The indicator provides all types of alerts including PUSH notifications. PLEASE CONTACT ME AFT
Introduction to Fractal Pattern Scanner Fractal Indicator refers to the technical indicator that makes use of the fractal geometry found in the financial market. Fractal Pattern Scanner is the advanced Fractal Indicator that brings the latest trading technology after the extensive research and development work in the fractal geometry in the financial market. The most important feature in Fractal Pattern Scanner is the ability to measure the turning point probability as well as the trend probabi
Volume Break Oscillator is an indicator that matches price movement with volume trends in the form of an oscillator. I wanted to integrate volume analysis into my strategies but I have always been disappointed by most volume indicators, such as OBV, Money Flow Index, A/D but also as Volume Weighted Macd and many others. I therefore wrote this indicator for myself, I am satisfied with how useful it is, and therefore I decided to publish it on the market. Main features: It highlights the phase
PZ Divergence Trading
PZ TRADING SLU
5 (2)
Unlock hidden profits: accurate divergence trading for all markets Tricky to find and scarce in frequency, divergences are one of the most reliable trading scenarios. This indicator finds and scans for regular and hidden divergences automatically using your favourite oscillator. [ Installation Guide | Update Guide | Troubleshooting | FAQ | All Products ] Easy to trade Finds regular and hidden divergences Supports many well known oscillators Implements trading signals based on breakouts Display
Advanced Supply Demand
Bernhard Schweigert
4.91 (302)
Trading Special – 30% OFF Best Solution for any Newbie or Expert Trader! This indicator is a unique, high quality and affordable trading tool because we have incorporated a number of proprietary features and a new formula. With this update, you will be able to show double timeframe zones. You will not only be able to show a higher TF but to show both, the chart TF, PLUS the higher TF: SHOWING NESTED ZONES. All Supply Demand traders will love it. :) Important Information Revealed Maximize the pot
Trend Catcher ind
Ramil Minniakhmetov
5 (11)
TREND CATCHER INDICATOR Trend Catcher Indicator analyzes market price movements, using a combination of the author’s proprietary and customized adaptive trend-analysis indicators.  It identifies the true market direction by filtering out short-term noise and focusing on underlying momentum strength, volatility expansion, and price structure behavior.  It also uses a combination of smoothing and trend-filtering customized indicators such as moving averages, RSI, and volatility filters.   Real ope
The Super Arrow Indicator provides non-repainting buy and sell signals with exceptional accuracy. Key Features No repainting – confirmed signals remain fixed Clear visual arrows: green for buy, red for sell Real-time alerts via pop-up, sound, and optional email Clean chart view with no unnecessary clutter Works on all markets: Forex, gold, oil, indices, crypto Adjustable Parameters TimeFrame Default: "current time frame" Function: Sets the time frame for indicator calculation Options: Can be set
Apollo SR Master is a Support/Resistance indicator with special features which make trading with Support/Resistance zones easier and more reliable. The indicator calculates Support/Resistance zones in real-time without any time lag by detecting local price tops and bottoms. Then to confirm the newly formed SR area, the indicator shows special signal which signalizes that the SR zone can be taken into consideration and used as an actual SELL or BUY signal. In this case the strength of the SR zone
Trading Special –40% OFF Best Solution for any Newbie or Expert Trader! This Indicator is a unique, high quality and affordable trading tool because we have incorporated a number of proprietary features and a new formula. With only ONE chart you can read Currency Strength for 28 Forex pairs! Imagine how your trading will improve because you are able to pinpoint the exact trigger point of a new trend or scalping opportunity? User manual: click here That's the first one, the original! Don't buy a
KURAMA GOLD SIGNAL PRO (MT4) — 7-Layer Filter, Auto TP/SL, Quality Score & Signal History Save | Complete XAUUSD Trading System No repaint in real time. The moment a signal appears, the arrow, entry, TP and SL are locked on the spot and never move afterward. What you trade is this real-time signal. And in v7.20, every signal that is actually sent is auto-saved and restored exactly after restart. BUYER BONUS Buy the lifetime license and receive AI Zone Radar (
DayTrader PRO MT4
Davit Beridze
4.6 (10)
DayTrader PRO (Buy DayTrader PRO and Get another Paid Self Optimizing indicator for Free as Bonus) MT5:  https://www.mql5.com/en/market/product/186222 DayTrader PRO   is an advanced trading indicator that combines John Ehlers' Laguerre Filter with a powerful Auto-Optimization Engine. Instead of using fixed parameters, the indicator automatically searches for the best settings based on recent market conditions, helping you adapt to changing volatility without constant manual adjustments. The in
Forex Breath System is a trend based trading system which can be used with any market. You can use this system with currencies, metals, commodities, indices, crypto and even stocks. It can also be used with any time frame. The system is universal. It shows trend and provides arrow signals with the trend. The indicator can also provide you with a special type of alerts when the signals appear in the direction of the trend which makes trend trading an easy task. The indicator is very easy to use a
Prop Firm Sniper
Mohamed Hassan
4.33 (6)
Prop Firm Sniper MT4  is a professional market structure indicator that automatically identifies high-probability BUY and SELL opportunities using BOS and CHoCH analysis. Recommended Timeframes: For backtesting, use the indicator on   M5 or M15   for Gold (XAUUSD), and   M15 or H1   for more volatile Forex pairs such as   GBPUSD, USDJPY, EURGBP , and similar markets. CONTACT ME AFTER PURCHASE TO CLAIM YOUR FREE BONUSES! Prop Firm Sniper  is a professional market structure indicator designed t
Scalping Points Pro is an indicator that shows possible price reversal points on the chart and does not redraw its signals. Also, the indicator sends signals to the trader via Email and Push. The accuracy of the signals of this indicator is approximately 92-94% on the M5 timeframe and more than 95% on the H1 timeframe. Thus, this indicator allows the trader to accurately open trades and predict further price movement. The indicator does not redraw its signals.  The indicator works on timeframe
PZ Wedges
PZ TRADING SLU
3 (2)
Boost your trading precision with the versatile wedges tool The PZ Wedges Indicator is a technical analysis tool that helps traders identify potential continuation patterns in the market. These patterns, known as wedges, are formed when the price of an asset consolidates within a narrowing range, bounded by upward or downward converging trendlines. Wedges are considered to be continuation patterns because they often precede a breakout in the direction of the preceding trend. When a wedge pattern
Matrix Arrow Indicator MT4
Juvenille Emperor Limited
5 (3)
Matrix Arrow Indicator MT4  is a unique 10 in 1 trend following 100% non-repainting  multi-timeframe indicator that can be used on all symbols/instruments: forex, commodities, cryptocurrencies, indices, stocks.  Matrix Arrow Indicator MT4 will determine the current trend at its early stages, gathering information and data from up to 10 standard indicators, which are: Average Directional Movement Index (ADX) Commodity Channel Index (CCI) Classic Heiken Ashi candles Moving Average Moving Avera
Currency Strength Wizard is a very powerful indicator that provides you with all-in-one solution for successful trading. The indicator calculates the power of this or that forex pair using the data of all currencies on multiple time frames. This data is represented in a form of easy to use currency index and currency power lines which you can use to see the power of this or that currency. All you need is attach the indicator to the chart you want to trade and the indicator will show you real str
Currency Strength Matrix
Raymond Gilmour
4.5 (26)
THE ONLY CURRENCY STRENGTH INDICATOR BUILT ON PRICE ACTION Most currency strength meters average an oscillator, or measure how far price has travelled. But these are not accurate measures of trend, Currency Strength Matrix measures trend strength, not just if a currency price has gone up or down. Currency Strength Matrix reads market structure . For each of the 28 major pairs it finds the confirmed cycle highs and lows, and decides whether that pair is in an uptrend, a downtrend, or neither. A
Introduction Harmonic Patterns are best used to predict potential turning point. Traditionally, Harmonic Pattern was identified manually connecting peaks and troughs points in the chart. Manual harmonic pattern detection is painfully tedious and not suitable for everyone. You are often exposed under subjective pattern identification with manual pattern detection. To avoid these limitations, Harmonic Pattern Plus was designed to automate your harmonic pattern detection process. The functionality
More from author
Swept Liquidity Pools
Vasilii Makarenko
5 (1)
A liquidity sweep is a bar that pushes past a prior swing high or swing low, where protective stop orders tend to rest, and then closes back on the inner side of that level. The same event is known under several names: a stop hunt, a stop run, a liquidity grab, a false breakout, a failed breakout, or a swing failure. Swept Liquidity Pools marks those levels and those bars on the chart. The indicator tracks liquidity pools - confirmed swing levels that have not yet been taken - and marks the exac
FREE
Auto Level Map
Vasilii Makarenko
What Gets Drawn Most level tools mark every swing they can find, and a chart with forty lines answers nothing. This one keeps a level only when price came back to it, and prints the evidence next to the line: the number of touches and the age in days. Lines above current price and lines below it are drawn in different colours, so the map reads at a glance without counting. What Puts A Level On The Chart A swing high is a bar whose high is not lower than its neighbours on both sides, within the n
FREE
Hourly Spread Map answers one question: at which hours does this symbol cost more to enter, and by how much. It reads the spread field that the terminal stores in every closed M1 bar of your own broker feed, sorts those measurements into 24 hours by 7 days of the week, and shows the result as a grid in the indicator sub-window. What It Measures Every closed M1 bar carries one spread measurement. The indicator collects them over the period you choose, groups them by the hour and weekday of the ba
FREE
Three Anchors On One Chart Most volume weighted average lines restart once a day. This one draws three at the same time: one anchored to the current trading session, one to the day, one to the week. Their spread tells you something a single line cannot. When the session line sits far under the weekly one, the week has been trading higher than today is; when all three sit together, the market has spent the week in one place. Why The Session Anchor Is Not Midnight The session line starts where the
FREE
What It Shows Candle Clock Desk puts four lines on the chart. The first is the time left until the current bar closes. The next three answer a question the clock alone cannot: is this bar unusually busy, or unusually quiet, right now. Bar closes in - the countdown, in minutes and seconds So far - volume this bar has accumulated since it opened Usual here - what this symbol had accumulated by this same minute, in the past Pace - the first divided by the second The Pace Line Pace of 1.00 means the
FREE
Swap is the part of the cost that is easy to forget, because it arrives once a day, quietly, and never appears in the spread. Swap Cost Calendar puts it on the chart as a number you can act on. What It Shows The panel reads what the broker publishes for the current symbol and shows four things. The cost of one night for a long position and for a short one, in your account currency or in points. The weekday line, showing how many nightly charges a position carries on each day of the week. The tri
FREE
Trade Risk Desk
Vasilii Makarenko
Trade Risk Desk answers one question at the moment you need it answered: what volume makes this stop cost exactly what you decided to risk. Drag the stop line to where it belongs on the chart and the panel prints the volume, the money behind it, and the margin the position will hold. What It Answers Set the risk as a percent of balance or as a fixed amount in account currency. Put the stop where your idea says it belongs. The panel reads the symbol settings your broker publishes and prints: the
FREE
Range Zones M30
Vasilii Makarenko
Range Zones M30 draws zones on your chart where price was pushed back hard on the 30-minute timeframe. It works on any symbol and any chart timeframe, and reads only the prices your terminal already has. It does not use any server, does not send anything out, and does not open or change orders. What It Shows A resistance zone above the market and a support zone below it, as filled rectangles that start at the open of the swing candle that formed them and run to the right. At any moment there is
A liquidity pool is a confirmed swing high or swing low that has not yet been taken. A liquidity sweep is the bar on which price trades beyond that level and then closes back inside the range - the same event traders also call a stop hunt, a stop run, a liquidity grab or a false breakout. Liquidity Sweep Pools MTF marks both the pools and the liquidity sweeps taken on them, on the current chart and on a higher timeframe you choose, and adds a live panel of active pools, a volume filter on pool f
Structure Desk
Vasilii Makarenko
An expert advisor for XAUUSD on MetaTrader 5. It works one basket at a time: it opens in a fixed set of server hours, adds to the position while price moves against it, and closes the whole basket together. There is no stop loss and no take profit on individual positions. How It Trades One symbol, XAUUSD, one basket at a time, up to 5 orders in the same direction. Entries are allowed only in fixed server hours, and only when price sits at the edge of its four-hour range. Entries are blocked betw
Sarveon
Vasilii Makarenko
Sarveon is an expert advisor for XAUUSD on MetaTrader 5. Nine independent strategies run side by side on one chart. Each has its own magic number, its own entry timeframe and its own set of distances, and none of them ever adds to a position opened by another. How It Trades Each strategy scans the recent bars of its own entry timeframe for a swing level: a high that no later bar has exceeded, or a low that no later bar has broken. The level must sit at a minimum distance from the current price,
Ridgeline
Vasilii Makarenko
Ridgeline waits at the price levels that gold has left alone. It reads daily bars, marks the highs and lows that no later bar has taken out, and parks a pending stop order there. Seven sets of rules search at different depths of history, so one may be waiting at a level formed last week while another watches one from three months back. A set that takes a loss stands down for two days before it places anything again. Each set carries its own magic number and its own distances, and no set ever add
Sixfold Gold
Vasilii Makarenko
Sixfold Gold trades XAUUSD on the hourly chart. It looks for the points where the market turned and left an extreme behind, places a pending stop order a little inside that level, and attaches a stop loss and a take profit before the order is ever filled. Six zones do this independently, each with its own search depth, and between them they read three timeframes and four sessions, so the advisor is rarely committed to a single view of the market. A trade that goes wrong is closed by its stop. No
GhBreak
Vasilii Makarenko
GhBreak is built on one idea about gold: a break of a swing high or low that has held since it formed can run far enough to pay for the breaks that fail. The EA does not chase the break. A pending stop order is already waiting at the level, with its stop and target attached, before price gets there. Positions are held briefly: in the report below the average one lasted 22 minutes. The Swing Level Each set of rules builds its own bars - H2, H4 or D1 - from hourly data and looks for the latest swi
One Panel Instead Of Five Windows Reading a market usually means keeping several windows open at once: a moving average for the direction, an oscillator for momentum, a strength indicator to tell a trend from a range, and something else again for the levels. Each one answers its own question in its own corner of the screen. Signal Compass Desk puts those readings into a single block in the corner of the chart. One look tells you which way the market is leaning, whether the move is gaining or los
Pivot Stop Gold
Vasilii Makarenko
Pivot Stop Gold is built around one situation on gold: price turns at a swing and then moves through it. The EA does not chase the move. A pending stop order is already waiting near the swing, with its stop and target attached, before price gets there. Positions are short: in the report below the average one lasted five minutes. The Pivot Level On every new bar of its working timeframe the EA builds a ZigZag from the last 300 bars and takes the two latest pivots, never counting the bar that is s
Tessera builds a footprint (cluster) chart from the trade ticks that your MetaTrader 5 terminal already receives from your broker. Prices, volumes and sides come from your own data feed; the indicator does not use any external server, does not send anything out and does not read or store your account details. What It Shows Buy and sell volume inside each bar, price by price, with numbers when they fit. Delta of the bar (the difference between buy and sell volume), cumulative delta and a delta st
Filter:
No reviews
Reply to review