Auto Level Map
- Indicators
- Version: 1.0

What Gets Drawn
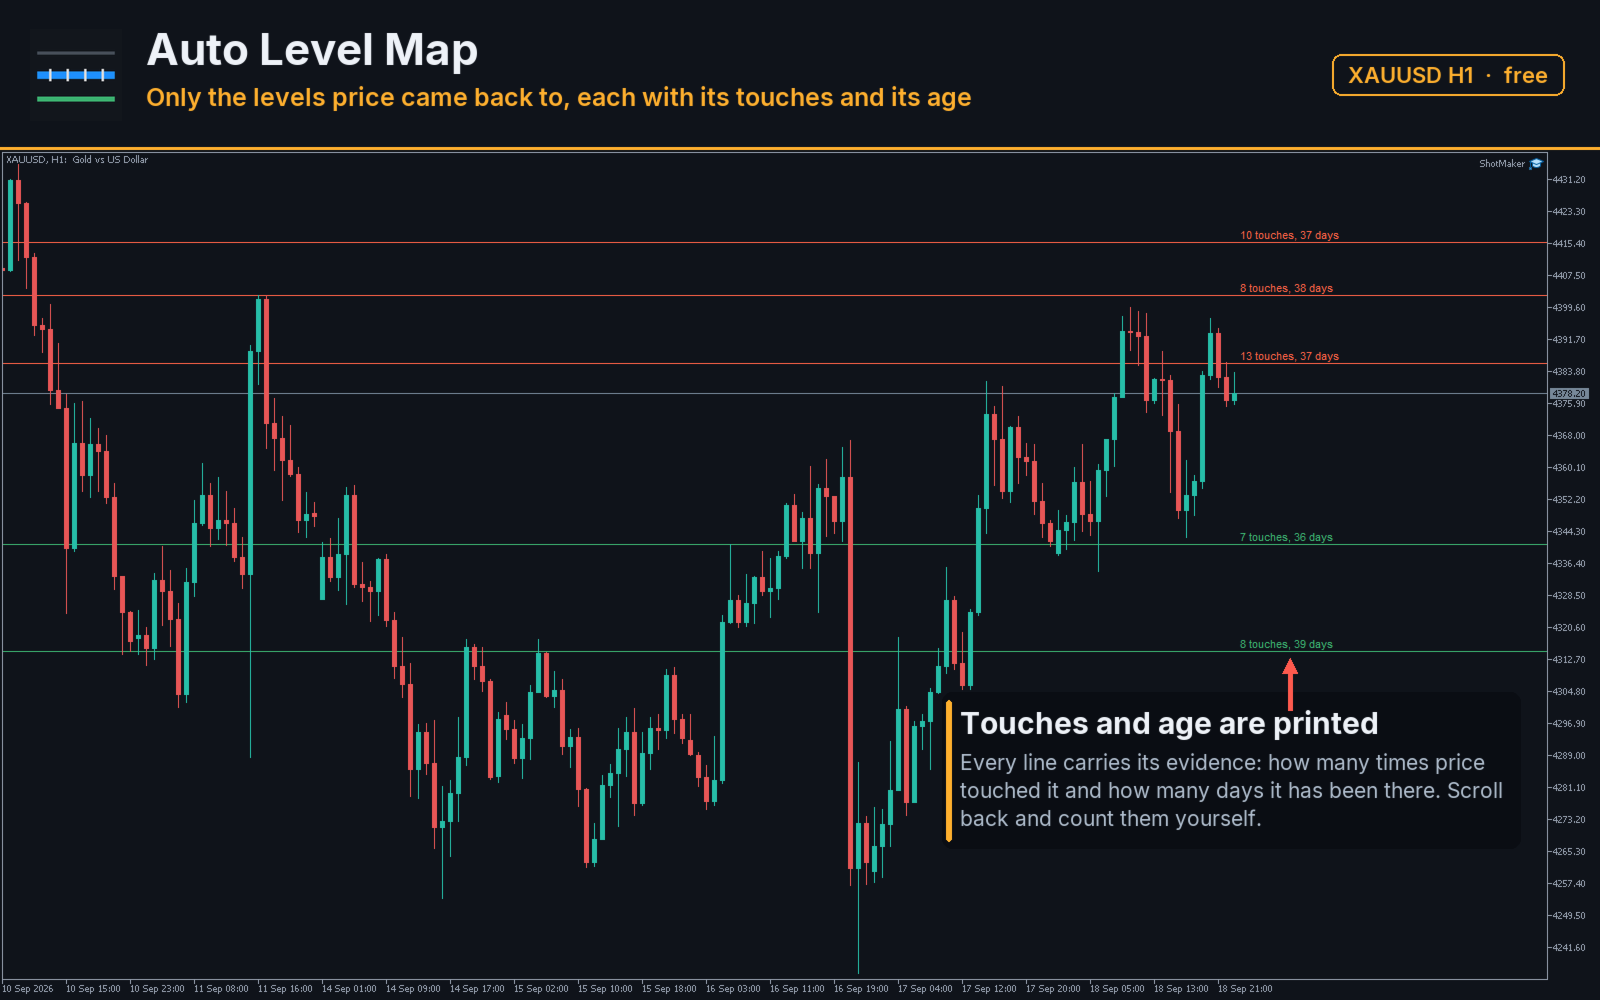
Most level tools mark every swing they can find, and a chart with forty lines answers nothing. This one keeps a level only when price came back to it, and prints the evidence next to the line: the number of touches and the age in days.
Lines above current price and lines below it are drawn in different colours, so the map reads at a glance without counting.
What Puts A Level On The Chart
A swing high is a bar whose high is not lower than its neighbours on both sides, within the number of bars you set; a swing low is its mirror. Swings that land within the merge distance of each other are not separate levels, they are one level touched twice, and the price of that level is the running average of everything merged into it, so a single outlier does not drag it.
A level with fewer touches than your threshold is not drawn at all. That is the whole point: the chart shows the few places price kept returning to, not every place it ever turned.
Touches And Age Are Printed, Not Implied
Next to each line stands the count and the age: "4 touches, 31 days". Both are verifiable on your own chart in a minute. Scroll back, find the swings near that price, count them. If the count on the screen disagrees with what you count by hand, write it in the comments with the symbol and the timeframe.
Choosing The Merge Distance
Two swings a few points apart are the same level on gold and two different levels on a currency pair. The merge distance therefore defaults to a share of ATR rather than to a fixed number of points, and adapts to the instrument by itself. Where you want the old behaviour, switch the mode to Points and set the number you prefer.
Input Parameters
- SwingBars - bars on each side that make a swing
- HistoryBars - how far back swings are looked for
- ToleranceMode - merge distance as a share of ATR, or in fixed points
- ToleranceValue - the share, or the number of points
- AtrPeriod - ATR period used by the share mode
- MinTouches - how many touches a level needs before it is drawn
- MaxLevels - how many levels appear on the chart, taken by touch count
- ShowLabels - print the touch count and age next to each line
- ColorAbove - colour of levels above price
- ColorBelow - colour of levels below price
- ObjectPrefix - prefix for every chart object created
Reading The Figures From An Expert Advisor
Four buffers are published: the nearest level above price, the nearest below, the distance to the closer of the two in points, and the touch count of that level. An expert advisor can ask "how far is the nearest level and how strong is it" without redoing the search. Buffers hold an empty value while no level passes the threshold.
Requirements
Any symbol and any timeframe. Levels are rebuilt once per finished bar, not on every tick: a swing needs finished bars on its right side, so nothing about it can change inside the current bar. The indicator places no orders and writes nothing to disk.
Support
Questions about a parameter, or a level whose count you cannot reproduce by hand: reply in the comments of this page with the symbol, the timeframe and the settings, and I will look into it. A rating helps other traders decide whether a free tool is worth their time, whichever way it goes.