MQ Harmonic Pattern
- Indicators
-
Muhammad Iqbal
 Need a Custom MT5 Indicator or Expert Advisor?
I specialize in developing custom MetaTrader 5 (MT5) Indicators and Expert Advisors (EAs) tailored to your specific trading strategy and requirements.
You can hire me for:
- Custom MT5 Indicators
- Custom Expert Advisors (EAs) - Version: 1.0
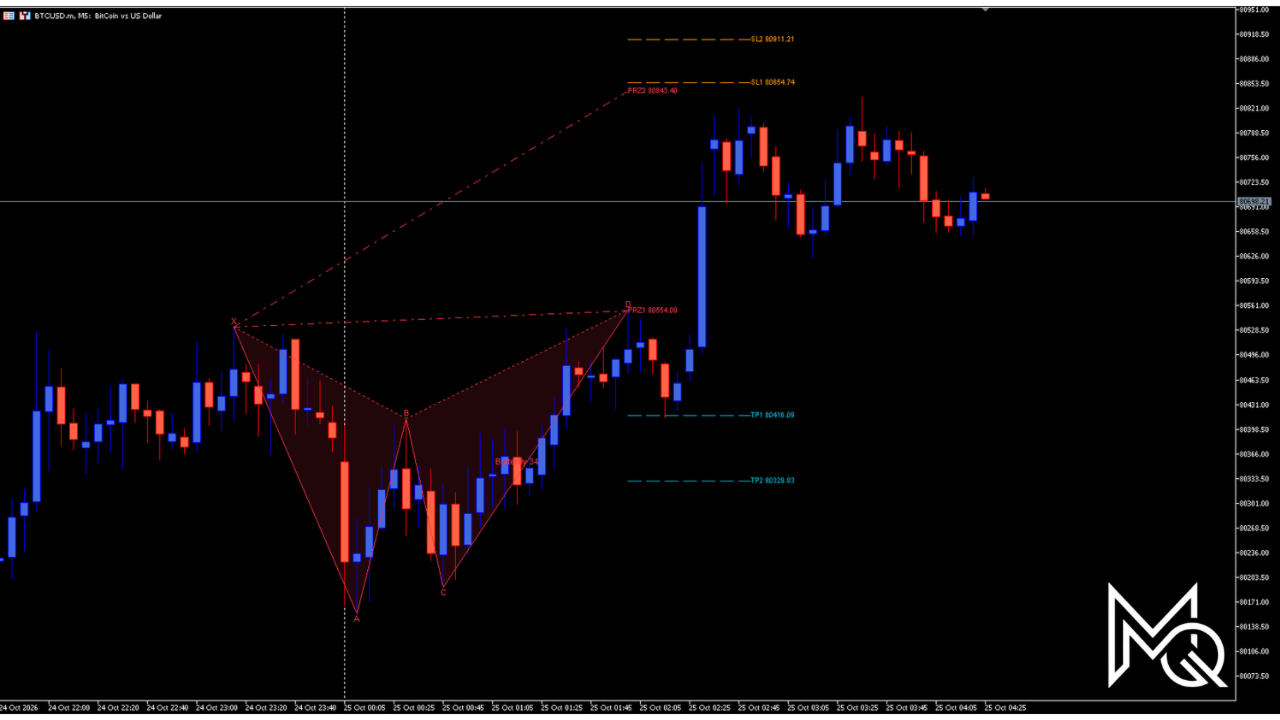
This indicator automatically detects harmonic price patterns on your chart, both bullish and bearish, and shows them as soon as they form, including potential patterns that are still developing. For every pattern it draws the Potential Reversal Zone (PRZ), and for completed patterns it also draws two take-profit and two stop-loss levels.
Supported Patterns:
Gartley, Bat, Butterfly, Crab, Deep Crab, Shark and Cypher. Each pattern can be switched on or off individually.
Key Features:
- Completed and Potential Patterns — Completed patterns (X-A-B-C-D) are drawn with all points labeled. Potential patterns (X-A-B-C) are shown while point D is still forming, so you can prepare before the reversal zone is reached.
- PRZ Lines — Two lines (PRZ1 and PRZ2) start from point X and run to the projected D position, marking the price zone where point D is expected to complete, with the price shown on each line.
- TP and SL Levels — Completed patterns show TP1, TP2, SL1 and SL2 levels based on the pattern type, drawn from point D with price labels. Stop-loss levels are always placed outside the PRZ.
- Pattern Score — Every pattern is scored from 0 to 100 by how closely its Fibonacci ratios match the ideal ones. Use the minimum score filter to show only the cleaner setups.
- One Pattern per Setup — When the same points match several pattern types, only the best-scoring one is shown, so the chart stays clean.
- Clear Labels — The pattern name and score appear below the center of each pattern. Hover over it to see the exact ratios (AB/XA, BC/AB, CD/BC, AD/XA and the PRZ range).
- Optional Triangle Fill — Fill the XAB and BCD triangles for easier visual recognition.
- Alerts — Popup and push notifications for potential patterns, completed patterns, or both. No alerts are sent for patterns that already exist when the indicator is loaded.
- Lightweight — Uses zero indicator buffers. The analysis runs only when a new bar appears, and the number of bars analyzed and patterns drawn is limited to keep the platform responsive.
Inputs:
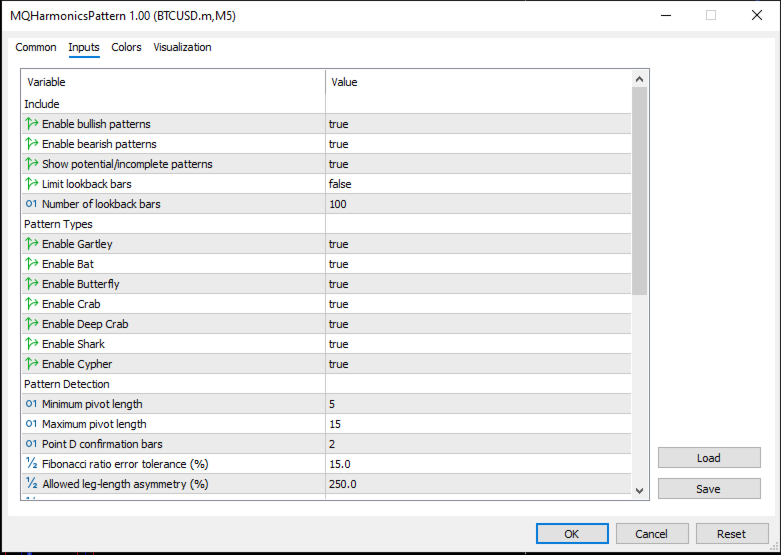
- Include — Enable bullish / bearish patterns, show potential patterns, optional lookback limit.
- Pattern Types — Enable or disable each of the 7 patterns.
- Pattern Detection — Pivot length range, point D confirmation bars, Fibonacci ratio tolerance (%), allowed leg asymmetry, minimum pattern score, maximum bars to analyze, maximum completed patterns and maximum potential patterns to draw.
- Alerts — Enable alerts, alert type (potential / completed / both), push notifications.
- Display — Bullish and bearish colors, PRZ lines, TP lines, SL lines and their colors, triangle fill and fill intensity.
How It Works:
The indicator finds swing highs and lows over a range of pivot lengths and links five consecutive swings into X-A-B-C-D structures. Each structure is checked against the Fibonacci ratio rules of every enabled pattern, within the tolerance you set. Matching patterns are scored, duplicates are removed, and the most recent ones are drawn. For potential patterns, the PRZ is projected from X-A-B-C. For completed patterns, TP and SL levels are calculated from the pattern geometry.
Important Notes:
- Harmonic patterns are subjective by nature, and point D is based on the latest swing, so a developing or recently completed pattern can change or disappear as new bars form. Wait for confirmation (for example a reversal candle or momentum divergence) before acting on a PRZ.
- PRZ, TP and SL levels are reference levels for analysis, not trading signals or guarantees. Use them together with your own analysis and risk management.