Auto Level Map

What Gets Drawn

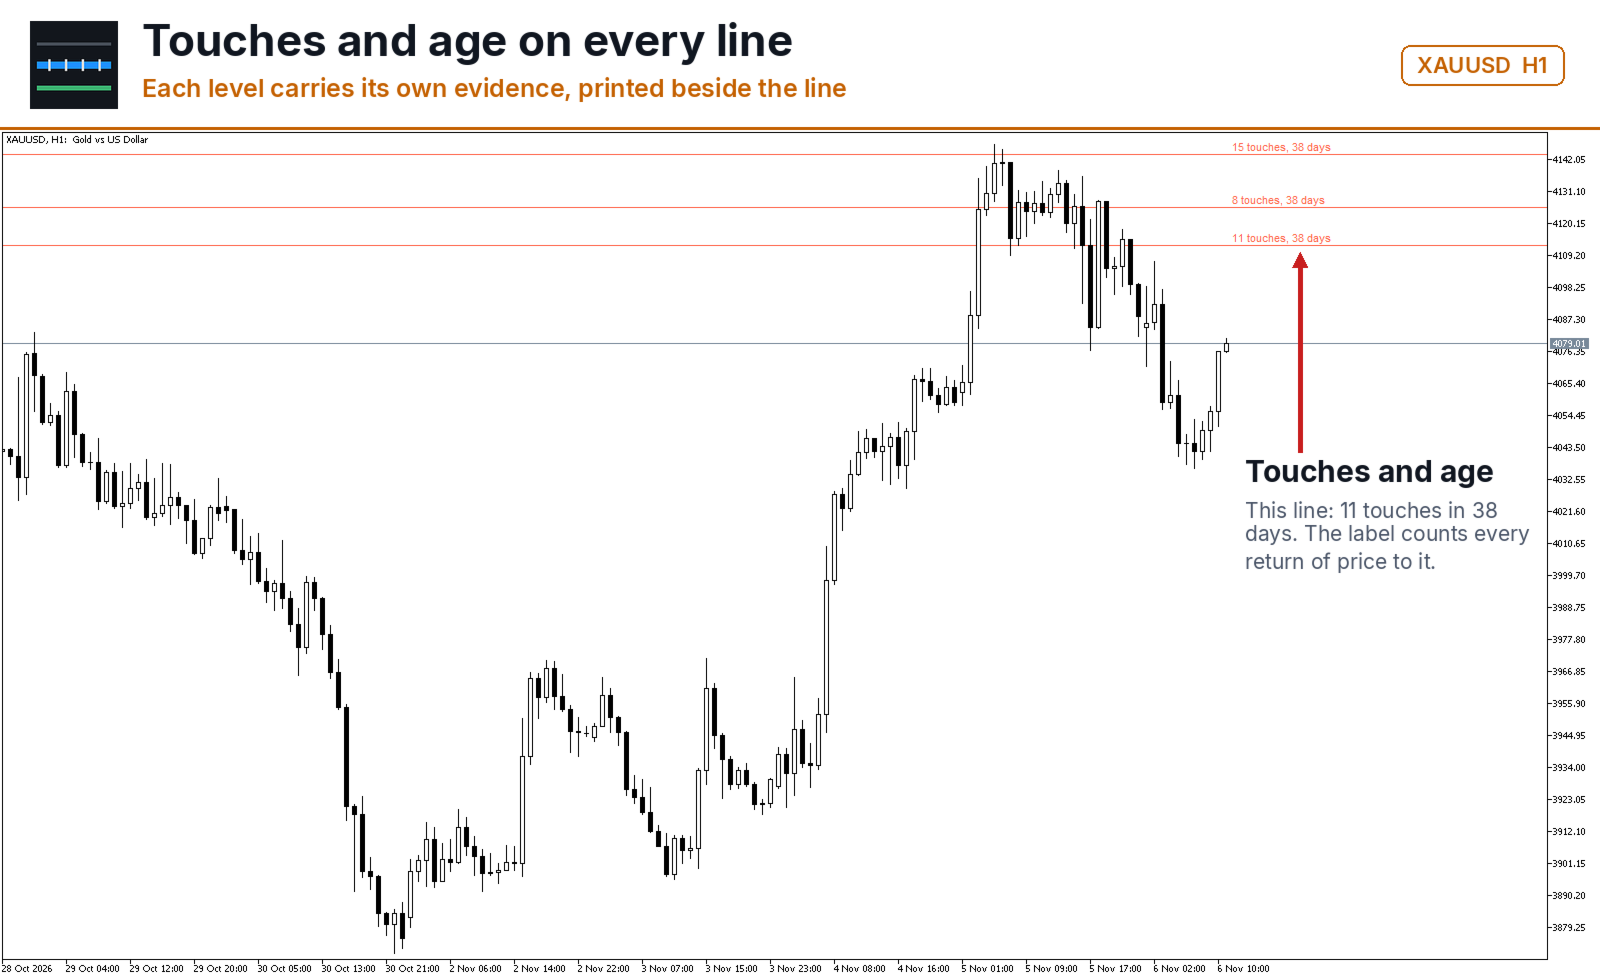
Most level tools mark every swing they can find, and a chart with forty lines answers nothing. This one keeps a level only when price came back to it, and prints the evidence next to the line: the number of touches and the age in days.

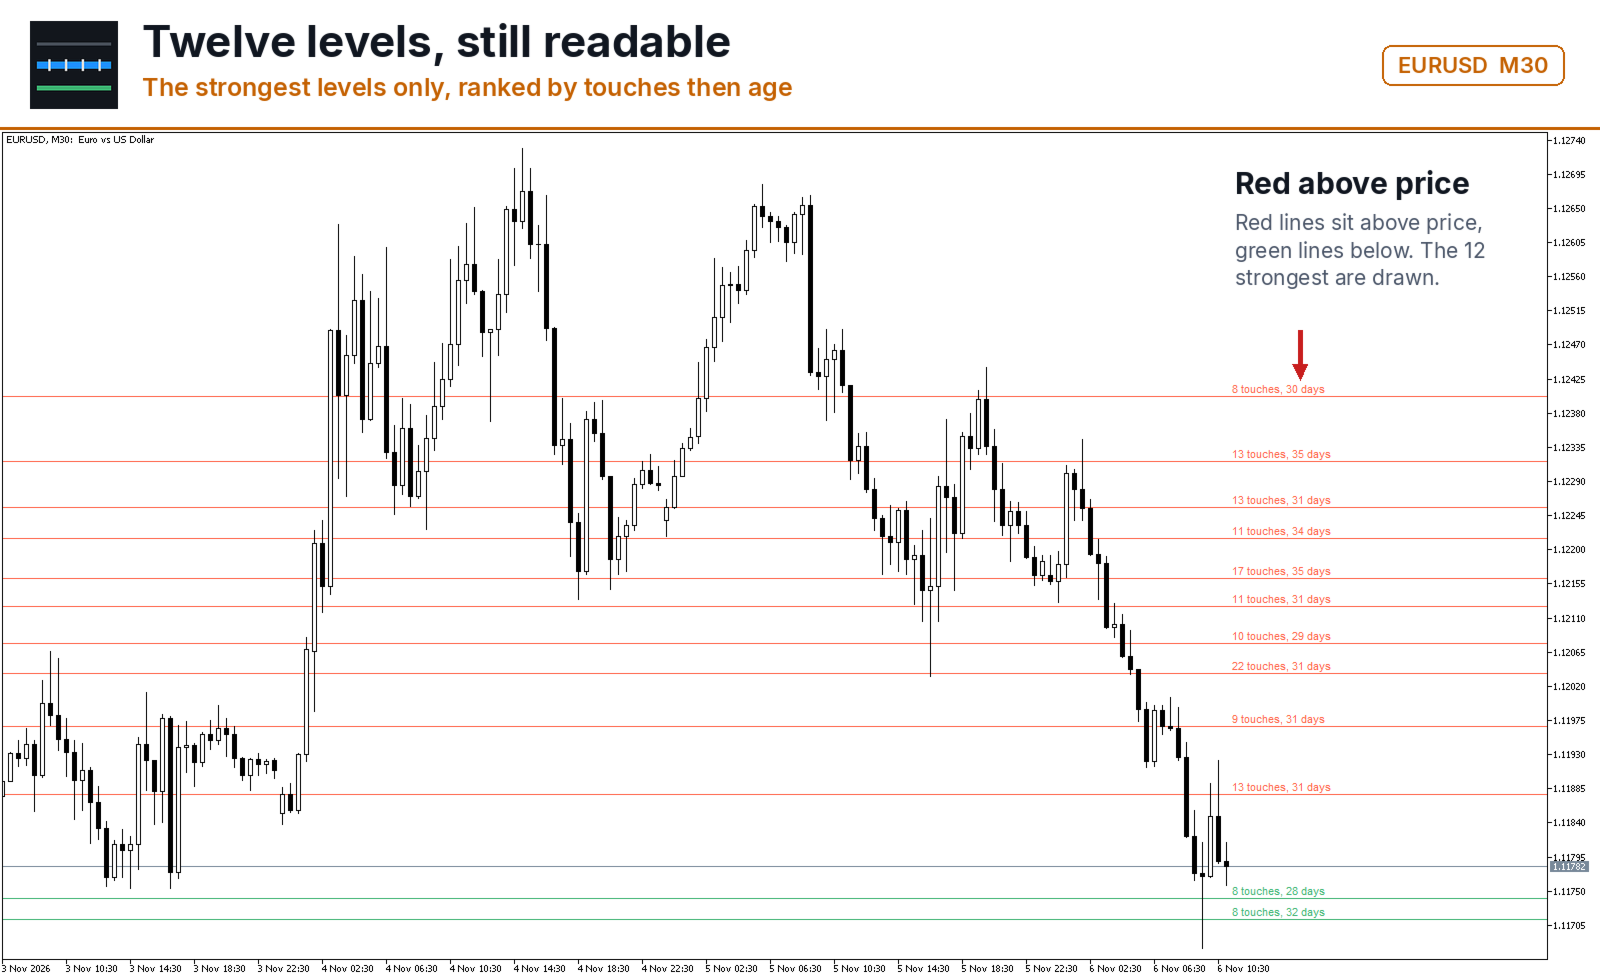
Lines above current price and lines below it are drawn in different colours, so the map reads at a glance without counting.

What Puts A Level On The Chart

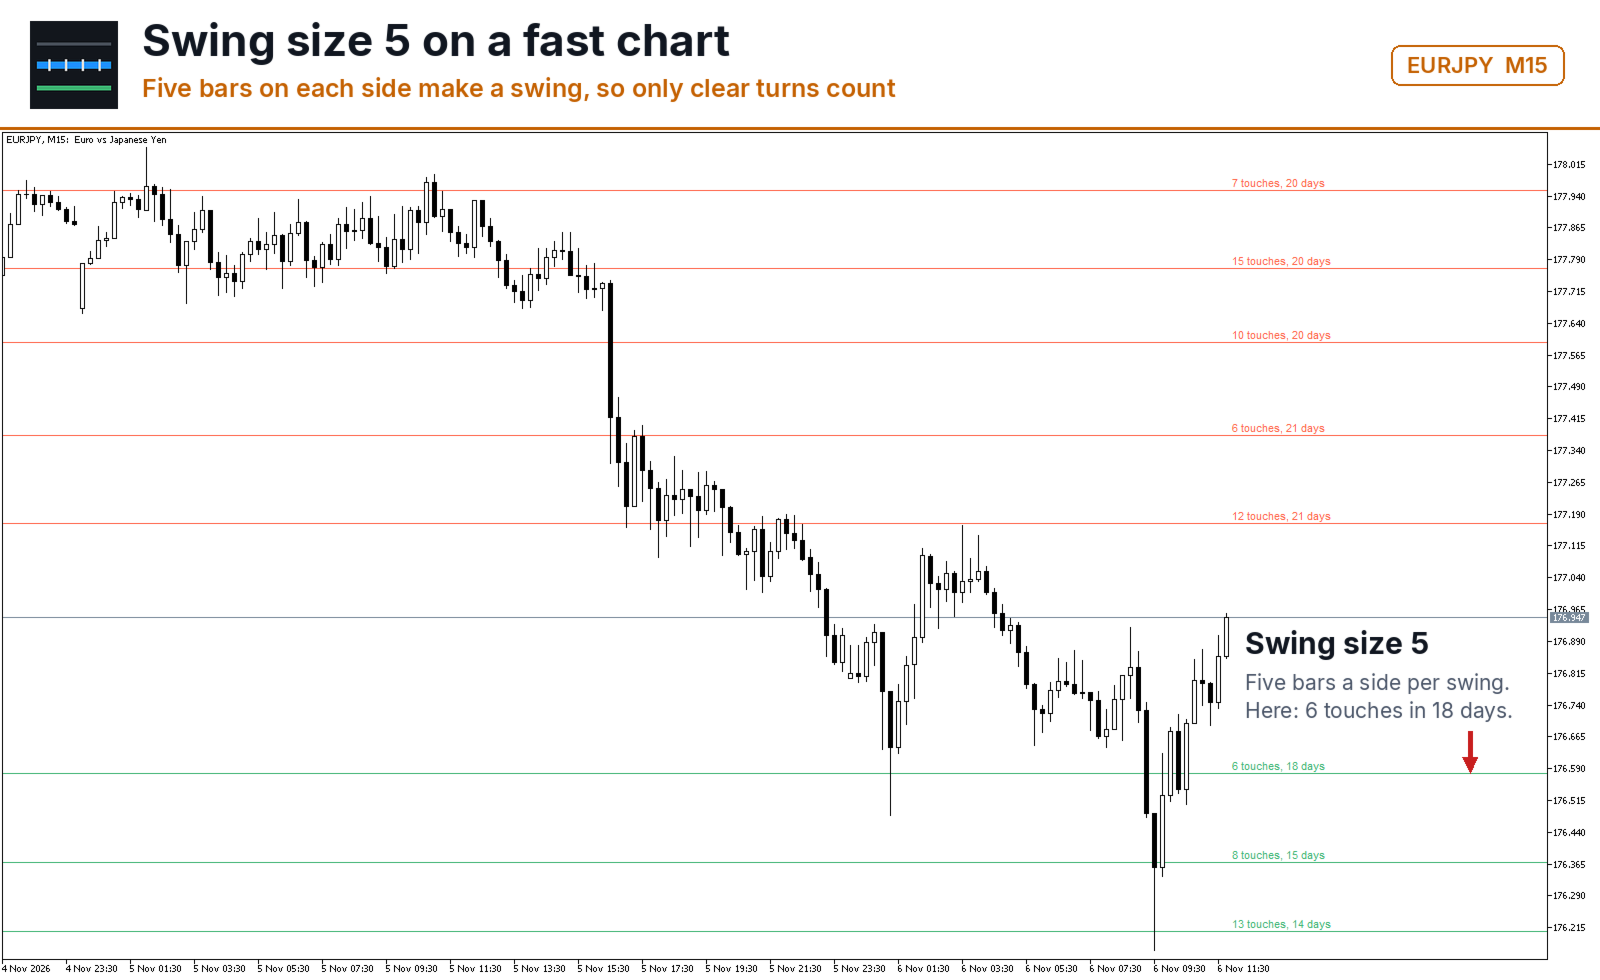
A swing high is a bar whose high is not lower than its neighbours on both sides, within the number of bars you set; a swing low is its mirror. Swings that land within the merge distance of each other are not separate levels, they are one level touched twice, and the price of that level is the running average of everything merged into it, so a single outlier does not drag it.

A level with fewer touches than your threshold is not drawn at all. That is the whole point: the chart shows the few places price kept returning to, not every place it ever turned.

Touches And Age Are Printed, Not Implied

Next to each line stands the count and the age: "4 touches, 31 days". Both are verifiable on your own chart in a minute. Scroll back, find the swings near that price, count them. If the count on the screen disagrees with what you count by hand, write it in the comments with the symbol and the timeframe.

Choosing The Merge Distance

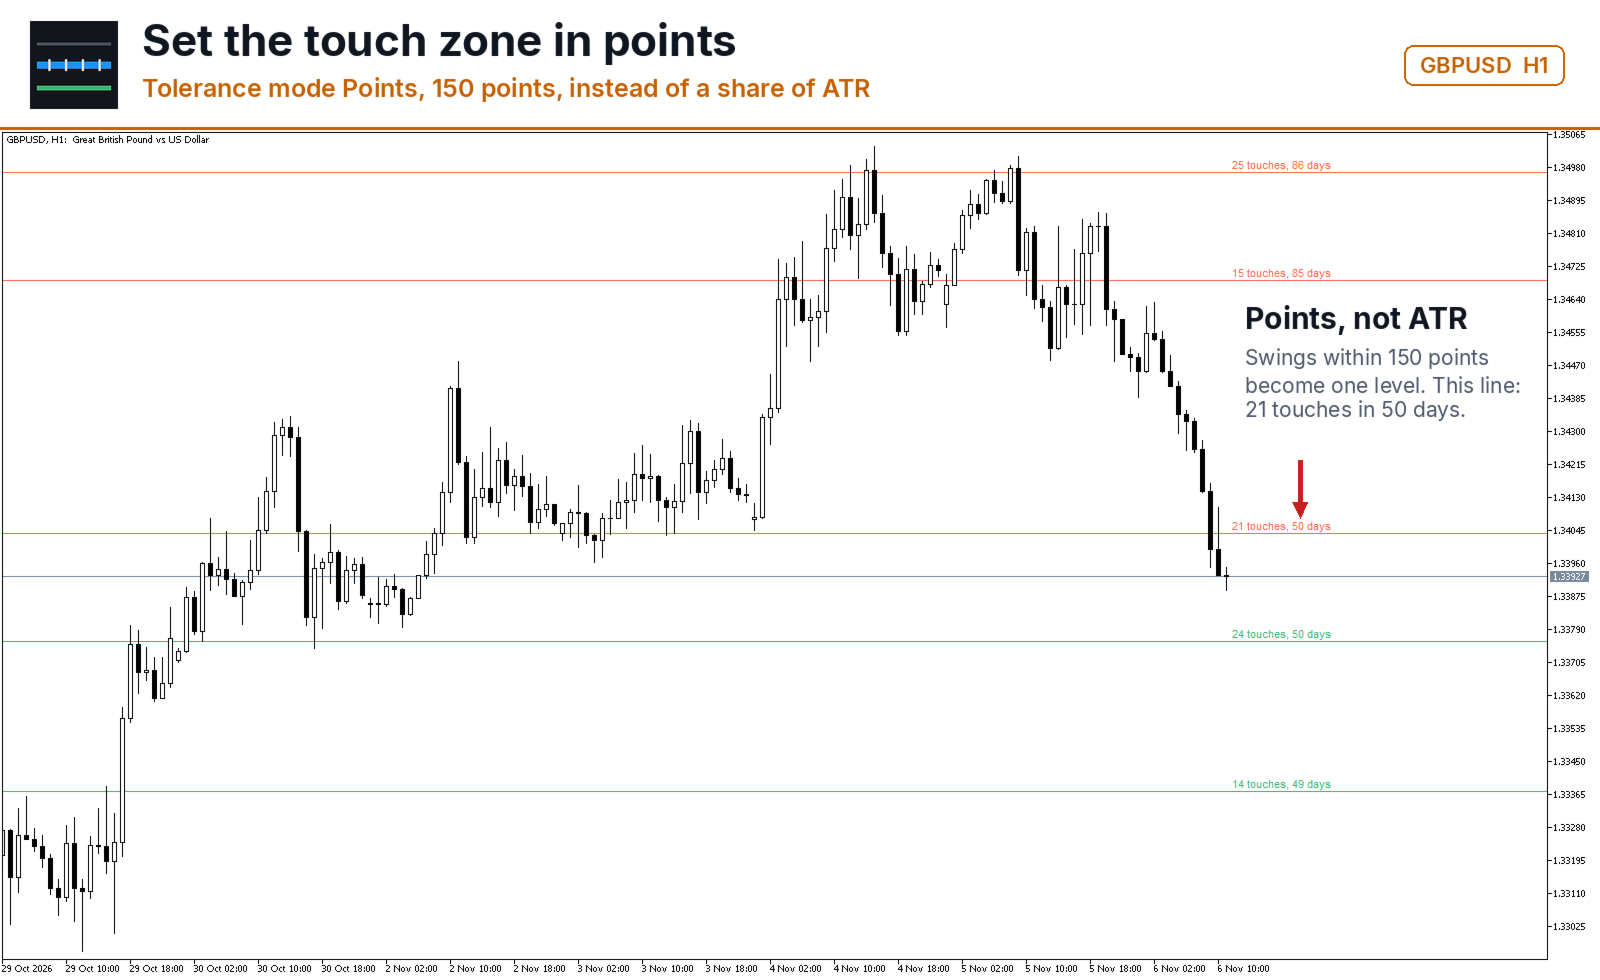
Two swings a few points apart are the same level on gold and two different levels on a currency pair. The merge distance therefore defaults to a share of ATR rather than to a fixed number of points, and adapts to the instrument by itself. Where you want the old behaviour, switch the mode to Points and set the number you prefer.

Input Parameters

  • SwingBars - bars on each side that make a swing
  • HistoryBars - how far back swings are looked for
  • ToleranceMode - merge distance as a share of ATR, or in fixed points
  • ToleranceValue - the share, or the number of points
  • AtrPeriod - ATR period used by the share mode
  • MinTouches - how many touches a level needs before it is drawn
  • MaxLevels - how many levels appear on the chart, taken by touch count
  • ShowLabels - print the touch count and age next to each line
  • ColorAbove - colour of levels above price
  • ColorBelow - colour of levels below price
  • ObjectPrefix - prefix for every chart object created

Reading The Figures From An Expert Advisor

Four buffers are published: the nearest level above price, the nearest below, the distance to the closer of the two in points, and the touch count of that level. An expert advisor can ask "how far is the nearest level and how strong is it" without redoing the search. Buffers hold an empty value while no level passes the threshold.

Requirements

Any symbol and any timeframe. Levels are rebuilt once per finished bar, not on every tick: a swing needs finished bars on its right side, so nothing about it can change inside the current bar. The indicator places no orders and writes nothing to disk.

Support

Questions about a parameter, or a level whose count you cannot reproduce by hand: reply in the comments of this page with the symbol, the timeframe and the settings, and I will look into it. A rating helps other traders decide whether a free tool is worth their time, whichever way it goes.
Produtos recomendados
ZigZag Support and Resistance Levels
Tshidiso Ephraim Mpakanyane
3.5 (2)
ZigZag Support and Resistance Levels  é um indicador que identifica níveis de suporte e resistência utilizando pontos de reversão do ZigZag em múltiplos períodos gráficos. Combina os níveis dos períodos selecionados num único gráfico, ajudando os traders a identificar potenciais zonas de confluência e níveis de preços importantes. O indicador agrupa níveis próximos em zonas de suporte e resistência baseadas no ATR, distingue níveis ativos de níveis rompidos e disponibiliza um painel de controlo
FREE
Important Lines
Terence Gronowski
4.88 (24)
This indicator displays Pivot-Lines, preday high and low, preday close and the minimum and maximum of the previous hour. You just have to put this single indicator to the chart to have all these important lines, no need to setup many single indicators. Why certain lines are important Preday high and low : These are watched by traders who trade in a daily chart. Very often, if price climbs over or falls under a preday low/high there is an acceleration in buying/selling. It is a breakout out of a
FREE
Support and Ressistance
Raphael Lorenz Baumgartner
Suporte e Resistência do Último Dia Plataforma: MetaTrader 5 Tipo: Indicador personalizado Exibição: Janela do gráfico (sobreposição) Funções: Calcula zonas de suporte e resistência com base nos máximos e mínimos do dia anterior. Usa uma janela deslizante ( SampleWindowSize ) para detectar faixas de preço recentes. Detecta suporte quando a faixa de preços atual está abaixo dos extremos anteriores. Detecta resistência quando a faixa de preços está acima. Mostra quatro buffers: LDResistanceHigh –
FREE
This indicator automatically detects harmonic price patterns on your chart, both bullish and bearish, and shows them as soon as they form, including potential patterns that are still developing. For every pattern it draws the Potential Reversal Zone (PRZ), and for completed patterns it also draws two take-profit and two stop-loss levels. Supported Patterns: Gartley, Bat, Butterfly, Crab, Deep Crab, Shark and Cypher. Each pattern can be switched on or off individually. Key Features: Completed
FREE
Renko Velocity Heatmap is a separate-window indicator that converts standard time-based price series into Renko-style blocks and colors them by momentum speed. Each block represents a fixed Renko box size, while the color intensity reflects how fast the block was formed relative to recent average formation time. Slow movement appears dim/neutral, fast movement becomes more saturated, enabling quick visual assessment of acceleration and deceleration in trend moves. The indicator is designed for t
FREE
Donchian Breakout And Rsi
Mattia Impicciatore
4.33 (3)
Descrição geral Este indicador é uma versão aprimorada do Canal Donchian clássico, enriquecida com funções práticas para o trading real. Além das três linhas padrão (máxima, mínima e linha do meio), o sistema detecta breakouts e os mostra visualmente com setas no gráfico, exibindo apenas a linha oposta à direção da tendência atual para uma leitura mais limpa. O indicador inclui: Sinais visuais : setas coloridas nos breakouts Notificações automáticas : alerta pop-up, push e e-mail Filtro RSI : pa
FREE
RSI abcd
Francisco Gomes Da Silva
3.75 (4)
RSI ABCD Pattern Finder: Estratégia Técnica 1. Como o Indicador Funciona Combina o RSI clássico com detecção automática de padrões harmônicos ABCD . Componentes Principais RSI Padrão (período ajustável) Marcações de Topos e Fundos (setas) Padrões ABCD (linhas verdes/vermelhas) Filtros de Overbought (70) e Oversold (30) 2. Configuração no MT5 period = 14 ; // Período do RSI size = 4 ; // Tamanho máximo do padrão OverBought = 70 ; // Nível de sobrecompra OverSold = 30 ; // Nível de sobrevenda Filt
FREE
PZ Pivot Points MT5
PZ TRADING SLU
4.91 (22)
This indicator displays pivot points in the chart, including historical vales, and supports many calculation modes for Pivot Points and S/R levels. [ Installation Guide | Update Guide | Troubleshooting | FAQ | All Products  |  Get Help ] It plots historical levels for backtesting purposes It allows you to select the reference timeframe It implements different Pivot Point calculation modes It implements different SR calculation modes It implements customizable colors and sizes Calculation Mod
FREE
AUTO Zones Order Blocks
Paballo Justice Tsoako
OrderBlockZones.mq5 is an MT5 chart indicator that automatically detects and draws Order Block support/resistance zones as colored rectangles. What it identifies: - Support (bullish OB): the last down candle before a strong upward impulse move. - Resistance (bearish OB): the last up candle before a strong downward impulse move. The zone spans that origin candle's full high-to-low range. How it filters zones: - Unbroken only — a zone is discarded once a later bar closes beyond it (below a
FREE
Blame The Box
Karim Abdelwahab
Blame The Box is a lightweight session range and breakout analysis indicator engineered specifically for MetaTrader 5. Built to support and enhance your personal trading strategy, it automatically identifies custom intraday consolidation ranges, maps out dynamic breakout levels, and displays real-time position sizing directly on your chart. Important Note: Blame The Box is an analytical and risk-calculation tool designed to assist your own technical analysis and discretionary trading strategy.
FREE
Support and Resistance Levels with Breaks is a MetaTrader 5 indicator designed to detect important support and resistance levels based on pivot points and identify price breaks with volume confirmation. The indicator analyzes price movements around key market levels and highlights breakouts only when the volume condition is satisfied. This helps traders distinguish stronger price movements from low-volume level breaks. There are even better indicators—get them here. https://www.mql5.com/en/users
FREE
CandlePro X
Murtadha Majid Jeyad Al-Khuzaie
CandlePro X — Free Professional Candle Visualizer for MetaTrader 5 CandlePro X is a free chart visualization indicator for MetaTrader 5, designed to make candlestick charts cleaner, sharper, and easier to read. If you find it difficult to quickly distinguish bullish and bearish candles, especially on busy charts, CandlePro X helps solve this problem by giving your candles stronger colors, clearer contrast, and a more professional appearance. CandlePro X does not generate trading signals, pred
FREE
WH Price Wave Pattern MT5
Wissam Hussein
4.15 (13)
Bem-vindo ao nosso   Padrão de onda de preços   MT5 --(Padrão ABCD)-- O padrão ABCD é um padrão de negociação poderoso e amplamente utilizado no mundo da análise técnica. É um padrão de preço harmônico que os traders usam para identificar oportunidades potenciais de compra e venda no mercado. Com o padrão ABCD, os traders podem antecipar possíveis movimentos de preços e tomar decisões informadas sobre quando entrar e sair das negociações. Versão EA:   Price Wave EA MT5 Versão MT4:   Price Wav
FREE
Ghost Horizon MA
Nicola Biacca Notari
Description in English Ghost Horizon is a professional trend-following indicator for MetaTrader 5, engineered to instantly identify trend reversals and optimal market entry points using an advanced crossover system. The algorithm analyzes price dynamics by combining a Fast Moving Average (tracking short-term momentum) and a Slow Moving Average (defining medium-term market structure). The software completely eliminates market noise, delivering clean, non-lagging visual signals directly onto
FREE
Multi-timeframe trend indicator based on the ADX / ADXWilder indicator with Fibonacci levels The indicator shows trend areas using ADX or ADXWilder indicator data from multiple timeframes. The impulse mode of the indicator allows you to catch the beginning of a trend, and several "Screens" with different timeframes allow you to filter out market noise. Fibonacci levels are added to the price chart, which have flexible settings. How the indicator works: if PDI is greater than NDI, then   it`s
FREE
Indicator and Expert Adviser  EA Available in the comments section of this product. Download with Indicator must have indicator installed for EA to work. Mt5 indicator alerts for bollinger band and envelope extremes occurring at the same time. Buy signal alerts occur when A bullish candle has formed below both the lower bollinger band and the lower envelope  Bar must open and close below both these indicators. Sell signal occur when A bear bar is formed above the upper bollinger band and upper
FREE
Cybertrade Keltner Channels
Emanuel Andriato
4.67 (6)
Cybertrade Keltner Channels - MT5 Criado por Chester Keltner, esse é um indicador de volatilidade utilizado pela análise técnica. É possível seguir a tendência dos preços de ativos financeiros e gerar padrões de suporte e resistência. Além disso, os envelopes são uma forma de acompanhar a volatilidade, a fim de identificar oportunidades de compra e venda desses ativos. Funciona em períodos maiores do que o período visível no gráfico. Todos os valores estão disponíveis em forma de buffers para
FREE
O indicador identifica quando ocorre uma divergência entre o preço e um indicador ou oscilador. Ele identifica divergências regulares e ocultas. Combinado com suas próprias regras e técnicas, este indicador permitirá que você crie (ou aprimore) seu próprio sistema poderoso. Recursos Pode detectar divergências para os seguintes osciladores / indicadores:       MACD, OsMA, Stochastics, RSI, CCI, RVI, Awesome, ADX, ATR, OBV, Índice composto, MFI e Momentum. Apenas um oscilador / indicador pode ser
FREE
RelicusRoad Fractals é um indicador de fractais para MetaTrader 4 e MetaTrader 5 que marca máximos e mínimos de oscilação em duas forças, um teste Fast de 7 velas de cada lado e um teste Slow de 15 velas de cada lado. Uma janela de 7 velas de cada lado já filtra muitas pequenas oscilações, e o teste Slow pede mais do que o dobro disso, por isso as suas setas mais grossas identificam as oscilações que se mantiveram ao longo de um trecho muito mais largo do gráfico. As duas forças são mostradas em
FREE
O Trade Behavior Mirror lê apenas o histórico de operações já encerradas da sua própria conta e conta um único padrão: abrir uma nova posição pouco depois de uma perda realizada, com um lote maior do que o seu volume habitual. A ferramenta não prevê nada e não dá nenhum conselho. Cada número no painel é algo que já aconteceu nesta conta. Como os números são construídos: ela lê até 31 dias de negociações encerradas em todos os símbolos e todos os números mágicos - é uma visão de toda a conta, nã
FREE
Apex Point
Marco Engstermann
Apex Point is a trend-following indicator for MetaTrader 5, transforming complex market data into signals for traders. It displays blue dots for uptrends, red dots for downtrends, and yellow crosses at potential reversals, helping users identify momentum shifts quickly. Key features include a confirmation system requiring multiple bars (default: 3) to validate changes, reducing false signals; dynamic ATR-based offsets for adaptive trailing, with instant ratcheting in the trend direction and smo
FREE
Risk5Percent is a custom indicator for MetaTrader 5 designed to help you manage your risk exposure precisely. By entering the desired risk percentage and the number of lots used, it calculates and displays the corresponding price level on the chart that represents your maximum anticipated loss (e.g., 5%), automatically considering contract and tick size for the selected instrument. Key Features: Custom settings for trade direction (long/short), risk percentage, and lot size. Automatic adjus
FREE
MACD Enhanced
Nikita Berdnikov
4 (4)
Introducing the MACD  Enhanced – an advanced MACD (Moving Average Convergence Divergence) indicator that provides traders with extended capabilities for trend and momentum analysis in financial markets. The indicator uses the difference between the fast and slow exponential moving averages to determine momentum, direction, and strength of the trend, creating clear visual signals for potential entry and exit points. Attention! To achieve the best results, it is recommended to adapt the indicator
FREE
Smart SR Levels Support and Resistance - Professional Strength-Based Support & Resistance Indicator MT5 Key Features: • Automatic detection of significant Support and Resistance levels • Line thickness based on level strength (number of touches + volume factor) • Custom colours for Support and Resistance • Multi-timeframe support • Clean background lines (no overlap with candles) • Labels showing S/R type and strength value Perfect for price action traders, supply-demand zones, and institutio
FREE
Dynamic Supply and Demand indicator automatically identifies and displays Supply and Demand Zones on your chart based on price action patterns and market structure.  These zones represent areas where institutional buying or selling pressure has historically occurred, making them key levels for potential price reactions. This form of indicator takes inspiration from ICT as well as traditional Support & Resistance formation. **For the first 50 candles (number depends on LookBackCandles) when indic
FREE
Bounce Zone MT5
Nguyen Thanh Cong
4.6 (10)
Introduction The Bounce Zone indicator is a cutting-edge non-repainting technical tool built to identify key areas on the price chart where market sentiment is likely to cause a significant price reversal. Using advanced algorithms and historical price data analysis, this indicator pinpoints potential bounce zones. Combined with other entry signal, this indicator can help forex traders place the best trades possible Signal A possible buy signal is generated when price is in the green zone an
FREE
Automatic fibonacci with alerts is an indicator that automatically plots a fibonacci retracement based on the number of bars you select on the BarsToScan setting in the indicator. The fibonacci is automatically updated in real time as new highest and lowest values appear amongst the selected bars. You can select which level values to be displayed in the indicator settings. You can also select the color of the levels thus enabling the trader to be able to attach the indicator several times with d
FREE
Basic Candlestick Patterns MT5
Mehran Sepah Mansoor
4.77 (31)
O nosso indicador de   padrões básicos de velas   torna a identificação dos principais padrões de velas mais fácil do que nunca. Descubra padrões como o Martelo, a Estrela da Noite, os Três Soldados Brancos e muitos outros com apenas um olhar para o seu gráfico. Com uma interface intuitiva e pistas visuais claras, o nosso indicador ajuda-o a identificar oportunidades de negociação de forma rápida e precisa /   Versão MT4 Dashboard Scanner para este indicador: ( Basic Candlestick Patterns Dashb
FREE
Super Trend Strategy
Minh Khoa Nguyen
4.5 (4)
The SuperTrend Strategy is a widely-used technical indicator based on the Average True Range (ATR), primarily employed as a trailing stop tool to identify prevailing market trends. The indicator is designed for ease of use while providing reliable insights into the current market trend. It operates based on two key parameters: the period and the multiplier . By default, it uses a period of 15  for the ATR calculation and a multiplier of 3 . The Average True Range (ATR) plays a crucial role in th
FREE
FVG with Alerts
Mohammed Lamine Kasmi
1 (1)
FVG Indicator with Alerts Description: This is a simple and effective indicator for identifying and displaying Fair Value Gaps (FVGs) on any timeframe. The indicator helps you see important price imbalances and provides powerful interactive tools for your analysis. Key Features: Detects FVGs: Clearly identifies and draws boxes around Bullish and Bearish Fair Value Gaps. Midline Level: Displays the 50% equilibrium level inside each FVG box, a critical point of interest. Complete Alert System: Rec
FREE
Os compradores deste produto também adquirem
Trend Sniper X
Sarvarbek Abduvoxobov
4.86 (43)
Trend Sniper X é um indicador de acompanhamento de tendência para múltiplos tempos gráficos no MetaTrader 5 que ajuda os traders a identificar a direção da tendência e potenciais pontos de reversão com clareza e precisão. para MT4: https://www.mql5.com/en/market/product/193245 Informações sobre o preço: O preço atual é promocional e está sujeito a alterações à medida que novas atualizações e funcionalidades forem lançadas. Oferta Bônus: Para obter o Auto-Trade Assistant EA GRATUITO para este in
Smart Trend Trading System — MetaTrader 5 Após a compra, envie-me uma mensagem no MQL5 para receber Smart Universal Expert Advisor GRÁTIS, além do curso online, do manual em PDF e do acesso ao grupo privado. O STTS reúne a direção da tendência, sinais de entrada e saída, zonas de reversão e níveis de preço importantes diretamente no seu gráfico. Siga o sistema manualmente ou conecte um EA compatível separado para executar operações automaticamente com as configurações que você escolher. UM SISTE
Um novo Rei chegou à cidade - Indicador + Gestão de Ordens (TP1 + TP2 + TP3) + Enviador opcional de sinais para Telegram INCLUÍDO (GRÁTIS) (SISTEMA COMPLETO DE TRADING e SINAIS) Nosso melhor EA para Ouro: Gold Slayer Este indicador inclui uma estratégia avançada, um sistema de trading com gestão de ordens personalizável e um sistema de reversão à média que combina extensões de envelopes, apoiado por múltiplos filtros inteligentes de confirmação, como o RSI, para capturar entradas de reversão de
Zoryk Gold
Reda El Koutbane
4.78 (18)
O desconto termina em 24 horas — próximo preço $ 69 ZORYK — Sistema avançado de sinais para XAUUSD no MetaTrader 5 Você conhece essa sensação. Você passa muito tempo analisando o ouro. Espera pela entrada certa. Finalmente abre a operação e o preço começa imediatamente a se mover contra você. Você fecha cedo demais, move o Stop Loss ou hesita por alguns segundos. Depois disso, o mercado alcança exatamente o destino que você esperava originalmente, mas sem você dentro da operação. O problema ne
SuperScalp Pro
Van Minh Nguyen
4.54 (37)
SuperScalp Pro - Professional Multi-Layer Confluence Scalping System O SuperScalp Pro é um indicador avançado de scalping que aprimora o Supertrend clássico com vários filtros inteligentes de confirmação. Ele ajuda a identificar oportunidades de Buy/Sell com maior probabilidade de sucesso, reduzindo significativamente os sinais falsos. Setas claras de Buy e Sell aparecem diretamente no gráfico, juntamente com os níveis de Stop Loss e Take Profit baseados em ATR, calculados automaticamente em tem
Tenha sua vantagem no trading à vista! M5 Sniper é um novo indicador da MeanFX. Ele combina sinais de trading precisos com níveis adaptativos de TP/SL — criando, como resultado, as melhores operações estatísticas possíveis! O preço aumenta a cada 5 compras, o próximo preço é de 69$ Envie-me uma mensagem após a compra para receber dicas/guia e um EA bônus O que o faz se destacar? Desempenho estatístico comprovado no Gold XAUUSD ( funciona em praticamente todos os ativos , com foco em dominar um ú
Em 2019, mostrei ao mundo inteiro do que este indicador é capaz. Operei os sinais dele manualmente, em uma conta real, às claras — a conta era monitorada no Myfxbook, e eu relatava o meu experimento em detalhes no Facebook. Resultado: 10.000 dólares se transformaram em 941.411 em quatro meses. O risco foi deliberadamente extremo — o drawdown chegou a 54%, afinal, na nossa profissão, lucro e risco sempre andam de mãos dadas. A captura de tela do Myfxbook é a primeira imagem da galeria. Parece que
Gold Trend Coach MT5
Cristhian Alexander Gaibor Cuasquer
4.5 (8)
Gold Trend Coach é um indicador de tendência para o ouro (XAUUSD) no MetaTrader 5 com sinais de compra e venda, stop loss e três take profit confirmados no fechamento da vela (não repinta), um coach que te guia da entrada até o TP3, um painel multi-timeframe e alertas no celular e no Telegram. Feito para scalping em M1 e M5 e intraday em M15 nas sessões de Londres e Nova York. BÔNUS: EA de auto-trading GRÁTIS para o Gold Trend Coach. Me envie uma mensagem depois da compra e eu envio o EA que ope
SMC Intraday Formula
VividMind Digital Solutions
5 (26)
Vamos ser honestos primeiro. Nenhum indicador sozinho vai te tornar lucrativo. Se alguém te disser o contrário, está te vendendo um sonho. Qualquer indicador que mostre setas perfeitas de compra/venda pode ser feito para parecer impecável — basta dar zoom na parte certa da história e tirar um print das operações vencedoras. Nós não fazemos isso.  SMC Intraday Formula é uma ferramenta. Ela lê a estrutura do mercado para você, identifica as zonas de maior probabilidade de preço e mostra exatament
GoldenX Entry MT5
VividMind Digital Solutions
5 (17)
GoldenX Entry é um indicador para MT5 com um algoritmo adaptativo Smart Entry Trend, um sistema de pontuação de sinais, um detector de regime de mercado e um filtro de volatilidade. Cada sinal inclui um nível de entrada calculado, três níveis de Take-Profit (TP1, TP2, TP3) e um nível de Stop-Loss. Ele é construído sobre múltiplas camadas analíticas projetadas para se adaptar a diferentes condições de mercado, combinando um sistema analítico multicamadas com um otimizador integrado e um sistema d
M1 Sniper MT5
Oleg Rodin
5 (7)
O   M1 SNIPER   é um sistema indicador de negociação fácil de usar. É um indicador de seta projetado para o período M1. O indicador pode ser usado como um sistema independente para scalping no período M1 e pode ser usado como parte do seu sistema de negociação existente. Embora este sistema de negociação tenha sido projetado especificamente para negociação no M1, ele também pode ser usado em outros períodos. Originalmente, desenvolvi este método para negociar XAUUSD e BTCUSD. Mas considero-o úti
Gann Made Easy   é um sistema de negociação Forex profissional e fácil de usar, baseado nos melhores princípios de negociação usando a teoria do sr. W. D. Gann. O indicador fornece sinais precisos de COMPRA e VENDA, incluindo níveis de Stop Loss e Take Profit. Você pode negociar mesmo em movimento usando notificações PUSH. Entre em contato comigo após a compra para receber instruções de negociação e ótimos indicadores extras gratuitamente! Provavelmente você já ouviu muitas vezes sobre os método
Ultra Indicator
Ihor Otkydach
5 (1)
O ULTRA é um indicador técnico que funciona numa base «tudo-em-um» — analisa o mercado de forma independente, gera sinais de negociação, apresenta níveis para definir ordens de stop-loss e sugere quando encerrar as negociações para garantir lucros ou minimizar perdas. Por outras palavras, não importa se não sabe analisar o mercado, determinar níveis — onde definir o seu stop-loss — ou se tem dificuldades com a gestão do capital. O ULTRA fará tudo isso por si! BÓNUS PARA O COMPRADOR: Após adquiri
Próxima Atualização — Versão 2.52 em Breve! [NOVO] Prepare-se para 4 Grandes Novos Recursos Projetados para Aprimorar sua Análise de Mercado e seu Fluxo de Trabalho de Trading Estamos levando a análise de mercado a um novo nível com 4 novos recursos desenvolvidos para atender às suas necessidades de trading. Apresentamos: 1. TRADE OVERVIEW DASHBOARD 2. CONFLUENCE AT ZONE 3. STRONG & WEAK HIGH/LOW 4. OTE 1. TRADE OVERVIEW DASHBOARD Um painel que ajuda você a compreender mais facilmente o panoram
Gold Entry Sniper
Tahir Mehmood
5 (21)
Gold Entry Sniper – Painel ATR Multi-Tempo Profissional para Scalping e Swing Trading em Ouro Gold Entry Sniper é um indicador avançado para MetaTrader 5 projetado para fornecer sinais de compra/venda precisos para XAUUSD e outros ativos, com base na lógica de Trailing Stop ATR e análise multi-tempo . Ideal tanto para scalpers quanto para swing traders. Principais Recursos e Vantagens Análise Multi-Tempo – Veja a tendência de M1, M5 e M15 em um único painel. Trailing Stop Baseado em ATR – Níveis
Adaptive Price Action Engine Compre um indicador, ganhe o EA de graça Análise Auto-Otimizada de Tendências e Padrões de Candlestick em Múltiplos Timeframes Os mercados estão em constante mudança, e nem todos os padrões de Price Action têm o mesmo valor em todas as condições de mercado. O Adaptive Price Action Engine foi desenvolvido para se adaptar às mudanças nas condições do mercado, combinando estrutura de tendência, análise Multi-Timeframe, padrões de candlestick e otimização estatística em
Auto Optimized SpeedAngle é um sistema de vetorização de momentum de nível institucional que elimina o sobreajuste ( curve-fitting ) por meio da otimização contínua de avanço ( Walk-Forward Optimization , WFO). Em vez de depender de entradas estáticas que se degradam quando os regimes de mercado mudam, o indicador recalibra dinamicamente seus parâmetros utilizando validação fora de amostra ( Out-of-Sample , OOS), garantindo que os sinais exibidos representem vantagens estatísticas genuínas e não
FiboSniper Pro
Van Minh Nguyen
5 (4)
FiboSniper Pro – Multi-Filter Fibonacci System with Auto SL/TP and Control Panel FiboSniper Pro é um indicador técnico que combina Fibonacci Envelopes dinâmicos com vários filtros de confirmação para gerar sinais seletivos de Buy e Sell. Os níveis de Fibonacci são calculados com base em Moving Average e ATR e, em seguida, filtrados por ADX, EMA, RSI, ATR, Volume, Time e estrutura das velas. O indicador exibe diretamente no gráfico os níveis automáticos de Stop Loss e Take Profit baseados em ATR,
ARICoins
Temirlan Kdyrkhan
ARICoin is a powerful trading companion designed to generate high-probability entry signals with dynamic TP/SL/DP levels based on volatility. Built-in performance tracking shows win/loss stats, PP1/PP2 hits, and success rates all updated live. Key Features: Buy/Sell signals with adaptive volatility bands Real-time TP/SL/DP levels based on ATR Built-in MA Filter with optional ATR/StdDev volatility Performance stats panel (Success, Profit/Loss, PP1/PP2) Alerts via popup, sound, push, or email Cust
Boba Analysis Suite
Trade Ready Solutions LLC
5 (2)
Boba Analysis Suite O Boba Analysis Suite é um indicador de análise para o MetaTrader 5. Reúne a estrutura do mercado, as zonas de preço relevantes e o contexto geral do mercado numa única visualização do gráfico. Desenvolvido a partir da experiência prática como trader e formador de traders, apoia um processo de análise estruturado: avaliar a direção do mercado, identificar níveis importantes e analisar vários períodos gráficos em conjunto. Análise em contexto O significado de cada sinal depend
ScalpPoint
Temirlan Kdyrkhan
ScalpPoint is a powerful trading companion designed to generate high-probability entry signals with dynamic TP/SL/DP levels based on volatility. Built-in performance tracking shows win/loss stats, PP1/PP2 hits, and success rates — all updated live. Key Features: Buy/Sell signals with adaptive volatility bands Real-time TP/SL/DP levels based on ATR Built-in MA Filter with optional ATR/StdDev volatility Performance stats panel (Success, Profit/Loss, PP1/PP2) Alerts via popup, sound, push, or emai
Atomic Analyst MT5
Issam Kassas
4.5 (64)
Atomic Analyst — MetaTrader 5 Após a compra, envie-me uma mensagem no MQL5 para receber Smart Universal Expert Advisor GRÁTIS, além do curso online, do manual em PDF e do acesso ao grupo privado. O Atomic Analyst reúne a ação do preço, a direção da tendência, sinais de entrada e saída, Stop Loss e vários níveis de Take Profit diretamente no seu gráfico. VEJA O SINAL. ENTENDA O CENÁRIO. O Atomic Analyst organiza sua análise em informações visuais claras: • Setas de compra e venda para identificar
Crystal Heikin Ashi Signals
Muhammad Jawad Shabir
5 (5)
Crystal Heikin Ashi Signals—Professional Trend & Signal Detection Indicator Advanced Heikin Ashi Visualization with Intelligent Signal System for Manual & Automated Trading Final Price: $149 ---------> Price goes up $10 after every 10 sales . Limited slots available — act fast . Overview User Guide PDF Crystal Heikin Ashi Signals is a professional-grade MetaTrader 5 indicator that combines pure Heikin Ashi candle visualization with an advanced momentum-shift detection system. Designed for both m
O Scalper Vault é um sistema de negociação poderoso e completo, projetado para traders que buscam consistência em operações intraday. Este indicador de alta precisão funciona como um sistema de negociação autônomo, oferecendo análises de nível institucional tanto para o mercado Forex quanto para Opções Binárias. ENTRE EM CONTATO COMIGO APÓS A COMPRA PARA RECEBER DICAS DE NEGOCIAÇÃO E UM BÔNUS EXCLUSIVO! Ao eliminar suposições e análises manuais complexas, o Scalper Vault permite que você foque
Azimuth Pro
Ottaviano De Cicco
5 (7)
Azimuth Pro V2: Estrutura Fractal Sintética e Entradas Confirmadas para MT5 Visão geral Azimuth Pro é um indicador de estrutura swing multinível da Merkava Labs . Quatro camadas de swing aninhadas, VWAP ancorado em swings, detecção de padrões ABC, filtragem estrutural de três timeframes e entradas confirmadas em barra fechada — um gráfico, um fluxo de trabalho dos micro-swings aos macro-ciclos. Este não é um produto de sinais cegos. É um fluxo de trabalho baseado em estrutura para traders que v
Trend Catcher ind mt5
Ramil Minniakhmetov
5 (18)
INDICADOR TREND CATCHER O Indicador Trend Catcher analisa os movimentos de preços do mercado, utilizando uma combinação de indicadores de análise de tendências adaptativos, proprietários e personalizados pelo autor. Identifica a verdadeira direção do mercado, filtrando o ruído de curto prazo e focando a força do momentum subjacente, a expansão da volatilidade e o comportamento da estrutura de preços. Utiliza também uma combinação de indicadores personalizados de suavização e filtragem de tendê
Volatility Master for MetaTrader is a real-time dashboard tool that scans up to  50 symbols  to identify high-volatility , trending markets instantly. With bullish/bearish signals, customizable alerts, and a user-friendly interface, it helps you avoid range-bound conditions and focus on high-probability trades. Clarity leads to confidence. Trade confidently and protect your capital effectively with this powerful dashboard. We don't offer free or bonus indicators in exchange of reviews from you.
Apex Patterns PRO Compre o indicador - Obtenha um Expert Advisor baseado nele GRATUITAMENTE. Inteligência Auto-otimizada de Padrões e Rompimentos Os rastreadores de padrões tradicionais dependem de entradas fixas, frequentemente apresentando baixo desempenho quando a volatilidade e as estruturas do mercado mudam. O Apex Patterns PRO foi projetado para se adaptar às mudanças nas condições do mercado, combinando o reconhecimento estrutural de padrões de gráfico, filtragem de momentum e auto-otimi
Neuro Poseidon MT5
Daria Rezueva
4.68 (53)
Neuro Poseidon is a new indicator by Daria Rezueva. It combines precise trading signals with adaptive TP/SL levels - creating best possible trades as a result! Message me and get  Neuro Poseidon Assistant  as a gift to automize your trading process! What makes it stand out? 1. Proven profitability on all assets and timeframes 2. Only confirmed BUY and SELL signals present on the chart 3. Adaptive TP & SL levels generated by the software for each trade 4. Easy to understand - suitable for al
SIO Oscillator: oscilador auto-otimizável de desequilíbrio de semivariância Compre o indicador e receba GRÁTIS o Expert Advisor (EA) baseado nele. A maioria dos osciladores trata todo movimento de preço da mesma forma. O SIO separa a pressão de alta da pressão de baixa e mede o desequilíbrio entre elas, mostrando qual lado realmente controla o mercado: compradores ou vendedores. Quando o desequilíbrio atinge um extremo, o SIO gera um sinal claro com níveis de entrada, Stop Loss e Take Profit. O
Mais do autor
Pivot Stop Gold
Vasilii Makarenko
O Pivot Stop Gold é construído em torno de uma situação no ouro: o preço vira em um swing e depois o atravessa. O EA não persegue o movimento. Uma ordem stop pendente já está esperando perto do swing, com seu stop e alvo anexados, antes de o preço chegar lá. As posições são curtas: no relatório abaixo a média durou cinco minutos. O Nível Pivô Em cada novo bar do seu timeframe de trabalho o EA constrói um ZigZag a partir dos últimos 300 bars e pega os dois pivôs mais recentes, nunca contando o ba
Swept Liquidity Pools
Vasilii Makarenko
5 (1)
A liquidity sweep is a bar that pushes past a prior swing high or swing low, where protective stop orders tend to rest, and then closes back on the inner side of that level. The same event is known under several names: a stop hunt, a stop run, a liquidity grab, a false breakout, a failed breakout, or a swing failure. Swept Liquidity Pools marks those levels and those bars on the chart. The indicator tracks liquidity pools - confirmed swing levels that have not yet been taken - and marks the exac
FREE
Three Anchors On One Chart Most volume weighted average lines restart once a day. This one draws three at the same time: one anchored to the current trading session, one to the day, one to the week. Their spread tells you something a single line cannot. When the session line sits far under the weekly one, the week has been trading higher than today is; when all three sit together, the market has spent the week in one place. Why The Session Anchor Is Not Midnight The session line starts where the
FREE
Hourly Spread Map answers one question: at which hours does this symbol cost more to enter, and by how much. It reads the spread field that the terminal stores in every closed M1 bar of your own broker feed, sorts those measurements into 24 hours by 7 days of the week, and shows the result as a grid in the indicator sub-window. What It Measures Every closed M1 bar carries one spread measurement. The indicator collects them over the period you choose, groups them by the hour and weekday of the ba
FREE
Trade Risk Desk answers one question at the moment you need it answered: what volume makes this stop cost exactly what you decided to risk. Drag the stop line to where it belongs on the chart and the panel prints the volume, the money behind it, and the margin the position will hold. What It Answers Set the risk as a percent of balance or as a fixed amount in account currency. Put the stop where your idea says it belongs. The panel reads the symbol settings your broker publishes and prints: the
FREE
What It Shows Candle Clock Desk puts four lines on the chart. The first is the time left until the current bar closes. The next three answer a question the clock alone cannot: is this bar unusually busy, or unusually quiet, right now. Bar closes in - the countdown, in minutes and seconds So far - volume this bar has accumulated since it opened Usual here - what this symbol had accumulated by this same minute, in the past Pace - the first divided by the second The Pace Line Pace of 1.00 means the
FREE
Swap is the part of the cost that is easy to forget, because it arrives once a day, quietly, and never appears in the spread. Swap Cost Calendar puts it on the chart as a number you can act on. What It Shows The panel reads what the broker publishes for the current symbol and shows four things. The cost of one night for a long position and for a short one, in your account currency or in points. The weekday line, showing how many nightly charges a position carries on each day of the week. The tri
FREE
Range Zones M30
Vasilii Makarenko
Range Zones M30 draws zones on your chart where price was pushed back hard on the 30-minute timeframe. It works on any symbol and any chart timeframe, and reads only the prices your terminal already has. It does not use any server, does not send anything out, and does not open or change orders. What It Shows A resistance zone above the market and a support zone below it, as filled rectangles that start at the open of the swing candle that formed them and run to the right. At any moment there is
Signal Confirm
Vasilii Makarenko
Signal Confirm watches one symbol and tells you when a trend setup has passed a fixed chain of checks. It works on any symbol and any chart timeframe. It reads only the M1 prices, the prices of the oscillator timeframe (M5 by default) and the daily prices your terminal already has, does not use any server, does not send anything out, and does not open, change or close orders. It shows what happened and when; the decision stays with you. What It Does When the chain below is complete, the indicato
Volatility Dots
Vasilii Makarenko
Volatility Dots puts a trailing line of dots on your chart. In an uptrend the dots sit under the price, in a downtrend above it, and they flip when price closes through the opposite band. It works on any symbol and any timeframe. It reads only the prices your terminal already has, does not use any server, does not send anything out, and does not open or change orders. What It Shows One dot per bar. White dots under the candles mark a rising trend, red dots above the candles mark a falling trend.
Daily Range Ladder draws six horizontal levels across the current trading day. The distances come from how far the symbol usually travels in a day, so the levels adapt to every symbol without any setting. It works on any symbol and any chart timeframe. It reads only the daily bars your terminal already has, does not use any server, does not send anything out, and does not open or change orders. What It Shows Three resistance levels above the day's low and three support levels below the day's hig
Um pool de liquidez é uma máxima ou mínima de swing confirmada que ainda não foi tomada. Um sweep de liquidez é a barra na qual o preço negocia além desse nível e depois fecha de volta dentro do intervalo - o mesmo evento que os traders também chamam de caça ao stop, corrida ao stop, captura de liquidez ou rompimento falso. O Liquidity Sweep Pools MTF marca tanto os pools quanto os sweeps de liquidez feitos sobre eles, no gráfico atual e em um timeframe superior que você escolher, e adiciona um
Structure Desk
Vasilii Makarenko
Um expert advisor para XAUUSD no MetaTrader 5. Ele trabalha com uma cesta por vez: abre em um conjunto fixo de horas do servidor, adiciona à posição enquanto o preço se move contra ela, e fecha a cesta inteira de uma vez. Não há stop loss e não há take profit nas posições individuais. Como Ele Negocia Um símbolo, XAUUSD, uma cesta por vez, até 5 ordens na mesma direção. As entradas são permitidas apenas em horas fixas do servidor, e apenas quando o preço está na borda do seu intervalo de quatro
Sarveon
Vasilii Makarenko
Sarveon é um expert advisor para XAUUSD no MetaTrader 5. Nove estratégias independentes rodam lado a lado em um único gráfico. Cada uma tem seu próprio magic number, seu próprio timeframe de entrada e seu próprio conjunto de distâncias, e nenhuma delas jamais adiciona a uma posição aberta por outra. Como Ele Negocia Cada estratégia varre os candles recentes de seu próprio timeframe de entrada em busca de um nível de swing: uma máxima que nenhum candle posterior superou, ou uma mínima que nenhum
Ridgeline
Vasilii Makarenko
Ridgeline espera nos níveis de preço que o ouro deixou em paz. Ele lê barras diárias, marca as máximas e mínimas que nenhuma barra posterior superou, e coloca uma ordem stop pendente ali. Sete conjuntos de regras procuram em diferentes profundidades do histórico, então um pode estar esperando em um nível formado na semana passada enquanto outro observa um de três meses atrás. Um conjunto que sofre uma perda fica de fora por dois dias antes de colocar qualquer coisa novamente. Cada conjunto carre
Sixfold Gold
Vasilii Makarenko
Sixfold Gold trades XAUUSD on the hourly chart. It looks for the points where the market turned and left an extreme behind, places a pending stop order a little inside that level, and attaches a stop loss and a take profit before the order is ever filled. Six zones do this independently, each with its own search depth, and between them they read three timeframes and four sessions, so the advisor is rarely committed to a single view of the market. A trade that goes wrong is closed by its stop. No
GhBreak
Vasilii Makarenko
O GhBreak baseia-se em uma ideia sobre o ouro: um rompimento de uma máxima ou mínima de swing que se manteve desde que se formou pode correr o suficiente para pagar pelos rompimentos que falham. O EA não persegue o rompimento. Uma ordem stop pendente já está esperando no nível, com seu stop e alvo anexados, antes de o preço chegar lá. As posições são mantidas por pouco tempo: no relatório abaixo a média durou 22 minutos. O Nível de Swing Cada conjunto de regras constrói suas próprias barras - H2
Um Painel Em Vez De Cinco Janelas Ler um mercado geralmente significa manter várias janelas abertas ao mesmo tempo: uma média móvel para a direção, um oscilador para o momento, um indicador de força para distinguir uma tendência de um intervalo, e mais alguma coisa para os níveis. Cada um responde à sua própria pergunta no seu próprio canto da tela. O Signal Compass Desk coloca essas leituras em um único bloco no canto do gráfico. Uma olhada diz para que lado o mercado está inclinado, se o movim
Tessera builds a footprint (cluster) chart from the trade ticks that your MetaTrader 5 terminal already receives from your broker. Prices, volumes and sides come from your own data feed; the indicator does not use any external server, does not send anything out and does not read or store your account details. What It Shows Buy and sell volume inside each bar, price by price, with numbers when they fit. Delta of the bar (the difference between buy and sell volume), cumulative delta and a delta st
What You See On The Chart Swing Percentile Desk places one table on one chart. Each row is a symbol from your watchlist and each column is a pullback size. A cell tells you what share of that symbol's earlier moves the current move has already outdone. A low number means a young move; a high number means the move is stretched compared with the history of the same symbol. Every symbol is compared only with itself, so a quiet pair and a restless pair are read on the same scale and no manual measur
Session Open Carry
Vasilii Makarenko
Session Open Carry is built on one idea: the side on which a session opened shows which way to hold a position until the next day. Once a day, at a set minute, the EA compares the last price with the open of the session. Price above the open - it buys. Price below the open - it sells. Price at the open - it stays out. The stop is placed at the extreme of the session, the position is carried overnight and it is closed at a set minute on a later day. The EA tests this idea on every session and doe
Gold Brackets
Vasilii Makarenko
Gold Brackets is built on one idea about gold: price that comes back to a swing high or low which has stood unbroken often goes through it with force, and a stop order waiting at the level catches that move without chasing it. The EA places the pending order ahead of time, with the stop loss and the take profit already attached, and cancels it when the level stops being valid. The Swing Level Every rule set looks at hourly bars for the nearest swing high and swing low: a bar whose high (or low)
Filtro:
Sem comentários
Responder ao comentário