Auto Level Map

What Gets Drawn

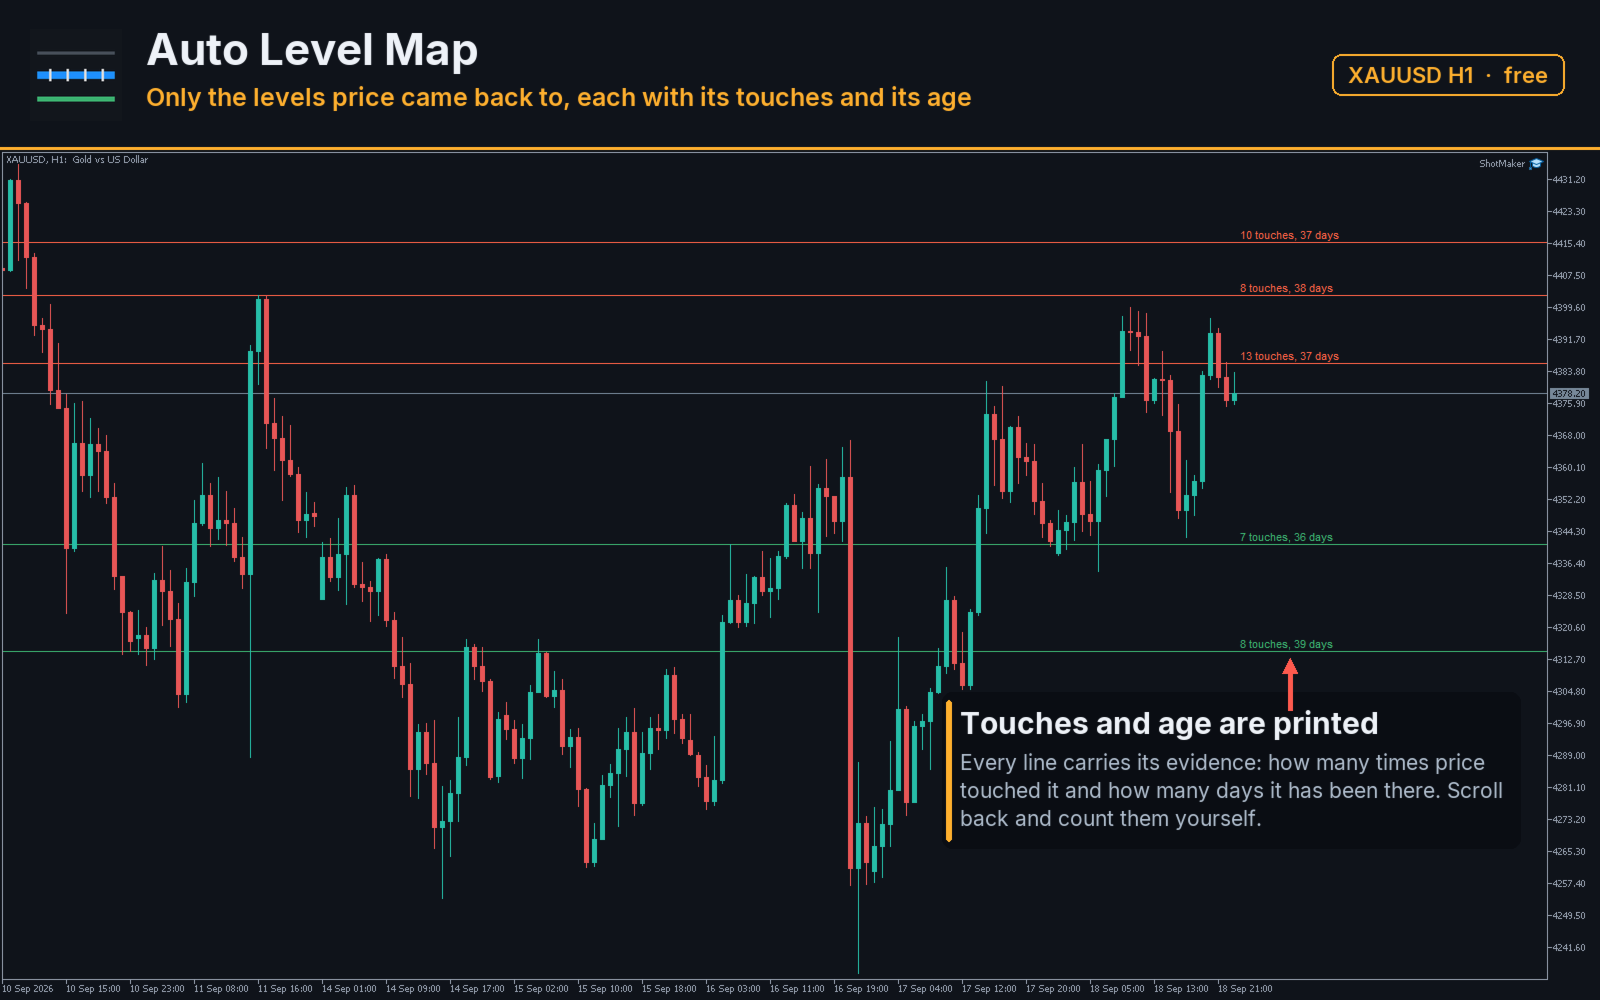
Most level tools mark every swing they can find, and a chart with forty lines answers nothing. This one keeps a level only when price came back to it, and prints the evidence next to the line: the number of touches and the age in days.

Lines above current price and lines below it are drawn in different colours, so the map reads at a glance without counting.

What Puts A Level On The Chart

A swing high is a bar whose high is not lower than its neighbours on both sides, within the number of bars you set; a swing low is its mirror. Swings that land within the merge distance of each other are not separate levels, they are one level touched twice, and the price of that level is the running average of everything merged into it, so a single outlier does not drag it.

A level with fewer touches than your threshold is not drawn at all. That is the whole point: the chart shows the few places price kept returning to, not every place it ever turned.

Touches And Age Are Printed, Not Implied

Next to each line stands the count and the age: "4 touches, 31 days". Both are verifiable on your own chart in a minute. Scroll back, find the swings near that price, count them. If the count on the screen disagrees with what you count by hand, write it in the comments with the symbol and the timeframe.

Choosing The Merge Distance

Two swings a few points apart are the same level on gold and two different levels on a currency pair. The merge distance therefore defaults to a share of ATR rather than to a fixed number of points, and adapts to the instrument by itself. Where you want the old behaviour, switch the mode to Points and set the number you prefer.

Input Parameters

  • SwingBars - bars on each side that make a swing
  • HistoryBars - how far back swings are looked for
  • ToleranceMode - merge distance as a share of ATR, or in fixed points
  • ToleranceValue - the share, or the number of points
  • AtrPeriod - ATR period used by the share mode
  • MinTouches - how many touches a level needs before it is drawn
  • MaxLevels - how many levels appear on the chart, taken by touch count
  • ShowLabels - print the touch count and age next to each line
  • ColorAbove - colour of levels above price
  • ColorBelow - colour of levels below price
  • ObjectPrefix - prefix for every chart object created

Reading The Figures From An Expert Advisor

Four buffers are published: the nearest level above price, the nearest below, the distance to the closer of the two in points, and the touch count of that level. An expert advisor can ask "how far is the nearest level and how strong is it" without redoing the search. Buffers hold an empty value while no level passes the threshold.

Requirements

Any symbol and any timeframe. Levels are rebuilt once per finished bar, not on every tick: a swing needs finished bars on its right side, so nothing about it can change inside the current bar. The indicator places no orders and writes nothing to disk.

Support

Questions about a parameter, or a level whose count you cannot reproduce by hand: reply in the comments of this page with the symbol, the timeframe and the settings, and I will look into it. A rating helps other traders decide whether a free tool is worth their time, whichever way it goes.
Yazarın diğer ürünleri
Swept Liquidity Pools
Vasilii Makarenko
5 (1)
A liquidity sweep is a bar that pushes past a prior swing high or swing low, where protective stop orders tend to rest, and then closes back on the inner side of that level. The same event is known under several names: a stop hunt, a stop run, a liquidity grab, a false breakout, a failed breakout, or a swing failure. Swept Liquidity Pools marks those levels and those bars on the chart. The indicator tracks liquidity pools - confirmed swing levels that have not yet been taken - and marks the exac
FREE
Hourly Spread Map answers one question: at which hours does this symbol cost more to enter, and by how much. It reads the spread field that the terminal stores in every closed M1 bar of your own broker feed, sorts those measurements into 24 hours by 7 days of the week, and shows the result as a grid in the indicator sub-window. What It Measures Every closed M1 bar carries one spread measurement. The indicator collects them over the period you choose, groups them by the hour and weekday of the ba
FREE
Swap is the part of the cost that is easy to forget, because it arrives once a day, quietly, and never appears in the spread. Swap Cost Calendar puts it on the chart as a number you can act on. What It Shows The panel reads what the broker publishes for the current symbol and shows four things. The cost of one night for a long position and for a short one, in your account currency or in points. The weekday line, showing how many nightly charges a position carries on each day of the week. The tri
FREE
Three Anchors On One Chart Most volume weighted average lines restart once a day. This one draws three at the same time: one anchored to the current trading session, one to the day, one to the week. Their spread tells you something a single line cannot. When the session line sits far under the weekly one, the week has been trading higher than today is; when all three sit together, the market has spent the week in one place. Why The Session Anchor Is Not Midnight The session line starts where the
FREE
What It Shows Candle Clock Desk puts four lines on the chart. The first is the time left until the current bar closes. The next three answer a question the clock alone cannot: is this bar unusually busy, or unusually quiet, right now. Bar closes in - the countdown, in minutes and seconds So far - volume this bar has accumulated since it opened Usual here - what this symbol had accumulated by this same minute, in the past Pace - the first divided by the second The Pace Line Pace of 1.00 means the
FREE
Bir likidite havuzu, henüz alınmamış onaylanmış bir salınım yükseği veya salınım düşüğüdür. Bir likidite süpürmesi, fiyatın o seviyenin ötesinde işlem gördüğü ve ardından aralığın içine geri kapandığı bardır - yatırımcıların aynı olaya stop avı, stop çalıştırma, likidite kapma veya sahte kırılım da dediği olay. Liquidity Sweep Pools MTF, hem havuzları hem de üzerlerinde alınan likidite süpürmelerini, mevcut grafikte ve seçtiğiniz daha yüksek bir zaman diliminde işaretler ve aktif havuzlardan olu
Structure Desk
Vasilii Makarenko
XAUUSD için MetaTrader 5 üzerinde çalışan bir uzman danışman. Aynı anda tek bir sepetle çalışır: sabit sunucu saatlerinde açar, fiyat pozisyona karşı hareket ederken pozisyona ekleme yapar ve tüm sepeti birlikte kapatır. Tek tek pozisyonlarda stop loss ve take profit yoktur. Nasıl İşlem Yapar Tek sembol, XAUUSD, aynı anda tek sepet, aynı yönde en fazla 5 emir. Girişlere yalnızca sabit sunucu saatlerinde izin verilir ve yalnızca fiyat dört saatlik aralığının kenarında olduğunda. Sunucu saatiyle 1
Sarveon
Vasilii Makarenko
Sarveon, MetaTrader 5 üzerinde XAUUSD için bir uzman danışmandır. Dokuz bağımsız strateji tek bir grafikte yan yana çalışır. Her birinin kendi magic number'ı, kendi giriş zaman dilimi ve kendi mesafe seti vardır ve hiçbiri bir başkasının açtığı pozisyona asla ekleme yapmaz. Nasıl İşlem Yapar Her strateji, kendi giriş zaman dilimindeki son barları bir swing seviyesi için tarar: sonraki hiçbir barın aşmadığı bir yüksek veya sonraki hiçbir barın kırmadığı bir düşük. Seviye, mevcut fiyattan minimum
Ridgeline
Vasilii Makarenko
Ridgeline, altının dokunmadığı fiyat seviyelerinde bekler. Günlük barları okur, sonraki hiçbir barın geçmediği yüksek ve düşükleri işaretler ve oraya bekleyen bir stop emri yerleştirir. Yedi kural seti tarihin farklı derinliklerinde arar, böylece biri geçen hafta oluşmuş bir seviyede beklerken bir diğeri üç ay öncesinden bir seviyeyi izler. Zarar eden bir set, yeniden bir şey yerleştirmeden önce iki gün devre dışı kalır. Her set kendi sihirli numarasını ve kendi mesafelerini taşır ve hiçbir set
Sixfold Gold
Vasilii Makarenko
Sixfold Gold trades XAUUSD on the hourly chart. It looks for the points where the market turned and left an extreme behind, places a pending stop order a little inside that level, and attaches a stop loss and a take profit before the order is ever filled. Six zones do this independently, each with its own search depth, and between them they read three timeframes and four sessions, so the advisor is rarely committed to a single view of the market. A trade that goes wrong is closed by its stop. No
Filtrele:
Değerlendirme yok
Değerlendirmeye yanıt