PHSB Elliott Wave
- Indicators
-
Paulo Henrique Sanches Bonanni
 Com início em 2018, Paulo Henrique Sanches Bonanni, proprietário e fundador da PHSB Consultoria, iniciou sua jornada como uma empresa de consultoria administrativa e logo em seguida, também foi se direcionando para o mercado financeiro com foco total em estruturas automatizadas com uso de EA (Expert
 - Version: 1.6
- Updated: 1 September 2026
Identify Market Structure Through Elliott Waves
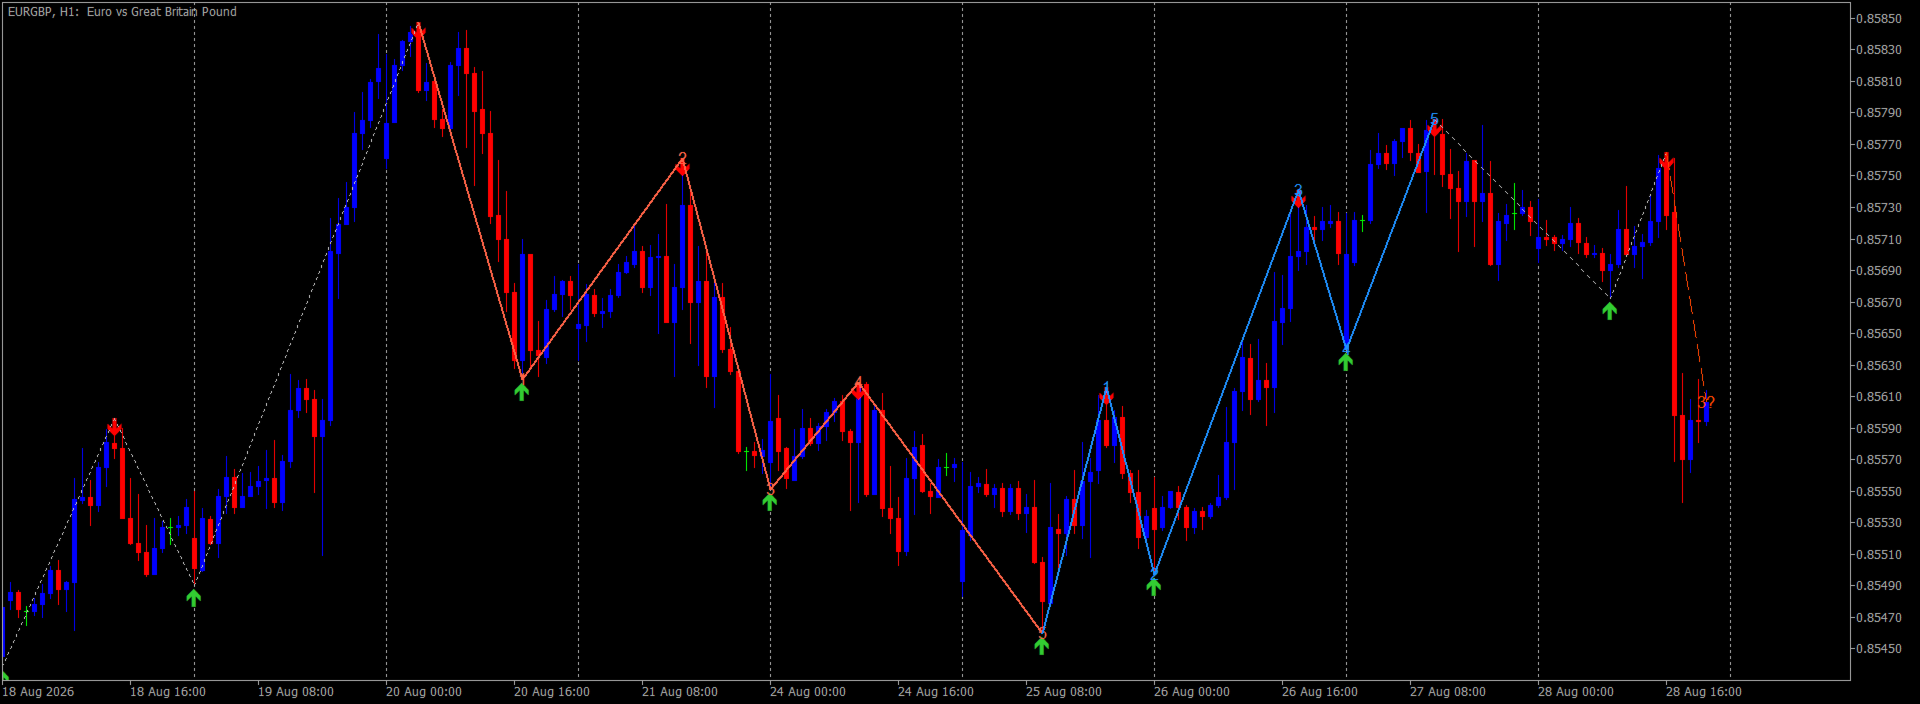
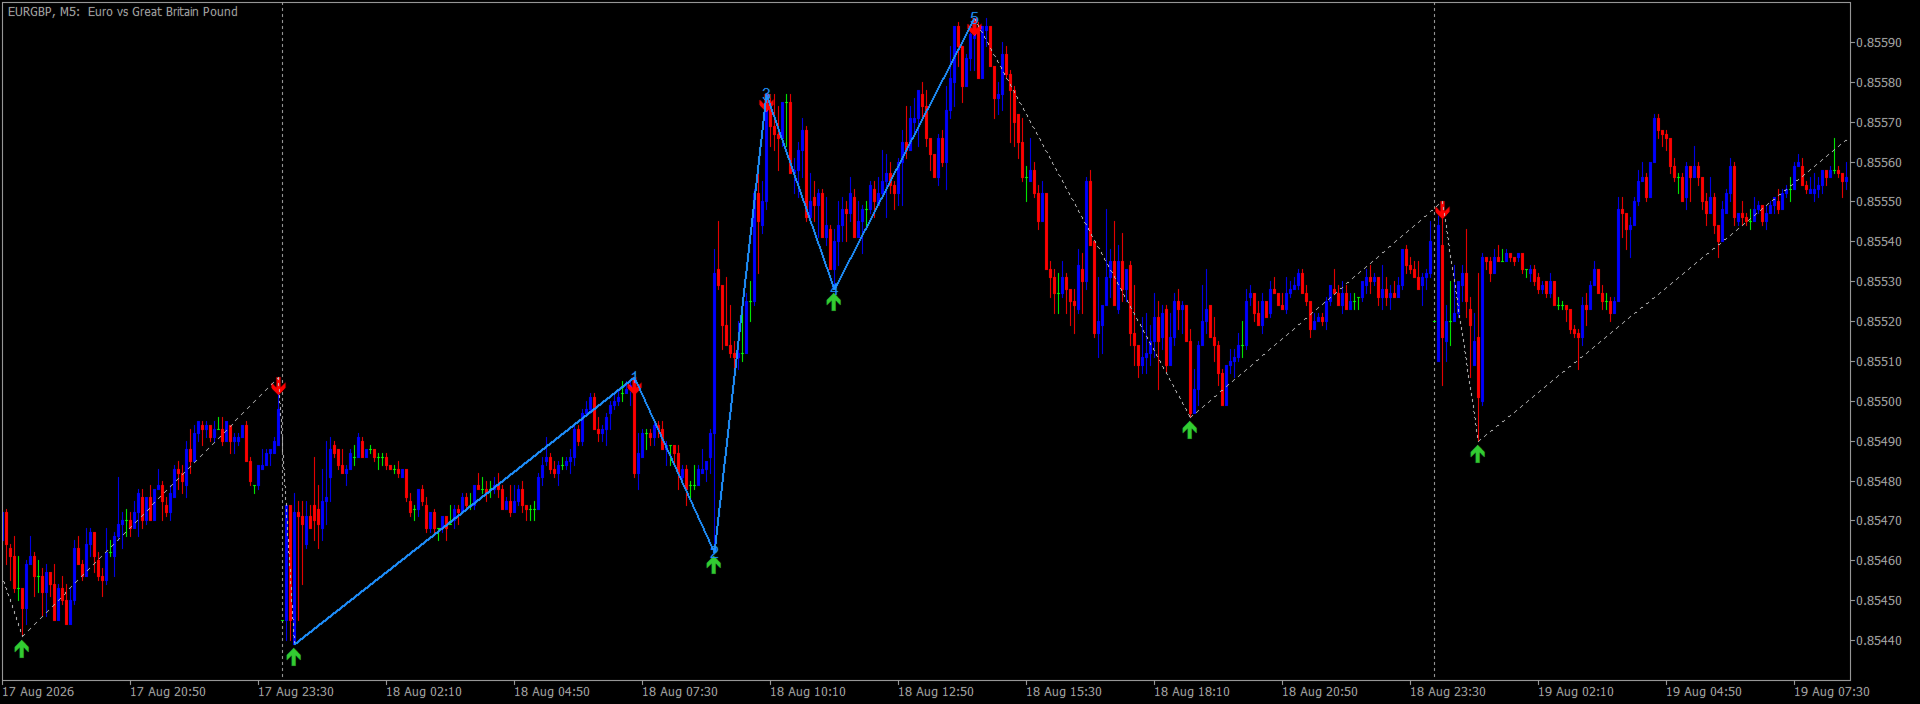
PHSB Elliott Wave is an indicator developed for MetaTrader 5 with the goal of helping traders identify and monitor Elliott Wave patterns directly on the chart.
The purpose of the indicator is to transform a theory that can often seem subjective into a more objective, visual, and organized way of reading price structure.
Instead of simply looking for isolated patterns, the indicator monitors the formation of market pivots and uses these points to build and validate possible Elliott Wave structures.
How Does the Indicator Work?
The market is constantly forming highs and lows.
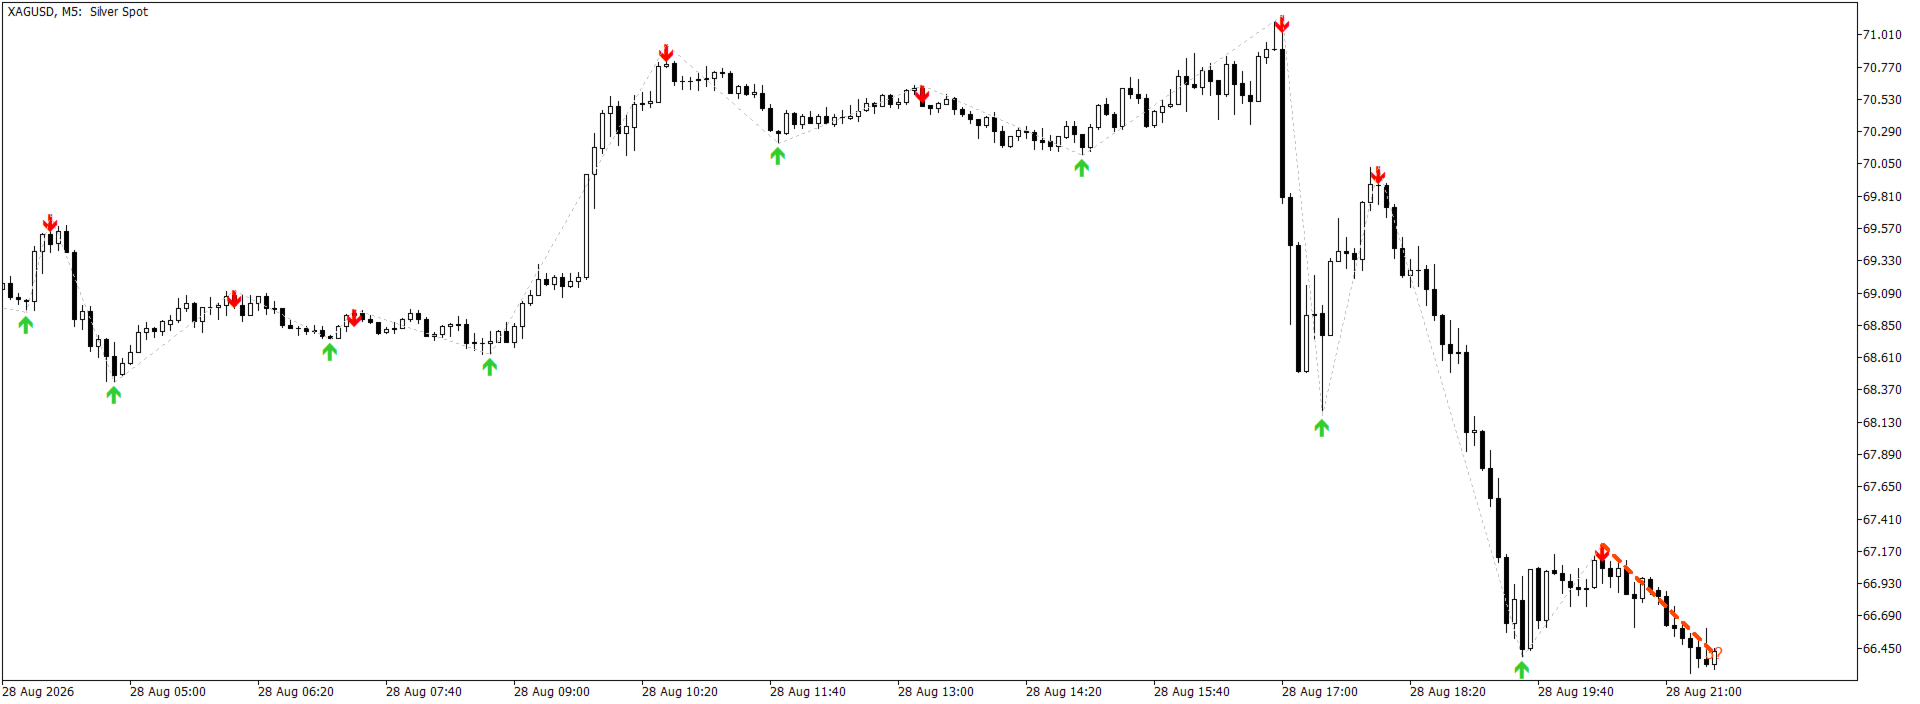
PHSB Elliott Wave uses these movements to identify the main structural pivots in price.
Based on these pivots, the indicator looks for the characteristic sequence of Elliott Waves:
1 → 2 → 3 → 4 → 5
In a bullish impulse structure, for example:
Wave 1: beginning of the upward movement
Wave 2: correction of Wave 1
Wave 3: expansion move, usually the strongest
Wave 4: another correction
Wave 5: final impulse move of the structure
After the completion of the impulse movement, the market may begin a corrective structure, commonly represented as:
A → B → C
The indicator attempts to follow the evolution of these structures as new pivots are formed.
A Key Feature: Waves Can Be Identified While They Are DevelopingOne of the most interesting features of PHSB Elliott Wave is that it was not designed simply to look at the past and say:
"This was a Wave 3."
The goal is also to monitor the structure while it is being formed.
This is particularly important because a Wave 3 does not need to be completely finished before there are indications that a new impulse structure may be developing.
As price breaks certain pivots and confirms new structural movements, the indicator can begin to display a possible wave count before the entire movement has been completed.
This allows the trader to monitor the evolution of the structure in real time.
Pivot-Based IdentificationPivots are the foundation of the indicator's analysis.
Instead of attempting to interpret every small price movement, the system looks for relevant structural movements.
These pivots serve as references for:
-
identifying changes in direction;
-
determining important highs and lows;
-
building the wave sequence;
-
evaluating whether a new wave may be developing;
-
validating or invalidating a previous count.
This approach helps reduce the amount of noise present on the chart.
Elliott Wave Rule VerificationAfter identifying the pivots, the indicator does not simply assign numbers to price movements.
It also performs checks based on the main rules of the Elliott Wave structure.
Among the elements analyzed are the relationships between waves and the validity of the structural sequence.
For example, in a traditional impulse structure, some important rules must be respected.
Wave 2
Wave 2 represents a correction of Wave 1 and should not completely retrace beyond the beginning of Wave 1 in a valid impulse structure.
Wave 3
Wave 3 should represent an expansion relative to the previous structure and, in a traditional impulse count, cannot be the shortest of Waves 1, 3, and 5.
Wave 4
Wave 4 represents another correction following Wave 3.
In a conventional impulse structure, it should not invalidate the structural territory established by Wave 1.
These checks help the indicator eliminate some wave counts that do not comply with the basic logic of Elliott Wave theory.
Elliott Wave Is Not an Exact ScienceIt is important to understand one fundamental characteristic:
PHSB Elliott Wave does not predict the future.
Elliott Wave is a market analysis methodology based on the interpretation of price structure.
Different analysts may interpret the same price movement in different ways.
For this reason, the indicator should not be understood as a tool that "knows" what the next wave will be.
Instead, it works with possible structures, using the information available on the chart at that particular moment.
As new price data becomes available, a wave count may:
-
be confirmed;
-
evolve;
-
be modified;
-
or become invalid.
And this is part of the nature of structural market analysis.
Why Are Pivots So Important?Imagine the following movement:
Low → High → Low → High → Low → High
Each of these points represents an important change in price direction.
The indicator uses these points to help answer the question:
"What structure is the market forming?"
From this structure, it becomes possible to look for a sequence compatible with Elliott Wave theory.
Therefore, the indicator is not simply placing random numbers on the chart.
There is a logical sequence:
Price → Pivots → Structure → Rules → Possible Wave
How to Interpret the IndicatorPHSB Elliott Wave should primarily be used as a structural analysis tool.
A possible interpretation process would be:
1. Observe the Pivots
First, identify where the market is forming relevant highs and lows.
2. Observe the Structure
Check whether the movements are beginning to form a sequence compatible with an impulse structure.
3. Monitor Wave 2
After a possible Wave 1, observe the correction.
4. Look for Evidence of Wave 3
The expansion following the Wave 2 correction is one of the most important moments in the structure.
5. Monitor the Evolution
If the structure continues to respect the rules, additional waves may be identified.
6. Be Prepared for Invalidation
If price breaks an important structural reference, the current wave count may no longer be valid.
Do Not Confuse Identification with PredictionThis may be the most important message for anyone using the indicator.
PHSB Elliott Wave is not designed to say:
"The market is going to rise."
or
"Wave 3 is definitely starting now."
The idea is different:
"Based on the structure the market has developed so far, this is a possible interpretation according to the rules used by the indicator."
This distinction is fundamental.
The market remains free to make any movement.
The indicator follows what price is doing and adapts the structural interpretation as new information becomes available.
Who Is This Indicator For?PHSB Elliott Wave can be used by traders who want to:
-
study Elliott Wave theory;
-
visualize impulse structures;
-
monitor possible Waves 1, 2, 3, 4, and 5;
-
identify possible corrective structures;
-
analyze the development of a potential Wave 3;
-
monitor important market pivots;
-
combine Elliott Wave with traditional technical analysis;
-
use market structure as an additional factor in their trading decisions.
It can be used across different assets and timeframes, as long as the trader understands that the number and relevance of the movements identified will depend on the timeframe and the characteristics of the asset being analyzed.
A Decision-Support ToolPHSB Elliott Wave was developed as a decision-support tool, not as an automated decision-making system.
It can be combined with other forms of market information, such as:
-
trend analysis;
-
support and resistance;
-
volume;
-
moving averages;
-
Fibonacci levels;
-
volatility;
-
price action;
-
risk management.
The more information used together, the greater the trader's ability to put the identified structure into context.
Continuous DevelopmentPHSB Elliott Wave was created from an effort to make Elliott Wave analysis more practical and objective within MetaTrader 5.
The current version represents one stage of this development.
The idea is to continue improving the algorithm as new market situations are observed, seeking to enhance structural identification and, most importantly, reduce inconsistent interpretations.
The indicator is not intended to replace knowledge of Elliott Wave theory.
On the contrary.
The goal is to provide traders with a visual tool to study the theory, monitor the development of waves, and compare their own analysis with the structure identified by the indicator.
ConclusionThe market leaves clues.
Every high, every low, and every expansion or correction is part of a larger structure.
The goal of PHSB Elliott Wave is to help traders see that structure.
It is not a crystal ball.
It is a tool designed to organize what price is showing.
Observe the pivots.
Understand the structure.
Check the rules.
Monitor the development of the waves.
And, most importantly, let price confirm the analysis.
PHSB Elliott Wave — turning Elliott Wave theory into a visual and objective way of reading market structure.