Topos e fundos com fibo
- Indicators
-
Paulo Henrique Sanches Bonanni
 Com início em 2018, Paulo Henrique Sanches Bonanni, proprietário e fundador da PHSB Consultoria, iniciou sua jornada como uma empresa de consultoria administrativa e logo em seguida, também foi se direcionando para o mercado financeiro com foco total em estruturas automatizadas com uso de EA (Expert
 - Version: 1.3
- Updated: 1 September 2026
A clearer view of market extremes and the current market structure
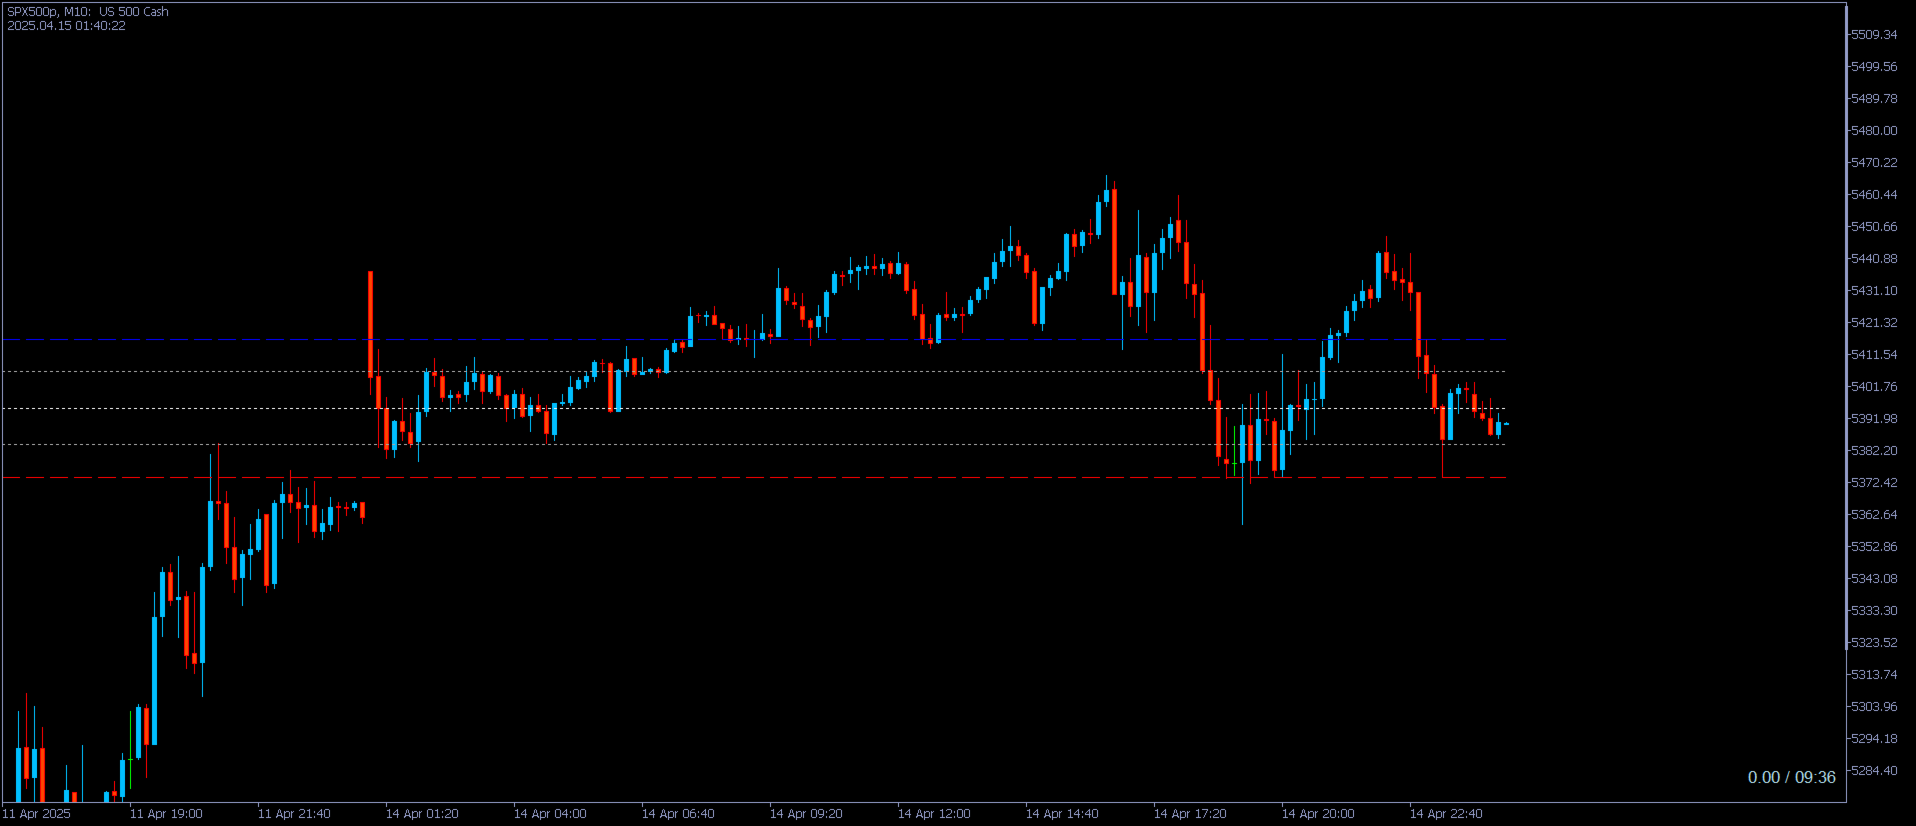
PHSB_Topo_Fundo is an indicator developed for MetaTrader 5 to help traders visualize the price structure within a market range, highlighting its main extremes and intermediate areas.
In addition to identifying the Top and Bottom, the indicator combines other relevant information into a single interface, allowing traders to simultaneously observe the analyzed price range, the current position of price within that range, and recent candle behavior.
The concept is simple:
less scattered information on the chart and more context for your analysis.
🔹 Top and Bottom IdentificationThe main feature of the indicator is the identification of the extremes within the analyzed range.
PHSB_Topo_Fundo displays directly on the chart:
-
Top of the range;
-
Bottom of the range;
-
Middle of the range;
-
Intermediate reference levels.
These levels are projected on the chart to make the current market structure easier to visualize.
The number of bars used in the analysis can be configured by the user.
📐 The Market Range in a Single ViewInstead of looking only at the current price, the indicator allows traders to visualize the market within a structure defined by its extremes.
This can help traders visually identify:
-
Where price is currently positioned within the range;
-
The distance from the Top;
-
The distance from the Bottom;
-
The central area of the structure;
-
Intermediate areas that can be used as references during analysis.
The indicator does not determine what the trader should do.
It simply organizes this information directly on the chart so that the trader can interpret the market context for themselves.
📊 Bar CounterPHSB_Topo_Fundo also includes an information panel that counts the candles within the selected analysis period.
It separately displays:
Bullish Bars
Bearish Bars
In addition to the number of bars, the indicator displays the corresponding percentage of bullish and bearish bars within the analyzed sample.
This provides a quick overview of how recent price behavior is distributed between bullish and bearish movements.
⚖️ Buy vs. SellAnother integrated feature is the visualization of the current volume positioned in Buy and Sell for the analyzed symbol.
This information is displayed directly in the indicator panel and updated dynamically.
This allows the trader to observe not only price behavior, but also the current amount of volume positioned in each direction.
⏱️ Dynamic InformationThe panel also provides continuously updated operational information, including the current financial result of open positions on the symbol and the remaining time until the current candle closes.
The goal is to keep important information available directly on the chart, without requiring the trader to constantly switch between different MetaTrader 5 windows.
🕐 Independent TimeFrameOne of the important features of PHSB_Topo_Fundo is the ability to select a specific TimeFrame for Top and Bottom analysis.
For example, the trader can use a higher timeframe to define the market structure while monitoring price behavior on a lower timeframe.
This makes the indicator flexible for different trading styles and analysis horizons.
⚙️ ConfigurationThe indicator was designed to provide simple and straightforward configuration.
Available parameters include:
-
Number of bars used in the analysis;
-
Initial analysis offset;
-
Reference TimeFrame;
-
Adjustment parameter.
This allows the user to adapt the tool to different assets and trading methodologies.
🎯 How Can It Be Used?PHSB_Topo_Fundo can be used as a complementary technical analysis tool.
One possible approach is to use the Top, Bottom and intermediate levels to better understand the current position of price within the observed range.
At the same time, the information panel can be used to monitor:
-
Bullish or bearish bar predominance;
-
Percentage of bullish and bearish bars;
-
Buy volume;
-
Sell volume;
-
Current result of open positions;
-
Remaining time until the current candle closes.
Each trader can combine this information with their own methodology, Price Action, technical indicators or trading system.
💡 The PHSB_Topo_Fundo DifferenceThe main difference lies in the combination of multiple pieces of market information within a single tool.
Instead of using one tool to identify extremes, another to analyze candles, and then checking open positions separately, PHSB_Topo_Fundo brings this information together directly on the chart.
The result is an objective and visual interface designed for traders who want a more organized view of the market.
🚀 Main Features✔ Visual Top and Bottom identification
✔ Middle line of the market range
✔ Intermediate reference levels
✔ Number of bullish and bearish bars
✔ Percentage of bullish and bearish bars
✔ Buy volume visualization
✔ Sell volume visualization
✔ Current result of open positions
✔ Candle countdown timer
✔ Configurable analysis TimeFrame
✔ Configurable number of bars
✔ Dynamically updated information
✔ Works directly on the MetaTrader 5 chart
👨💻 Designed for an Objective Market ViewPHSB_Topo_Fundo was developed around a simple philosophy:
present relevant information in a visual, organized and easy-to-monitor way.
It is not a promise to predict the market.
There is no guarantee that the displayed levels will be respected by price.
The indicator is an analytical support tool and should be used together with an appropriate trading methodology and risk management.
📌 ImportantMarket behavior is unpredictable, and no technical analysis tool can guarantee future results.
PHSB_Topo_Fundo does not constitute investment advice and should not be interpreted as a guarantee of profit.
Use the indicator as an auxiliary tool for your own analysis and make your trading decisions according to your profile, strategy and risk management.
PHSB_Topo_Fundo — See the range. Understand the context. Make your own decisions.