FluidTrades SMC MT4

FluidTrades SMC — Liquidity Sweeps, Structure & Multi-Timeframe Trend in One Preset

Sixteen Smart Money tools in one indicator — and a preset switch so you only ever see the three or four that matter for the trade in front of you.

Most "all-in-one" indicators fail the same way: they turn everything on at once and hand you a chart you cannot read. FluidTrades SMC ships the full toolkit, but it opens on a Signal preset that draws only what you act on — structure, swings, the liquidity sweep, the entry and the targets. Everything else is one dropdown away when you actually want it.

What is inside

The core — what you see on the default preset

1. Liquidity Sweep / Swing Failure Pattern The engine tracks a 20-bar swing on both sides. When price pushes through the swing low, closes back above it, and then holds above it for three consecutive candles, the level is marked as a swept liquidity zone ( LIQUZ ) with the sweep rail drawn back to the pivot that created it. A cooldown period stops the same pool being printed over and over.

2. Swing High / Swing Low rails The live swing high and swing low are drawn forward as dashed rails with a  SwH  /  SwL  marker. A rail stops extending once price has closed through it and stayed through it for five bars — so the chart shows you the levels that are still live, not a museum of every old pivot.

3. Market Structure — BOS / CHoCH Every structural break is labelled BOS (Break of Structure — the trend continued) or CHoCH (Change of Character — the trend flipped), with the current live structure drawn as an accent-coloured box around the working high and low. Break confirmation by candle body or by wick is your choice.

4. Structure Fibonacci The 0.618 and 0.5 retracements of the current structure leg are drawn automatically and re-anchor on every new break — the discount / premium zone, without you drawing a single fib by hand. The 0.786, 0.705 and 0.382 levels are available too.

5. Buy / Sell signals A SuperTrend flip filtered by a 13-period mean. Three sensitivity settings (Low / Medium / High) change how much noise gets through.

6. Entry / TP1 / TP2 / TP3 / SL rails Every signal projects a complete trade skeleton at the right edge: entry price, an ATR-derived stop, and the 1R / 2R / 3R targets measured from it. No mental arithmetic mid-trade.

7. Fair Value Gaps Three-candle imbalances, auto-extended to the right, greyed out the moment price trades into them and removed once they are fully filled — with an optional "shrink to the unfilled part" mode.

8. Multi-timeframe trend table Six timeframes, one row:  Up  or  Down  per timeframe, from EMA cross or SuperTrend. It tells you in one glance whether your entry is with or against the higher timeframes.

The rest of the toolkit — one preset away

Module What it draws
Supply / Demand zones ATR-sized zones from confirmed swings, with a POI mid-line, overlap filtering, and automatic conversion to a BOS marker when broken
Order Blocks MSB-triggered blocks that dim when tested and close off when filled
Support / Resistance Pivot-clustering S/R with strength filtering, zone bands and price labels
Multi-timeframe S/R The same clustering run on a higher timeframe and projected onto your chart
Trendlines Two engines: LuxAlgo-style decaying trendlines with break markers, and classic pivot-to-pivot lines
Volume Profile Price-by-volume with Point of Control, up/down split and bull/bear strength bars
Volume Histogram Per-bar volume with a moving average overlay
VWAP Session-anchored
Opening Range Breakout Configurable session window
Inside Bar / Breakout Inside-bar range rails plus breakout / breakdown markers, with an optional volume filter
EMA Energy Two fast means coloured by price position
Channel Balance A wide Keltner ribbon for stretch / exhaustion context
RSI bar colouring Highlights overbought / oversold bars in place
HH / LH / HL / LL labels and ZigZag The pure swing skeleton

The preset system

This is the part that makes the toolkit usable.

Preset What is drawn Use it for
Clean Swing rails, current structure, 0.618 / 0.5, trend table Reading the market. Maximum chart, minimum ink.
Signal (default) Clean + liquidity sweeps, Buy/Sell, FVG, Entry/TP/SL Actually taking trades.
SMC Signal + supply/demand, order blocks, S/R Full zone-to-zone analysis.
Custom Whatever you tick Building your own layout from all 16 modules.

One palette, two themes. Every module reads its colour from a single six-role palette — bullish, bearish, zone fill, accent, alert, neutral — with a Dark and a Light variant. There are no per-module colour settings to drift out of sync, and nothing on the chart clashes with anything else. Markers and their captions are offset so they never overlap, and every rail is drawn thin so your candles stay the brightest thing on screen.

How to trade / read signals with it

Reading the chart

What you see What it means What to do
CHoCH (amber line + label) First opposite-direction structure break — character has changed Bias flips. Stop taking trades in the old direction.
BOS (grey line + label) Structure broke in the direction it was already going Bias confirmed. Trade the pullback, not the break.
Accent box around price The current live structure leg (working high and low) This is the range you are trading inside.
0.618  /  0.5  line Discount / premium of the current leg Longs belong below 0.5, shorts above it.
Dashed rail +  SwH  /  SwL Live swing high / low — resting liquidity This is where price is likely headed before it reverses.
LIQUZ  + rail back to the pivot A liquidity pool was taken and rejected — a swept level Reversal fuel. Expect continuation away from the swept side.
▲ BUY / ▼ SELL marker SuperTrend flip confirmed by the mean filter A trigger, not a trade. It still needs the checklist below.
ENTRY / TP1-3 / SL rails The trade skeleton of the most recent signal Your levels are already measured.
FVG box (green / red) Unfilled 3-candle imbalance Magnet first, reaction second. Good target, good re-entry.
Greyed FVG box Price has traded into the gap Partially used. Weaker as a reaction zone.
Trend table all one colour Every timeframe agrees Highest-conviction environment. Size normally.
Trend table split Timeframes disagree Range conditions. Cut size or stand aside.
..  in the trend table That timeframe is still downloading Wait a few seconds; it fills itself in.

Long playbook

  1. Bias — a bullish CHoCH, or a bullish BOS in an established uptrend. No longs while structure is bearish.
  2. Context — check the trend table. If the higher rows are  Down , you are counter-trend: take it smaller or skip it.
  3. Liquidity first — the best longs come after the downside is cleared. Wait for a  LIQUZ  print below, or for the  SwL  rail to be taken and rejected. Buying before the sweep is buying into someone else's stop hunt.
  4. Location — price should be at or below the 0.5 of the current structure leg. Below the 0.618 is better. Buying into premium is the single most common way to lose with this tool.
  5. Trigger — the ▲ BUY marker, or price returning into a bullish FVG / demand zone inside the discount area.
  6. Stop — use the plotted SL rail, or the low of the swept swing. Not the low of the entry candle.
  7. Targets — TP1 / TP2 / TP3 are already drawn. Structurally, the natural destinations are the  SwH  rail above and the nearest unfilled bearish FVG.

Short playbook

Mirror image. Bearish CHoCH or continuation BOS; trend table rows reading  Down ; a  LIQUZ  print above or the  SwH  rail swept and rejected; price at or above the 0.5 of the leg (premium); ▼ SELL trigger or a return into a bearish FVG / supply zone; stop above the swept swing; targets at  SwL  and the nearest unfilled bullish FVG.

Signals to skip

  • A BUY / SELL marker with no structure behind it. The marker is a SuperTrend flip. Without a CHoCH or a BOS in the same direction, it is a mean reversion inside a range — the lowest-quality version of the signal.
  • Longs in premium, shorts in discount. If price is above the 0.618 of the leg and you are looking to buy, you are late. Wait for the pullback or wait for the next leg.
  • Entries taken before the sweep. If the  SwH  /  SwL  rail is still untouched and sitting right above/below your entry, that liquidity will very likely be taken first. Let it happen, then trade the rejection.
  • Anything while the trend table is split three-and-three. That is a range. The structure module will keep printing CHoCH in both directions and chop you out.
  • A CHoCH printed on a single spike candle. Switch "Break with candle's body" on and it will not qualify — a body close through the level is a much harder filter than a wick.

Recommended settings

Style Timeframe Preset Sensitivity Notes
Intraday scalping M5 – M15 Signal Medium Set the trend table to M1/M5/M15/M30/H1/H4
Intraday swing M30 – H1 Signal or SMC Low Turn Supply/Demand on for zone-to-zone targets
Swing trading H4 – D1 SMC Low Add MTF S/R for the weekly picture
Pure chart reading any Clean — Structure and swings only

Works on any symbol and any timeframe — FX, metals, indices, crypto. Nothing in the calculation is instrument-specific.

Alerts

Four independent alert switches — liquidity sweep, Buy/Sell signal, FVG mitigation, and BOS / CHoCH — delivered as terminal popup, mobile push, email, or Telegram (bot token and channel id are inputs). Alerts fire on the closed bar.

Honest notes

  • Signals evaluate on bar close. Levels built from swing pivots need their right-hand lookback to complete before the pivot is confirmed — that is how pivots work, in every indicator that uses them, and it is why the swing rails appear a fixed number of bars after the actual high or low.
  • This is a toolkit, not a black box. The Buy/Sell arrows are a trigger inside a process. The value is in the structure, the swept liquidity and the discount/premium location — the checklist above is the product.
  • Object counts are bounded on every module, and the calculation window is configurable, so the indicator stays responsive on long histories.

Compatibility

  • MetaTrader 5 and MetaTrader 4 — feature-identical builds.
  • MT4 has no native gradient fills or coloured candles, so the Keltner ribbon is drawn as its eight rails and highlighted bars are drawn as coloured segments behind the candle. Everything else is the same.

Have a question about a setting or want a layout suggestion for your instrument? Send a message — happy to help.


Recommended products
NQX Session Range Breakout MT4 is a signal indicator for MetaTrader 4: breakout of the overnight range at the European open. Proprietary NQX logic that maps the quiet overnight range and signals the first decisive close beyond it in the European window. It draws the suggested entry, a short stop and long targets (3:1, 5:1, 10:1); you decide. What it draws on the chart - An arrow on the closed signal candle (it never repaints a closed signal). - The suggested entry, a short stop and a long sugges
Divergence Matrix Pro for MetaTrader 4 Divergence Matrix Pro is a confirmed multi-oscillator divergence indicator for MetaTrader 4. It detects regular and hidden divergence between price and selected oscillators, then presents the confirmed structure through divergence lines, pivot labels, action markers, an optional current-timeframe Matrix Panel and optional alerts. The indicator is an analysis and confirmation tool. It does not open or close trades, and the signal score is not a win rate or a
SL TP Indicator MT4 - PIP TradeBoxes is a visual trade planning tool that helps you clearly preview Stop Loss and Take Profit zones directly on your chart before entering a trade. Instead of estimating risk manually, this indicator displays clean SL and TP trade boxes, allowing you to instantly understand your risk-to-reward in real time. What this indicator does This tool is designed to help traders plan and visualize trades before execution, while also monitoring active trades with clear on-ch
Rainbow Price Visualizer v1.21 See where the market really breathes. Turns your MT4 chart into an ultra-precise heatmap that highlights price zones favored by big players. Why it matters 300 price levels at 0.2‑pip resolution — microscopic detail. 8 visual themes (Rainbow, Fire, Ocean…) for instant readibility. Smart opacity: low noise fades, real zones pop. Lightweight rendering with automatic cleanup. Fully customizable: saturation, opacity, resolution, history depth. Bands project into the f

QCL Dynamic RSI Zones — MetaTrader 4 QCL Dynamic RSI Zones combines a smoothed RSI signal with adaptive boundaries to help you assess momentum relative to recent market conditions. Instead of relying on fixed overbought and oversold levels, the indicator adjusts its zones using recent RSI behavior. A dynamic balance line, a color-changing signal, and excursion columns display momentum conditions in a separate chart window. Key Features Adaptive boundaries: Upper and lower zones respond to recent
FREE
The Average Directional Index(ADX) Multicurrency Scanner MT4 is an advanced trading indicator designed to analyze multiple currency pairs simultaneously. It benefits traders looking to enhance their decision-making process by providing real-time signals based on the Average Directional Index, allowing for efficient market trend analysis. This tool streamlines the trading experience by simplifying the identification of trend strength and directional movement, making it an essential asset for trad
The band on nearly every channel indicator you can download is sized by an ATR, while the line running down the middle of it comes from something else entirely. Two filters, two different lags, stapled together. The join is where the false signals live. This one runs the true range through the same Gaussian filter as the price, at the same pole count and the same period. The band and the centre line turn on the same delay, because they are the same filter fed different data. Where the usual vers
SimpleProb
Augusto Martins Lopes
SimpleProb: Your New Ally in the Financial Market! Description Are you tired of complicated indicators that confuse more than they help? SimpleProb is here to bring simplicity and efficiency to your trading experience on MetaTrader 4 ! SimpleProb is a technical analysis indicator designed for traders who seek clarity and precision in their buying and selling decisions. It calculates the probabilities of upward ( CALL ) and downward ( PUT ) movements based on the last 14 periods, providing clear
Nice Trade Point
Muhammed Emin Ugur
This    Nice Trade Point     indicator is designed for signal trading. This indicator generates trend signals. It uses many algorithms and indicators to generate this signal. It tries to generate a signal from the points with the highest trend potential. This indicator is a complete trading product. This indicator does not need any additional indicators. The indicator certainly does not repaint. The point at which the signal is given does not change.     Features and Suggestions Time Frame
QCL Clouds MT4
Ahmadreza Najafi
QCL Clouds for MetaTrader 4 is an adaptive market-regime indicator designed to display trend direction, momentum transitions, and dynamic price zones in a clean and practical format. The indicator combines its internal calculations into color-changing signal-line segments, crossover dots, and a projected market cloud. The simplified presentation helps traders identify directional changes without placing multiple overlapping lines on the chart. HOW TO READ QCL CLOUDS • Blue Signal Line Indicates
Great Indicator
Ruben David Santana Rodriguez
Les presento un indicador que funciona como estrategia por si solo , trabaja muy bien en periodos de 4 horas pero puedes aplicarlo a cualquier timeframe , las señales son muy faciles de interpretar , en momento en que la linea naranja pasa hacia arriba las media azul y roja , se entra en largos , la operativa se mantiene abierta hasta que la linea naranja cruce la media mas cercana ya sea la azul o la roja , si la operacion era long y la linea azul cruza hacia arriba la linea roja y la naranja c
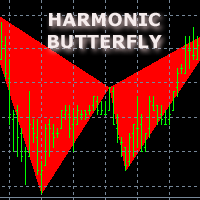
The indicator detects and displays М. Gartley's Butterfly pattern. The pattern is plotted by the extreme values of the ZigZag indicator (included in the resources, no need to install). After detecting the pattern, the indicator notifies of that by the pop-up window, a mobile notification and an email. The pattern and wave parameters are displayed on the screenshots. The default parameters are used for demonstration purposes only in order to increase the amount of detected patterns. Parameters z
Ichimoku Strength Meter MT4   is a professional multi-timeframe indicator for MetaTrader 5 that combines currency strength, pair recommendations, Ichimoku trend direction and moving average bias in a clear dashboard. The indicator analyzes the 8 most important currencies: USD, EUR, GBP, JPY, CHF, AUD, CAD and NZD From this, all 28 major currency pairs are automatically calculated and evaluated according to strength, trend direction and signal quality. Main functions Multi-timeframe currency stre
Crypto_Forex   Indicator   Accumulation Bar   Pattern for MT4.  No repaint, No delay. Indicator  " Accumulation Bar "  is very powerful   breakout-focused indicator   for Price Action trading. Indicator detects  price accumulation in narrow area   during 1 bar and shows: Breakout direction, Pending order and SL locations. Bullish  Accumulation Bar - Blue arrow signal on chart (see pictures). Bearish  Accumulation Bar - Red arrow signal on chart (see pictures). High R/R ratio (reward/risk). I ndi
Multi Indicators Screener is a compact multi-timeframe + multi-indicator dashboard for MetaTrader 4 that helps you instantly see the current market direction, confidence level, and volatility across selected timeframes. What you get on the chart NOW: BUY / SELL / WAIT with confidence % (updates in real time) Best Entry TF (timeframe with the strongest confidence for the current direction) Matrix screener : up to 10 indicators × multiple timeframes (signals per cell) TF Verdict row: aggregated di
The main idea of this indicator is rates analysis and prediction by Fourier transform. Indicator decomposes exchange rates into main harmonics and calculates their product in future. You may use the indicator as a standalone product, but for better prediction accuracy there is another related indicator - FreqoMaster - which uses FreqoMeterForecast as a backend engine and combines several instances of FreqoMeterForecast for different frequency bands. Parameters: iPeriod - number of bars in the ma
PW Oscillator
Svyatoslav Kucher
5 (1)
PW Oscillator   - индикатор предназначенный для поиска локальных экстремумов, определения текущей тенденции. В расчетах индикатора используется авторская методика. С помощью индикатора можно определять места возможного разворота цены желательно в направлении тенденции, но также с достаточной точностью и против нее. Также с помощью индикатора можно определять текущую тенденцию. Индикатор подходит для любых валютных пар, но для адекватного отображения показания необходимо, чтобы было достаточно ис
RelicusRoad Multi Timeframe Trendbar is a multi-timeframe trend indicator for MetaTrader 4 and MetaTrader 5 that shows an Uptrend, Neutral or Downtrend state for nine timeframes, M1 to MN1, as a row of colored dots in the chart corner. Each timeframe gets one dot with its name above it, in the lower-right corner of the chart. The color tells you the state, so you can see which timeframes agree without switching charts. How it works For each timeframe, the indicator compares two standard tools on
FREE
The most effective signals generated by Ichimoku strategies. Ichimoku Trade Alarm is a supplement for Ichimoku Trade Panel and it shows the signals that Expert Advisor reacts to. Visualization of signals:  Price / Kijun sen cross - the candle body must be between Min_Candlestick_Body and Max_Candlestick_Body. The candle must close above / below Kijun sen, minimum in 1/3 of its body. Open candle must be located above / below Kijun sen. Chinkou span must be under the price of 26 periods in advanc
The indicator detects and displays Shark harmonic pattern (see the screenshot). The pattern is plotted by the extreme values of the ZigZag indicator (included in the resources, no need to install). After detecting the pattern, the indicator notifies of that by a pop-up window, a mobile notification and an email. The indicator highlights the process of the pattern formation and not just the complete pattern. In the former case, it is displayed in the contour triangles. After the pattern is comple
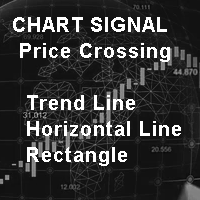
Signal Indicator when price is crossing  Trend Lines Horizontal Lines Rectangles Works on all timeframes and with all instruments. Multiple notification types Arrows on Chart Alert box Journal Log File Log Specific Sound Email Notification (must be configured in Terminal - please review MT4 docs) Push Notification   (must be configured in Terminal - please review MT4 docs) Draw your trend lines, horizontal lines or rectangles onto your chart. Select an object and bring up its properties and type
Complete SMC/ICT Indicator MT5 — Smart Money Concepts Tool The Complete SMC/ICT Indicator is a standalone Smart Money Concepts analysis tool that runs directly on the chart window. It provides institutional‑grade detection of market structures, imbalances, and liquidity zones, with full customization and alerts. Features The indicator detects ten core SMC elements: swing highs and lows, fair value gaps, order blocks, breaks of structure, changes of character, market structure shifts, equal hig
MACD Max
John Louis Fernando Diamante
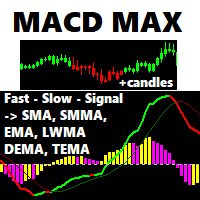
A flexible 2-Line MACD indicator The default MACD indicator inside MT4, limits you to using the MACD with a fast-EMA, slow-EMA, and signal-SMA. This MACD indicator allows you to set your own MA-Method choices for these 3 components, separately! You can select from SMA-EMA-SMMA-LWMA-DEMA-TEMA, and can even use a separate method for each 3 fast-slow-signal periods. On-chart colored candles, with drawing condition types is included, with a show/hide button too. Features - MA Methods: SMA, EMA, SMM
VALUE EDITION LIMITED   is an advanced technical indicator, developed for traders seeking clarity, precision, and speed in market analysis. Compatible with MetaTrader 4 and 5, it integrates smart overbought/oversold zones, dynamic price channels, normalized candlestick analysis, and real-time alerts, providing reliable support for trading any asset or time frame. Key Features Smart Trading Zones:   Automatic identification of overbought and oversold regions, with configurable maximum, average,
Shield Zone
Thushara Dissanayake
The   Shield Zone   indicator is a   daily trading tool   designed to highlight key   take-profit levels   derived from two   range periods   calculated on the   D1 timeframe . By automatically identifying the day's   upside resistance zones   and   downside support zones , this indicator provides traders with a clear visual framework of where price is likely to encounter barriers or find daily targets. The indicator draws these zones as   filled rectangles , replaying historical zones for the n
The Sextet
Naim El Hajj
4 (3)
Overview The Sextet is an MT4 trend-alignment indicator based on a sequence of six moving-average levels. Each level is calculated from the previous one, creating a layered view of trend structure. The indicator marks conditions where the moving-average levels align in order, which can help traders observe trend direction and trend organization more clearly. Key Features Displays six moving-average levels. Uses a layered moving-average sequence. Helps visualize trend alignment and directional st
FREE
Auto Fibo Pro m
DMITRII GRIDASOV
"Auto FIBO Pro"   Crypto_Forex  indicator  - is great auxiliary tool in trading! Indicator automatically calculate and place on chart Fibo levels and local trend lines (red color). Fibonacci levels indicate key areas where price can reverse. Most important levels are 23.6%, 38.2%, 50% and 61.8%. You can use it   for reversal scalping  or for zone grid trading. There are plenty of opportunities to  improve your current system using Auto FIBO Pro indicator as well. It has Info Spread Swap Displa
Plotter is an indicator that was created during the ICT mentorship to make charting quick, easy and fun for everybody. Assign a function to any hotkey in indicator settings or use the default keys to perform smart actions that usually takes a lot of time to perform. Click on any bar, press OHLCMBVPOKJH to plot objects, color them with keys 0-9 or modify them with keys ERAZ and much much more. Indicator settings are described below. CHART SETTINGS gmt_offset auto -23 - 23 daylightsavings= set dst
Dynamic Gap Engine
Martin Dennis Coman
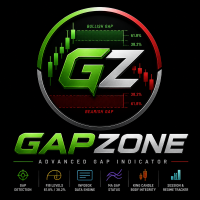
GapZone Pro – Dynamic Gap Trading Engine for MT4 The Gap That Evolves with the Market Most gap indicators detect a gap once, draw a box, and never change it again. GapZone Pro is different. Its proprietary Dynamic Gap Engine continuously recalculates the active market gap as price evolves. As the size of the gap expands or contracts, every Fibonacci level, retracement zone, and distance calculation updates automatically in real time. Instead of trading yesterday's gap, you're trading the marke
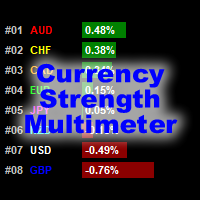
VIEW THE CURRENCY STRENGTH AND PAIR STRENGTH FOR "X" BARS IN A GIVEN TIMEFRAME. The Currency Strength Multimeter indicator shows the strength, direction and rank of each of the following currencies: AUD CAD CHF EUR GBP JPY NZD USD Furthermore, it also shows the strength, direction and rank of each of the following currency pairs: AUDCAD AUDCHF AUDJPY AUDNZD AUDUSD CADCHF CADJPY CHFJPY EURAUD EURCAD EURCHF EURGBP EURJPY EURNZD EURUSD GBPAUD GBPCAD GBPCHF GBPJPY GBPNZD GBPUSD NZDCAD NZDCHF NZDJPY
FREE
Buyers of this product also purchase
Trend SniperX MT4
Sarvarbek Abduvoxobov
5 (5)
Trend Sniper X is a multi-timeframe trend-following indicator for MetaTrader 5 that helps traders identify trend direction and potential reversal points with clarity and precision. For MT5: https://www.mql5.com/en/market/product/181101 Price Information: The current price is promotional and is subject to change as upcoming updates and new features are released. Code2Profit Channel Master the Market with Multi-Timeframe Analysis! How to Maximize Your Win Rate with Trend Sniper X: Key Rules & Sess
Currency Strength Wizard is a very powerful indicator that provides you with all-in-one solution for successful trading. The indicator calculates the power of this or that forex pair using the data of all currencies on multiple time frames. This data is represented in a form of easy to use currency index and currency power lines which you can use to see the power of this or that currency. All you need is attach the indicator to the chart you want to trade and the indicator will show you real str
Scalper Vault
Oleg Rodin
5 (40)
Scalper Vault is a powerful, fully-equipped trading system designed for traders who want to achieve consistency in intraday trading . This high-precision indicator serves as a complete, standalone trading system that delivers institutional-grade analysis for both Forex and Binary Options traders. PLEASE CONTACT ME AFTER PURCHASE TO GET MY TRADING TIPS PLUS A GREAT BONUS! By eliminating the guesswork and complex manual analysis, Scalper Vault allows you to focus purely on execution using easy t
PRO Renko System
Oleg Rodin
5 (31)
PRO Renko System is a highly accurate trading system specially designed for trading RENKO charts. The ARROWS and Trend Indicators DO NOT REPAINT! The system effectively neutralizes so called market noise giving you access to accurate reversal signals. The indicator is very easy to use and has only one parameter responsible for signal generation. You can easily adapt the tool to any trading instrument of your choice and the size of the renko bar. I am always ready to provide extra support to help
Trading Special – 30% OFF Best Solution for any Newbie or Expert Trader! This dashboard software is working on 28 currency pairs plus one. It is based on 2 of our main indicators (Advanced Currency Strength 28 and Advanced Currency Impulse). It gives a great overview of the entire Forex market plus Gold or 1 indices. It shows Advanced Currency Strength values, currency speed of movement and signals for 28 Forex pairs in all (9) timeframes. Imagine how your trading will improve when you can watch
PZ Turning Points MT4
PZ TRADING SLU
1 (1)
Identify key turning points with reliable fractal analysis This indicator examines the price structure of fractals of different periods to determine possible reversal points in the market, providing timing to positional traders that already have a fundamental or technical valuation model. Unlike its younger brother, Reversal Fractals , this indicator won't miss reversals because of the period selected, and will find reversal fractals on a zig-zag fashion, ignoring those reversals which do not
Quant Direction
Georgios Kalomoiropoulos
Quant Direction is a 3 dimensional market analysis tool. It provides a purely objective, algorithmic view of the market by calculating exact percentage-based biases across multiple dimensions simultaneously. Developed utilizing advanced AI modeling tools and subjected to thorough testing, this algorithm is engineered to read the market with unique precision. It can analyze any currency pair or financial instrument available on your platform.  Quant Direction is the ideal tool whether you are a S
Trend Lines PRO
Roman Podpora
5 (2)
TREND LINES PRO    helps understand where the market is truly changing direction. The indicator shows real trend reversals and points where major players re-enter. You see   BOS lines   Trend changes and key levels on higher timeframes — without complex settings or unnecessary noise. Signals don't repaint and remain on the chart after the bar closes. VERSION MT 5     -     Reveals its maximum potential when paired with the   RFI LEVELS PRO  indicator What the indicator shows: Real shifts   tren
SR Liquidity
Oleg Rodin
5 (2)
SR Liquidity is a trading indicator designed to reveal the hidden zones where market liquidity concentrates and price reacts most strongly. These special liquidity areas act as powerful support and resistance levels, giving you a clear map of where the market is most likely to reverse. Instead of drawing ordinary Support/Resistance lines, SR Liquidity analyzes real price behavior to detect the zones where buying and selling pressure accumulate. These are actually the pools of liquidity that driv
AW Prime Oscillator
AW Trading Software Limited
5 (1)
A combination of two oscillators. The first one displays the entry points, the second shows the current trend . The indicator can display oscillator signals by arrows in two modes, all fast oscillator signals or signals only in the direction of the current trend. It has a multi-timeframe panel and three types of signal notifications. Benefits: Suitable for day and scalping trading Trend filtering Simple and sensitive setup Multi-timeframe panel Suitable for integration into an advisor. Works on
M1 Sniper
Oleg Rodin
4.97 (30)
M1 SNIPER  is an easy to use trading indicator system. It is an arrow indicator which is designed for M1 time frame. The indicator can be used as a standalone system for scalping on M1 time frame and it can be used as a part of your existing trading system. Though this trading system was designed specifically for short-term trading, it still can be helpful for all traders. This trading system can be used with any forex pair and time frame, though lower time frames are recommended from M1 up to M
SIO Oscillator: Self-Optimizing Semivariance Imbalance Oscillator Buy the indicator and get the Expert Advisor based on it for FREE. Most oscillators treat all price movement the same. SIO separates upside and downside market pressure and measures the imbalance between them, showing which side is really in control: buyers or sellers. When the imbalance reaches an extreme, SIO prints a clear signal with entry, Stop Loss and Take Profit levels. What makes SIO different is that it doesn’t rely on f
Neo Wave PRO
Nikolay Raykov
5 (1)
Price & Time Market Structure Indicator A professional market structure tool that analyzes waves through both price and time — not price alone. Main Description NeoWave PRO is a professional market structure indicator for MetaTrader 4 designed for traders who want to move beyond traditional one-dimensional wave tools such as ZigZag, swing indicators, and basic high/low systems. Most wave indicators analyze only one thing: Price. But a real market wave is not only a price movement. A true wave de
Gann Time Clusters
Martin Eshleman
2.5 (2)
Gann Time Clusters Indicator This indicator is based on W. D. Gann's Square of 9 method for the time axis. It uses past market reversal points and applies the mathematical formula for Gann's Square of 9 and then makes projections into the future. A date/time where future projections line up is called a 'time cluster'. These time clusters are drawn as vertical lines on the right side of the chart where the market has not advanced to yet. A time cluster will result in a market reversal point (ex.
Forex Breath System is a trend based trading system which can be used with any market. You can use this system with currencies, metals, commodities, indices, crypto and even stocks. It can also be used with any time frame. The system is universal. It shows trend and provides arrow signals with the trend. The indicator can also provide you with a special type of alerts when the signals appear in the direction of the trend which makes trend trading an easy task. The indicator is very easy to use a
Trading Special – 40% OFF Best Solution for any Newbie or Expert Trader! This indicator is a unique, high quality and affordable trading tool because we have incorporated a number of proprietary features and a secret formula. With only ONE chart it gives Alerts for all 28 currency pairs. Imagine how your trading will improve because you are able to pinpoint the exact trigger point of a new trend or scalping opportunity! Built on new underlying algorithms it makes it even easier to identify and c
Super Signal – Skyblade Edition Professional No-Repaint / No-Lag Trend Signal System with Exceptional Win Rate | For MT4 / MT5 It works best on lower timeframes, such as 1-minute, 5-minute, and 15-minute charts. Core Features: Super Signal – Skyblade Edition is a smart signal system designed specifically for trend trading. It applies a multi-layered confirmation mechanism to detect only strong, directional moves supported by real momentum. This system does not attempt to predict tops or bottoms
Gann Made Easy
Oleg Rodin
4.84 (174)
Gann Made Easy is a professional and easy to use Forex trading system which is based on the best principles of trading using the theory of W.D. Gann. The indicator provides accurate BUY and SELL signals including Stop Loss and Take Profit levels. You can trade even on the go using PUSH notifications. PLEASE CONTACT ME AFTER PURCHASE TO GET TRADING  INSTRUCTIONS   AND GREAT EXTRA INDICATORS  FOR FREE! Probably you already heard about the Gann trading methods before. Usually the Gann theory is a
Elliott Live is a MetaTrader 5 indicator that automatically labels Elliott waves on historical bars and on the live bar. Completed waves are drawn with solid lines; the wave that is still forming is drawn dotted with a question mark (for example, "3?"), together with Fibonacci targets and an invalidation level. MT5-version:  https://www.mql5.com/en/market/product/200604 How it works The indicator first builds swings (ZigZag). A reversal is registered when price pulls back from an extreme by at l
Gold Channel is a volatility-based indicator, developed with a specific timing algorithm for the XAUUSD pair, which consists of finding possible corrections in the market. This indicator shows two outer lines, an inner line (retracement line) and an arrow sign, where the theory of the channel is to help identify overbought and oversold conditions in the market. The market price will generally fall between the boundaries of the channel. If prices touch or move outside the channel it is a tradi
Liked the logic of this tool? Explore the full ecosystem of professional indicators and utilities created by a trader for traders: All products by the author on MQL5 Market: https://www.mql5.com/en/users/musa1994/seller Details and trading philosophy: https://developer-mql4-mql5.netlify.app/ Professional Delta Volume MTF v2.0 is a professional indicator for MetaTrader 4 that shows the difference between buy and sell volume (Delta Volume) and Cumulative Delta. Version 2.0 introduces f
Non repaint MT4
Yan Zhen Du
5 (1)
This is a professional chart indicator designed for traders focused on stability and clear price action. It helps filter market noise and provides clear visual entry and exit zones for your trading decisions. Core Features: Strictly Non-Repainting: The system is built with strict non-repaint logic. What you see on the chart is the true historical performance. Confirmed Signals: Signals are triggered and confirmed only after the candle closes . Once a trading arrow appears on a closed candle, it
Advanced Supply Demand
Bernhard Schweigert
4.91 (302)
Trading Special – 30% OFF Best Solution for any Newbie or Expert Trader! This indicator is a unique, high quality and affordable trading tool because we have incorporated a number of proprietary features and a new formula. With this update, you will be able to show double timeframe zones. You will not only be able to show a higher TF but to show both, the chart TF, PLUS the higher TF: SHOWING NESTED ZONES. All Supply Demand traders will love it. :) Important Information Revealed Maximize the pot
PipFinite Trend PRO
Karlo Wilson Vendiola
4.88 (2252)
Breakthrough Solution For Trend Trading And Filtering With All Important Features Built Inside One Tool! Trend PRO's smart algorithm detects the trend, filters out market noise and gives entry signals with exit levels. The new features with enhanced rules for statistical calculation improved the overall performance of this indicator. Important Information Revealed Maximize the potential of Trend Pro, please visit www.mql5.com/en/blogs/post/713938 The Powerful Expert Advisor Version Automatin
Top Bottom Tracker is an indicator based on sophisticated algorithms that analyse the market trend and can detect the highs and lows of the trend / MT5 version . The price will progressively increase until it reaches 500$. Next price --> $99 Features No repainting This indicator does not change its values when new data arrives Trading pairs All forex pairs Timeframe     All timeframes Parameters ==== Indicator configuration ==== Configuration parameter // 40 (The higher the value, the
Neuro Poseidon MT4
Daria Rezueva
4.74 (46)
Neuro Poseidon is a new indicator by Daria Rezueva. It combines precise trading signals with adaptive TP/SL levels - creating best possible trades as a result! Message me and get  Neuro Poseidon Assistant  as a gift to automize your trading process! What makes it stand out? 1. Proven profitability on all assets and timeframes 2. Only confirmed BUY and SELL signals present on the chart 3. Adaptive TP & SL levels generated by the software for each trade 4. Easy to understand - suitable for all
Trading Special –40% OFF Best Solution for any Newbie or Expert Trader! This Indicator is a unique, high quality and affordable trading tool because we have incorporated a number of proprietary features and a new formula. With only ONE chart you can read Currency Strength for 28 Forex pairs! Imagine how your trading will improve because you are able to pinpoint the exact trigger point of a new trend or scalping opportunity? User manual: click here Looking for the MT5 version? Click here: https:/
Currency Strength Exotics
Bernhard Schweigert
4.88 (33)
CURRENTLY 20% OFF ! Best Solution for any Newbie or Expert Trader! This Indicator is specialized to show currency strength for any symbols like Exotic Pairs Commodities, Indexes or Futures. Is first of its kind, any symbol can be added to the 9th line to show true currency strength of Gold, Silver, Oil, DAX, US30, MXN, TRY, CNH etc. This is a unique, high quality and affordable trading tool because we have incorporated a number of proprietary features and a new formula. Imagine how your trading
Scalper Inside PRO
Alexey Minkov
4.74 (69)
Scalper Inside PRO helps you read the intraday trend and plan a trade before you enter the market. It is built around three exclusive strategies for a sharper read of the market. The moment a signal appears, the indicator evaluates market direction and calculates the key levels, so you see the potential entry, the expected stop-loss and several profit-taking levels in advance. Detailed performance statistics show how different instruments and strategies performed in history and help you pick ass
CRT Multi-Timeframe Market Structure & Liquidity Sweep Indicator Non-Repainting | Multi-Asset | MT5 Version Available MT5 Version:   https://www.mql5.com/en/market/product/162075 Full User Guide — explains what each feature does and why:   https://www.mql5.com/en/blogs/post/767525 Quick Start User Guide  — explains how to configure and in what order:  https://www.mql5.com/en/blogs/post/767540 Indicator Overview CRT Ghost Candle HTF Fractal is a complete institutional-grade market structure too
More from author
This indicator presents an alternative approach to identify Market Structure. The logic used is derived from learning material created by   DaveTeaches (on X) Upgrade v1.10: add option to put protected high/low value to buffer (figure 11, 12) When quantifying Market Structure, it is common to use fractal highs and lows to identify "significant" swing pivots. When price closes through these pivots, we may identify a Market Structure Shift (MSS) for reversals or a Break of Structure (BOS) for co
This is a Forex Scalping Trading Sytem based on the Bollinger Bands.  Pairs:Major Time frame: 1M or higher. Spread max:0,0001.  Indicators (just suggestion) Bollinger bands (20, 2); ADX (14 period); RSI   (7 period ). Y ou should only trade this system between 2am to 5am EST, 8am to 12am EST and 7.30pm to 10pm EST. Do not scalp 30 minutes before a orange or red news  report and not for a hour afterwards.   Setup: is for price to move above the lower or lower Bollinger Bands, RSI raise above the
FREE
This script automatically calculates and updates ICT's daily IPDA look back time intervals and their respective discount / equilibrium / premium, so you don't have to :) IPDA stands for Interbank Price Delivery Algorithm. Said algorithm appears to be referencing the past 20, 40, and 60 days intervals as points of reference to define ranges and related PD arrays. Intraday traders can find most value in the 20 Day Look Back box, by observing imbalances and points of interest. Longer term traders c
This is addition of  Effective SV squeeze momentum  that add bolliger band and Keltner channel to chart window.  Squeeze momentum introduced by “John Carter”, the squeeze indicator for MT5 represents a volatility-based tool. Regardless, we can also consider the squeeze indicator as a momentum indicator, as many traders use it to identify the direction and strength of price moves. In fact, the Tradingview  squeeze indicator shows when a financial instrument is willing to change from a trending ma
FREE
All about Smart Money Concepts Strategy: Market struture: internal or swing BOS, CHoCH; Orderblock; Liquity equal; Fair Value Gap with Consequent encroachment, Balanced price range; Level with Previous month, week, day level or in day level (PMH, PWH, PDH, HOD); BuySell Stops Liquidity (BSL, SSL); Liquidity Void Long Wicks; Premium and Discount; Candle pattern ... "Smart Money Concepts" ( SMC ) is a fairly new yet widely used term amongst price action traders looking to more accurately navigate
The indicator   returning pivot point based trendlines with highlighted breakouts . Trendline caculated by pivot point and other clue are ATR, Stdev.   The indicator also includes integrated alerts for  trendlines  breakouts   and foward message to Telegram channel or group if you want. Settings ·            Lookback bar: Default 200 is number of bar caculate when init indicator. ·            Length:  Pivot points  period ·            Slope Calculation Method: Determines how this lope is calcula
This all-in-one indicator displays real-time market structure (internal & swing BOS / CHoCH), order blocks, premium & discount zones, equal highs & lows, and much more...allowing traders to automatically mark up their charts with widely used price action methodologies. Following the release of our Fair Value Gap script, we received numerous requests from our community to release more features in the same category. //------------------------------------// Version 1.x has missing functions + PDAr
The Breaker Blocks with Signals indicator aims to highlight a complete methodology based on breaker blocks. Breakout signals between the price and breaker blocks are highlighted and premium/discount swing levels are included to provide potential take profit/stop loss levels. This script also includes alerts for each signal highlighted.   SETTINGS   Breaker Blocks Length: Sensitivity of the detected swings used to construct breaker blocks. Higher values will return longer term break
The ICT Concepts indicator regroups core concepts highlighted by trader and educator "The Inner Circle Trader" (ICT) into an all-in-one toolkit. Features include Market Structure (MSS & BOS), Order Blocks, Imbalances, Buyside/Sellside Liquidity, Displacements, ICT Killzones, and New Week/Day Opening Gaps. It’s one kind of Smart money concepts.   USAGE:   Please read this   document  !      DETAILS Market Structure Market structure labels are constructed from price breaking a prior extreme
The FollowLine indicator is a trend following indicator. The blue/red lines are activated when the price closes above the upper Bollinger band or below the lower one. Once the trigger of the trend direction is made, the FollowLine will be placed at High or Low (depending of the trend). An ATR filter can be selected to place the line at a more distance level than the normal mode settled at candles Highs/Lows. Some features: + Trend detech + Reversal signal + Alert teminar / mobile app
The ICT Silver Bullet indicator is inspired from the lectures of "The Inner Circle Trader" (ICT) and highlights the Silver Bullet (SB) window which is a specific 1-hour interval where a Fair Value Gap (FVG) pattern can be formed. A detail document about ICT Silver Bullet here . There are 3 different Silver Bullet windows (New York local time): The London Open Silver Bullet (3 AM — 4 AM ~ 03:00 — 04:00) The AM Session Silver Bullet (10 AM — 11 AM ~ 10:00 — 11:00) The PM Session Silver Bullet (2
Sessions by Lux
Minh Truong Pham
This indicator shows when user set sessions are active and returns various tools + metrics using the closing price within active sessions as an input. Users have the option to change up to 4 session times. The indicator will increasingly lack accuracy when the chart timeframe is higher than 1 hour. Settings Sessions Enable Session: Allows to enable or disable all associated elements with a specific user set session. Session Time: Opening and closing times of the user set session in the  
The liquidity swings indicator highlights swing areas with existent trading activity. The number of times price revisited a swing area is highlighted by a zone delimiting the swing areas. Additionally, the accumulated volume within swing areas is highlighted by labels on the chart. An option to filter out swing areas with volume/counts not reaching a user-set threshold is also included. This indicator by its very nature is not real-time and is meant for descriptive analysis alongside other com
The SuperTrend AI indicator is a novel take on bridging the gap between the K-means clustering machine learning method & technical indicators. In this case, we apply K-Means clustering to the famous SuperTrend indicator.   USAGE Users can interpret the SuperTrend AI trailing stop similarly to the regular SuperTrend indicator. Using higher minimum/maximum factors will return longer-term signals. (image 1) The displayed performance metrics displayed on each signal allow for a deeper interpretat
OVERVIEW A Lorentzian Distance Classifier (LDC) is a Machine Learning classification algorithm capable of categorizing historical data from a multi-dimensional feature space. This indicator demonstrates how Lorentzian Classification can also be used to predict the direction of future price movements when used as the distance metric for a novel implementation of an Approximate Nearest Neighbors (ANN) algorithm. This indicator provide signal as buffer, so very easy for create EA from this indi
An Implied Fair Value Gap (IFVG) is a three candles imbalance formation conceptualized by ICT that is based on detecting a larger candle body & then measuring the average between the two adjacent candle shadows. This indicator automatically detects this imbalance formation on your charts and can be extended by a user set number of bars. The IFVG average can also be extended until a new respective IFVG is detected, serving as a support/resistance line. Alerts for the detection of bullish/be
Consolidation is when price is moving inside a clear trading range. When prices are consolidated it shows the market maker placing orders on both sides of the market. This is mainly due to manipulate the un informed money. This indicator automatically identifies consolidation zones and plots them on the chart. The method of determining consolidation zones is based on pivot points and ATR, ensuring precise identification. The indicator also sends alert notifications to users when a new consolida
Wyckoff sweep and order block detector I got tired of marking the same structure by hand every morning, so I wrote this. It looks for one thing only: the Wyckoff sequence that ends with a liquidity sweep and a pullback into the order block that started the move. When all the pieces line up, it draws them and tells you. That's the whole job. It doesn't predict, it doesn't score setups out of ten, and it won't tell you how much to risk. It marks structure that's already there and saves you the ey
Created by imjesstwoone and mickey1984, this trade model attempts to capture the expansion from the 10:00-14:00 EST 4h candle using just 3 simple steps. All of the information presented in this description has been outlined by its creators, all I did was translate it to MQL4. All core settings of the trade model may be edited so that users can test several variations, however this description will cover its default, intended behavior using NQ 5m as an example. Step 1 is to identify our Price Ra
The Buyside & Sellside Liquidity indicator aims to detect & highlight the first and arguably most important concept within the ICT trading methodology,   Liquidity   levels. SETTINGS Liquidity Levels Detection Length: Lookback period Margin: Sets margin/sensitivity for a liquidity level detection Liquidity Zones Buyside Liquidity Zones: Enables display of the buyside liquidity zones. Margin: Sets margin/sensitivity for the liquidity zone boundaries. Color: Color option for buysid
The   Liquidation Estimates (Real-Time)   experimental indicator attempts to highlight real-time long and short liquidations on all timeframes. Here with liquidations, we refer to the process of forcibly closing a trader's position in the market. By analyzing liquidation data, traders can gauge market sentiment, identify potential support and resistance levels, identify potential trend reversals, and make informed decisions about entry and exit points. USAGE (Img 1)    Liquidation refers
The   ICT Unicorn Model   indicator highlights the presence of "unicorn" patterns on the user's chart which is derived from the lectures of   "The Inner Circle Trader" (ICT) . Detected patterns are followed by targets with a distance controlled by the user.   USAGE (image 2) At its core, the ICT Unicorn Model relies on two popular concepts, Fair Value Gaps and Breaker Blocks. This combination highlights a future area of support/resistance. A   Bullish Unicorn Pattern   consists out of:
The Inversion Fair Value Gaps (IFVG) indicator is based on the inversion FVG concept by ICT and provides support and resistance zones based on mitigated Fair Value Gaps (FVGs). Image 1   USAGE Once mitigation of an FVG occurs, we detect the zone as an "Inverted FVG". This would now be looked upon for potential support or resistance. Mitigation occurs when the price closes above or below the FVG area in the opposite direction of its bias. (Image 2) Inverted Bullish FVGs Turn into Potenti
Overview The   Volume SuperTrend AI   is an advanced technical indicator used to predict trends in price movements by utilizing a combination of traditional SuperTrend calculation and AI techniques, particularly the k-nearest neighbors (KNN) algorithm. The Volume SuperTrend AI is designed to provide traders with insights into potential market trends, using both volume-weighted moving averages (VWMA) and the k-nearest neighbors (KNN) algorithm. By combining these approaches, the indicator
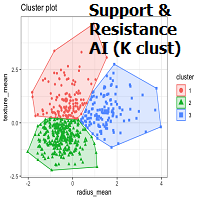
OVERVIEW K-means is a clustering algorithm commonly used in machine learning to group data points into distinct clusters based on their similarities. While K-means is not typically used directly for identifying support and resistance levels in financial markets, it can serve as a tool in a broader analysis approach. Support and resistance levels are price levels in financial markets where the price tends to react or reverse. Support is a level where the price tends to stop falling and m
Introducing the Reversal and Breakout Signals   This innovative tool is crafted to enhance your chart analysis by identifying potential reversal and breakout opportunities directly on your charts. It's designed with both novice and experienced traders in mind, providing intuitive visual cues for better decision-making. Let's dive into the key features and how it operates: ###   Key Features:   Dynamic Period Settings:   Customize the sensitivity of the indicator with user-def
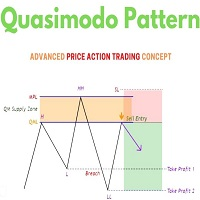
Introduction One of the patterns in "RTM" is the "QM" pattern, also known as "Quasimodo". Its name is derived from the appearance of "Hunchback of Notre-Dame" from Victor Hugo's novel. It is a type of "Head and Shoulders" pattern.   Formation Method   Upward Trend In an upward trend, the left shoulder is formed, and the price creates a new peak higher than the left shoulder peak . After a decline, it manages to break the previous low and move upward again. We expect the price to
MOST is applied on this RSI moving average with an extra default option added VAR/VIDYA (Variable Index Dynamic Moving Average) MOST added on RSI has a Moving Average of RSI and a trailing percent stop level of the Moving Average that can be adjusted by changing the length of the MA and %percent of the stop level. BUY SIGNAL when the Moving Average Line crosses above the MOST Line LONG CONDITION when the Moving Average is above the MOST SELL SIGNAL when Moving Average Line crosses below MOS
The indicator show Higher timeframe candles for ICT technical analisys Higher time frames reduce the 'noise' inherent in lower time frames, providing a clearer, more accurate picture of the market's movements. By examining higher time frames, you can better identify trends, reversals, and key areas of support and resistance. The Higher Time Frame Candles indicator overlays higher time frame data directly onto your current chart. You can easily specify the higher time frame candles you'd li
Introduction The Price Action, styled as the "Smart Money Concept" or "SMC," was introduced by Mr. David J. Crouch in 2000 and is one of the most modern technical styles in the financial world. In financial markets, Smart Money refers to capital controlled by major market players (central banks, funds, etc.), and these traders can accurately predict market trends and achieve the highest profits. In the "Smart Money" style, various types of "order blocks" can be traded. This indicator uses
Filter:
No reviews
Reply to review