AutoTrendlines
- Indicators
- Version: 2.0
Smart Fractal AutoTrendline Pro (MT4)
Overview
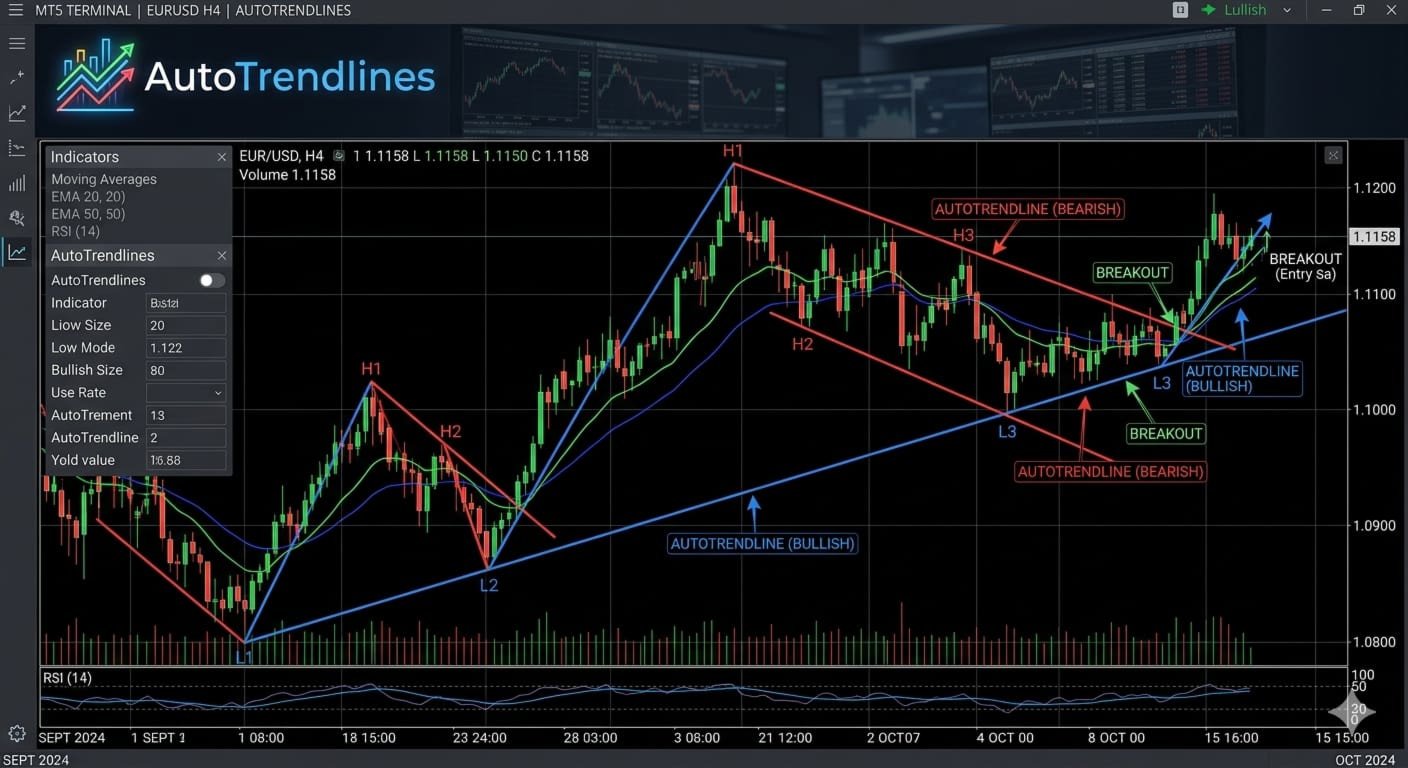
The AutoTrendline indicator is a dynamic technical analysis tool designed to automate the manual task of drawing support and resistance lines. By utilizing the mathematical precision of Bill Williams' Fractals, the indicator identifies significant market "swing points" and instantly projects trendlines across any asset class, including Forex, Crypto, and Stocks.
Key Features
-
Multi-Asset & Multi-Timeframe: Fully adaptive logic that recalibrates instantly when you switch between timeframes (from M1 to Monthly).
-
Fractal-Based Precision: Unlike standard zigzag indicators, this uses fractal peaks and troughs to ensure lines are anchored to mathematically confirmed price exhaustion points.
-
Real-Time Updates: The indicator monitors every new candle. As soon as a new fractal is confirmed, the trendlines shift to reflect the most current market structure.
-
Institutional Visualization: Automatically distinguishes between Resistance (Highs) and Support (Lows) using customizable color coding.
-
Projection Logic: Features a "Ray" function that extends lines into the future, allowing traders to anticipate potential breakout or bounce zones before price reaches them.
How It Enhances Your Trading
-
Eliminates Subjectivity: Removes the "human error" of drawing lines differently every day. The logic remains consistent and disciplined.
-
Saves Time: Instantly maps out the price corridor, allowing you to focus on trade execution rather than chart setup.
-
Breakout Detection: Perfect for identifying Ascending/Descending Triangles and Channels. When price breaks through a drawn line, it signals a potential shift in market momentum.
Technical Specifications
-
Anchor Points: Connects the two most recent confirmed Fractals (Upper/Lower).
-
Lookback Depth: Configurable scanning range to focus on either short-term scalping levels or long-term structural trends.
-
Resource Efficient: Optimized MQL4 code that ensures no lag on your MT4 terminal, even with multiple charts open.
Suggested User Guide / Tip
"For the best results, use this indicator on the H1 or H4 timeframes to identify major trend shifts. If you are a scalper, apply it to the M5 or M15 to catch intraday volatility channels. Always wait for a candle to close outside the line to confirm a breakout!"