LinearRegression Channel
- Utilities
- Version: 4.0

Linear Regression Channel v4.0 — Indicator for MetaTrader 5
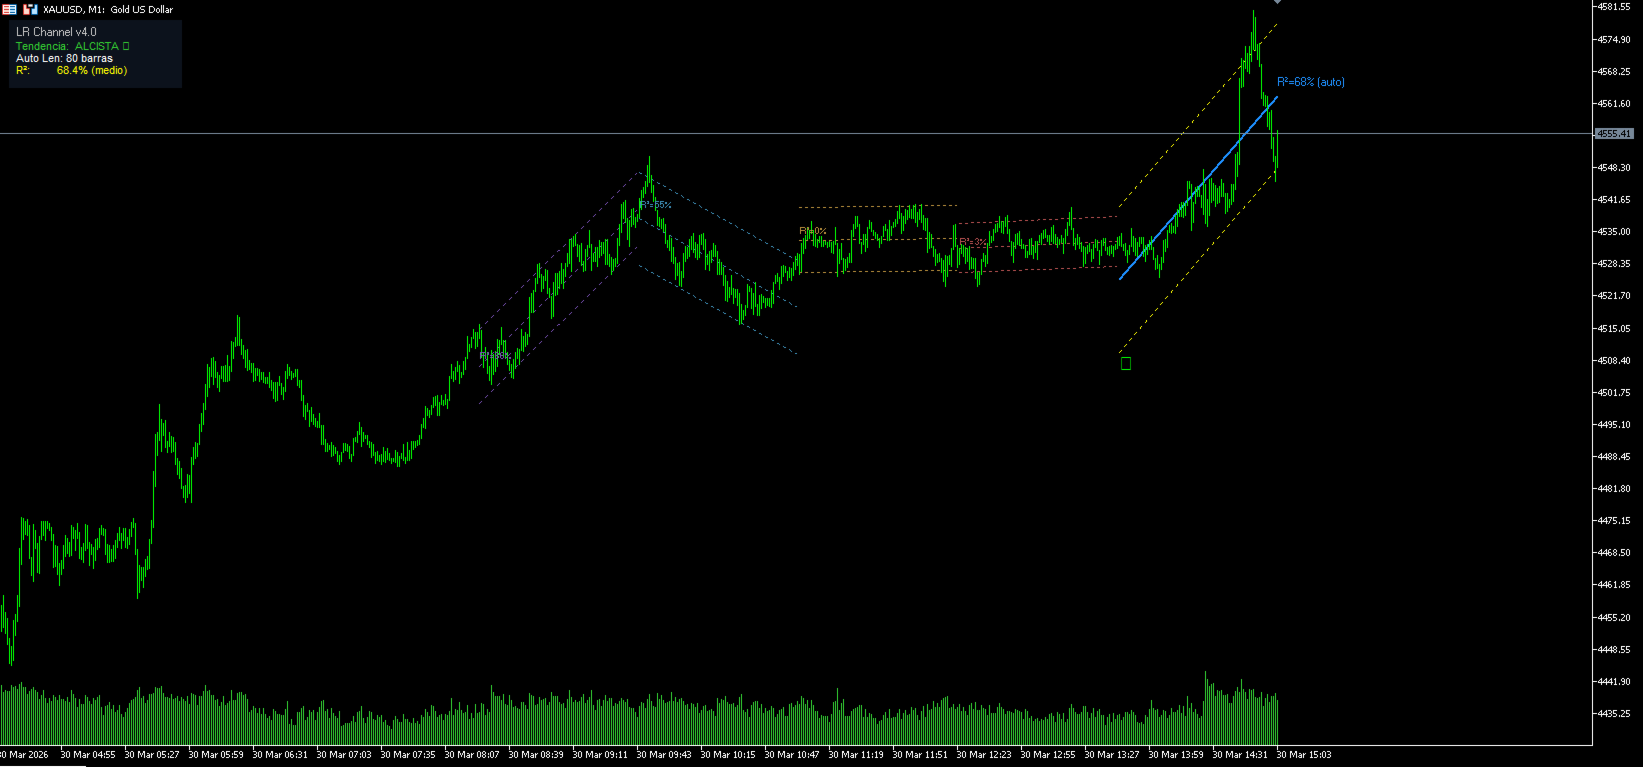
Linear Regression Channel v4.0 is an indicator that automatically calculates the optimal channel length using the R² coefficient, and draws a history of previous channels to visualize the evolution of price structure.
What is new in v4.0
Automatic length by maximum R². The indicator evaluates all lengths between the configured minimum and maximum, calculates the R² for each one, and selects the length that best fits the current price. The on-chart panel displays in real time the optimal length found, the R² of the current channel as a percentage, and the trend direction.
Configurable channel history. Draws previous channels going back N configurable bars. Each historical channel is independent, with adaptive standard deviation for the period it covers, an individually configurable color per channel (up to 5 historical channels), a label showing the R² of each historical channel, and dotted lines to distinguish them from the current channel. Channels do not overlap.
How the automatic length calculation works
On each new bar, the indicator tests lengths in configurable steps within the defined range, calculates the R² for each length, and draws the channel using the length that achieved the highest R². The channel reflects the most representative length for the current market structure at that moment.
How the history works
Each historical channel calculates its own linear regression and its own standard deviation for the period it covers. This allows the user to observe whether the current trend is a continuation of the previous one or represents a change in structure.
Main parameters
Main channel: InpAutoLength (enable automatic length by R²), InpLength (manual length if Auto is false), InpDeviation (standard deviation multiplier), InpExtend (extend channel to the right), InpShowFibo (show internal Fibonacci levels), InpShowBroken (highlight when channel is broken).
Automatic length: InpAutoMinLen (minimum length to evaluate, default 20), InpAutoMaxLen (maximum length to evaluate, default 300), InpAutoStep (step between lengths, default 5), InpShowR2Panel (show panel with R² and optimal length).
History: InpShowHistory (enable channel history), InpHistoryBars (bars back to search for channels), InpHistoryMax (maximum historical channels, 1 to 5), InpHistoryDev (deviation of historical bands), InpHColor1 to InpHColor5 (individual color per historical channel).
Suggested settings by timeframe
For short timeframes (M1/M5): InpAutoMinLen = 20, InpAutoMaxLen = 100, InpHistoryBars = 150, InpHistoryMax = 3.
For intermediate timeframes (M15/M30): InpAutoMinLen = 30, InpAutoMaxLen = 200, InpHistoryBars = 300, InpHistoryMax = 3.
For wider timeframes (H1/H4): InpAutoMinLen = 50, InpAutoMaxLen = 300, InpHistoryBars = 500, InpHistoryMax = 5.
Alerts
The indicator generates a popup alert and a push notification to the mobile device when the price breaks the upper or lower band of the channel. The alert includes the R² value of the channel at the moment of the breakout.