BKT Monday SMC
- Göstergeler
- Sürüm: 1.13
- Güncellendi: 22 Nisan 2026

BKT Monday
Arz ve talep bölgelerini, destek ve direnç seviyelerini, uyarlanabilir bir MA trend sinyalini ve entegre bir risk yönetimi panelini tek bir grafik katmanında birleştiren MetaTrader 5 için çok katmanlı bir teknik gösterge.
BKT Monday, üç tamamlayıcı analitik katman kullanarak yüksek olasılıklı işlem kurulumlarını belirlemeye yardımcı olmak için tasarlanmış MetaTrader 5 için bir grafik göstergesidir. Gösterge, swing pivotlarından arz ve talep bölgelerini otomatik olarak çizer, geçmiş fiyat kümelerinden destek ve direnç çizgileri oluşturur ve kullanıcının seçtiği üst zaman diliminde yapılandırılabilir bir hareketli ortalama geçişinden Long ve Short sinyal okları üretir. Her sinyal için giriş, stop loss ve üç take profit seviyesi doğrudan grafik üzerinde hesaplanır ve görüntülenir.
Genel Bakış
Gösterge, fiyat verilerini eş zamanlı olarak iki zaman diliminde işler. Ana grafik pivot tabanlı bölge tespitini sağlarken, yapılandırılabilir bir üst zaman dilimi trend sinyali hesaplamasına veri sağlar. Arz bölgeleri, onaylanmış swing yükseklerinde mevcut fiyatın üzerinde çizilir; talep bölgeleri onaylanmış swing düşüklerinin altında çizilir. Her bölge, mevcut piyasa oynaklığını yansıtmak için bir ATR çarpanı kullanılarak boyutlandırılır. Fiyat bir bölge sınırının ötesinde kapanırsa, bölge kaldırılır ve yapısal değişimi işaretlemek için bölge orta noktasına bir Break of Structure çizgisi çizilir.
Trend sinyali, seçilebilir üç hareketli ortalama türünden birini kullanır: ALMA, TEMA veya Hull MA. Üst zaman diliminin kapanış ve açılış serilerine uygulanan MA arasındaki geçiş, mevcut grafik çubuğunda Long veya Short oku tetikler. Sinyal, son çubukta yeniden çizim hassasiyetini azaltmak için yapılandırılabilir bir gecikme parametresi içerir. Sinyal tetiklendiğinde, gösterge giriş fiyatından yüzde mesafeleri olarak giriş, stop loss, TP1, TP2 ve TP3 seviyelerini hesaplar ve bunları yatay çizgiler olarak çizer. Çizgiler, her hedef veya stop loss'a ulaşılana kadar görünür kalır.
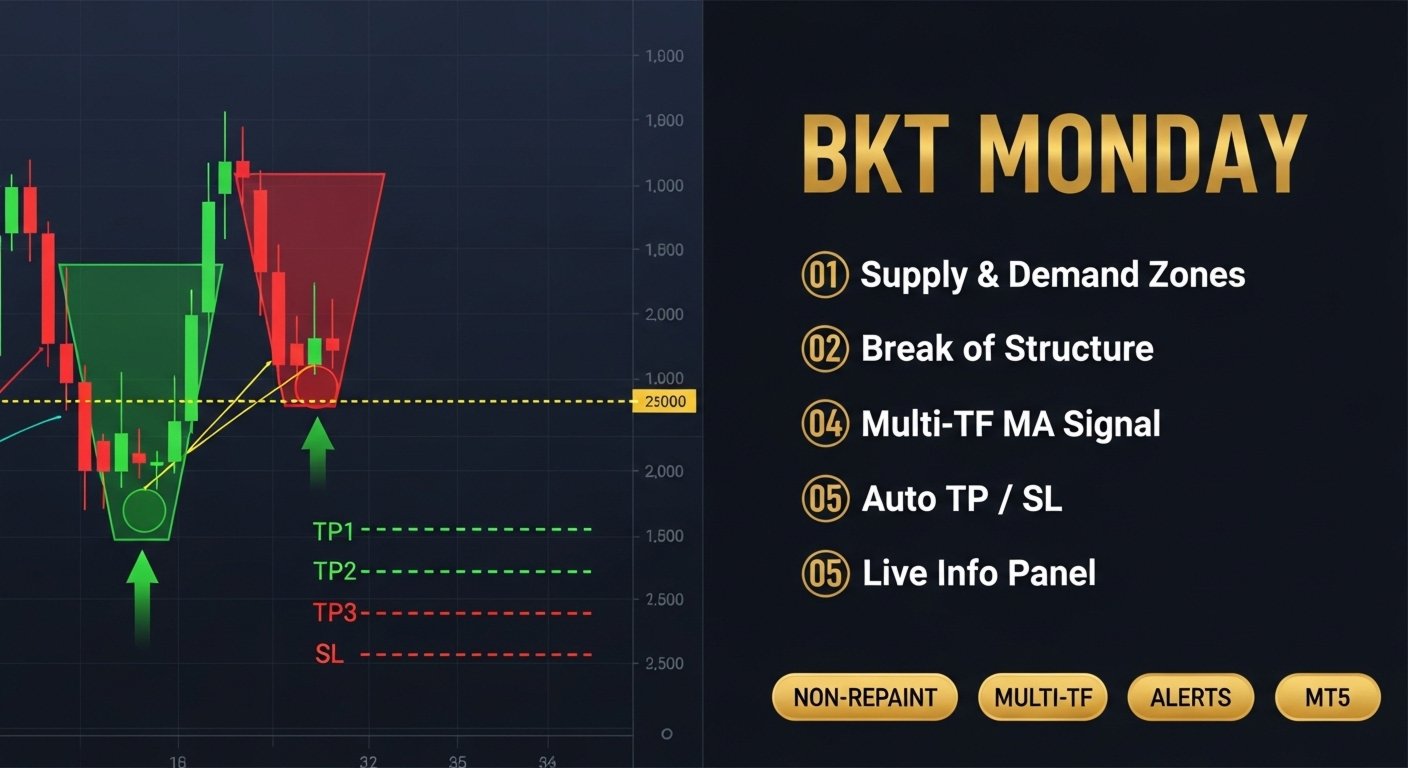
Gösterge Nasıl Okunur
Bir çubuğun altındaki yeşil yukarı ok Long sinyalini gösterir. Bir çubuğun üzerindeki kırmızı aşağı ok Short sinyalini gösterir. Mavi yatay çizgi giriş seviyesini; kırmızı çizgi stop loss'u işaretler. Üç yeşil çizgi Long sinyaller için artan sırayla TP1, TP2 ve TP3'ü, Short sinyaller için azalan sırayla işaretler. Sol üst köşedeki panel mevcut sinyal durumunu, aktif giriş ve hedef seviyelerini, mevcut ATR'yi ve en yakın arz ve talep bölgesi orta noktalarını gösterir. Aktif bir işlem olmadığında panel "SCANNING..." görüntüler ve hedef çizgileri gizlenir.
Çubuklar, isteğe bağlı olarak üst zaman dilimi trend yönünü yansıtmak için mor ve mavi olarak yeniden renklendirilir. Arz bölgeleri kırmızımsı dikdörtgenlerle; talep bölgeleri yeşilimsi dikdörtgenlerle çizilir. Herhangi bir bölge sınırının ötesine fiyat kapanışıyla geçersiz kılındığında, bölge orta noktasında kesik Break of Structure çizgisi görünür.
Önerilen Kullanım
Gösterge, MetaTrader 5'te mevcut tüm semboller ve zaman dilimleriyle uyumludur. Bölge tespitinin doğru çalışması için grafik, her iki tarafta en az iki tam pivot geri bakış dönemini tamamlamaya yetecek kadar geçmiş çubuğa sahip olmalıdır. MA sinyal zaman dilimi, mevcut grafik dönemine çözünürlük çarpanı girişi uygulanarak otomatik olarak türetilir; 8 çarpanıyla M15'te çalışan traderlar H2 verilerine dayalı sinyaller alacaktır. Gösterge, yukarıdan aşağıya çok zaman dilimli yaklaşım kullanan swing trader ve gün içi traderlara uygundur. Emirleri otomatik olarak yerleştirmez ve herhangi bir harici servise bağlanmaz.
Parametreler
MA Trend Sinyali
- Resolution multiplier — Sinyal zaman dilimini türetmek için mevcut zaman dilimine uygulanan çarpan — Varsayılan: 8
- Use alternate timeframe — Üst zaman dilimi MA hesaplamayı etkinleştir — Varsayılan: true
- MA type — Hareketli ortalama türü: ALMA, TEMA veya Hull MA — Varsayılan: ALMA
- MA period — Hareketli ortalama hesaplama dönemi — Varsayılan: 2
- Sigma — ALMA tarafından kullanılan sigma değeri — Varsayılan: 5
- ALMA offset — ALMA için offset parametresi (0 ile 1 aralığı) — Varsayılan: 0.85
- Signal delay — Sinyal hesaplamasını geciktirmek için çubuk sayısı — Varsayılan: 0
Arz ve Talep
- Pivot lookback — Swing yüksek ve düşüklerini belirlemek için kullanılan çubuk sayısı — Varsayılan: 10
- Max zones on chart — Grafikte görünür tutulan maksimum bölge sayısı — Varsayılan: 20
- Zone height multiplier — ATR çarpanı olarak ifade edilen bölge yüksekliği — Varsayılan: 2.5
- Show zone labels — Pivot noktalarında HH, LH, HL, LL etiketleri göster — Varsayılan: false
- Zone deduplication gap — Aynı taraftaki iki bölge arasındaki minimum ATR mesafesi — Varsayılan: 2.0
Arz ve Talep Görseli
- Supply fill color — Arz bölgeleri için dolgu rengi — Varsayılan: koyu kırmızı
- Supply border color — Arz bölgeleri için kenarlık rengi — Varsayılan: orta kırmızı
- Demand fill color — Talep bölgeleri için dolgu rengi — Varsayılan: koyu yeşil
- Demand border color — Talep bölgeleri için kenarlık rengi — Varsayılan: orta yeşil
- Show Break of Structure lines — Bir bölge geçersiz kılındığında kesik çizgi çiz — Varsayılan: true
- Show zone midline — Her bölgede kesik orta nokta çizgisi çiz — Varsayılan: false
Destek ve Direnç
- Enable S/R lines — Otomatik destek ve direnç tespitini etkinleştir — Varsayılan: false
- Minimum pivot touches — Bir seviye oluşturmak için gereken minimum dokunma sayısı — Varsayılan: 2
- Line style — S/R çizgi stili: Dotted, Dashed veya Solid — Varsayılan: Dotted
- Line width — S/R çizgi genişliği piksel cinsinden — Varsayılan: 2
Risk Yönetimi
- TP1 distance — Girişten TP1 mesafesi yüzde olarak — Varsayılan: 1.0
- TP1 close quantity — TP1'de kapatılacak pozisyon yüzdesi — Varsayılan: 50
- TP2 distance — Girişten TP2 mesafesi yüzde olarak — Varsayılan: 1.5
- TP2 close quantity — TP2'de kapatılacak pozisyon yüzdesi — Varsayılan: 30
- TP3 distance — Girişten TP3 mesafesi yüzde olarak — Varsayılan: 2.0
- TP3 close quantity — TP3'te kapatılacak pozisyon yüzdesi — Varsayılan: 20
- Stop Loss distance — Girişten stop loss mesafesi yüzde olarak — Varsayılan: 0.5
Görüntüleme
- Show signal arrows — Grafikte Long ve Short oklarını göster — Varsayılan: true
- Color bars by trend — Üst zaman dilimi trend yönüne göre mumları yeniden renklendir — Varsayılan: true
- Historical signal limit — Sinyallerin çizildiği maksimum geçmiş çubuk sayısı (0 = tümü) — Varsayılan: 500
Panel
- Show panel — Grafikte bilgi panelini göster — Varsayılan: true
- Panel X position — Grafiğin sol kenarından yatay mesafe piksel cinsinden — Varsayılan: 20
- Panel Y position — Grafiğin üst kenarından dikey mesafe piksel cinsinden — Varsayılan: 30
Bu gösterge yalnızca analitik amaçlar içindir ve işlemleri otomatik olarak gerçekleştirmez. Tüm işlem kararları, pozisyon boyutlandırma ve risk yönetimi tamamen traderin sorumluluğundadır. Geçmiş sinyal kalıpları gelecekteki performansı garanti etmez.


Brilliant Indicator , so far the best performing Indicator compared to others that I'm testing at Market Open madness. Please can you add Alerts to phone/email when Buy or Sell signals are generated. Thank you in advance.