Trend Pulse Pro V2
- Indicators
- Version: 2.51

⭐️⭐️⭐️Trend Pulse Pro V2⭐️⭐️⭐️
⚡️⚡️⚡️ 8 in 1⚡️⚡️⚡️
Professional Product Description
🚀 Why Trend Pulse Pro V2?
Stop cluttering your charts with multiple indicators!
Traditional technical analysis requires opening numerous separate indicators: ADX for trend strength, RSI for momentum, MACD for direction changes, Bollinger Bands for volatility, and more. This leads to cluttered charts, conflicting signals, and decision paralysis.
Trend Pulse Pro V2 solves this problem.
Instead of opening 8 separate indicators and manually analyzing each one, you get one comprehensive tool that does all the work for you. The indicator automatically collects data from all components, weighs them according to your preferences, and delivers a single, clear signal from -100 to +100.
🎯 What Problems Does It Solve?
❌ Without Trend Pulse Pro V2:
- 8 different indicators on your chart
- Cluttered, hard-to-read charts
- Conflicting signals from different indicators
- Time-consuming manual analysis
- Subjective interpretation of multiple data points
- Missed trading opportunities due to analysis paralysis
✅ With Trend Pulse Pro V2:
- One indicator replaces eight
- Clean, professional chart appearance
- Single unified signal
- Instant trend strength assessment
- Objective, algorithm-based analysis
- Quick decision making with confidence
💡 How Does It Work?
Trend Pulse Pro V2 acts as your personal analysis assistant. It continuously monitors 8 key aspects of the market:
- Trend Strength (ADX) — How strong is the current trend?
- Trend Direction (MA Slope) — Which way is the market moving?
- Price Position (Price vs MA) — Is price above or below the trend?
- Momentum (MACD) — Is momentum increasing or decreasing?
- Market Conditions (RSI) — Is the market overbought or oversold?
- Volume Confirmation — Is volume supporting the move?
- Volatility (Bollinger Bands) — How volatile is the market?
- Higher Timeframe Confluence (MTF) — Do higher timeframes agree?
The indicator then combines all this information using a weighted algorithm and outputs a single value:
- Positive values (+1 to +100) indicate bullish conditions
- Negative values (-1 to -100) indicate bearish conditions
- The higher the absolute value, the stronger the signal
🏆 Who Is This For?
Beginner Traders:
- No need to learn 8 different indicators
- Clear BUY/SELL signals easy to understand
- Built-in dashboard explains what's happening
Experienced Traders:
- Full customization of all parameters
- Adjust weights to match your strategy
- Save time on multi-indicator analysis
Scalpers:
- Fast signal generation
- Optimized dashboard refresh rate
- Works on M1-M5 timeframes
Swing Traders:
- Multi Timeframe confluence analysis
- Higher timeframe trend confirmation
- Alert system for key levels
⏱️ Save Time, Trade Smarter
Before: Open chart → Add ADX → Add RSI → Add MACD → Add Bollinger Bands → Add Moving Average → Add Volume indicator → Analyze each one → Try to combine signals → Make decision
After: Open chart → Add Trend Pulse Pro V2 → See the signal → Make decision
Result: What used to take minutes now takes seconds. One look at the dashboard tells you everything you need to know about current market conditions.
📌 What is Trend Pulse Pro V2?
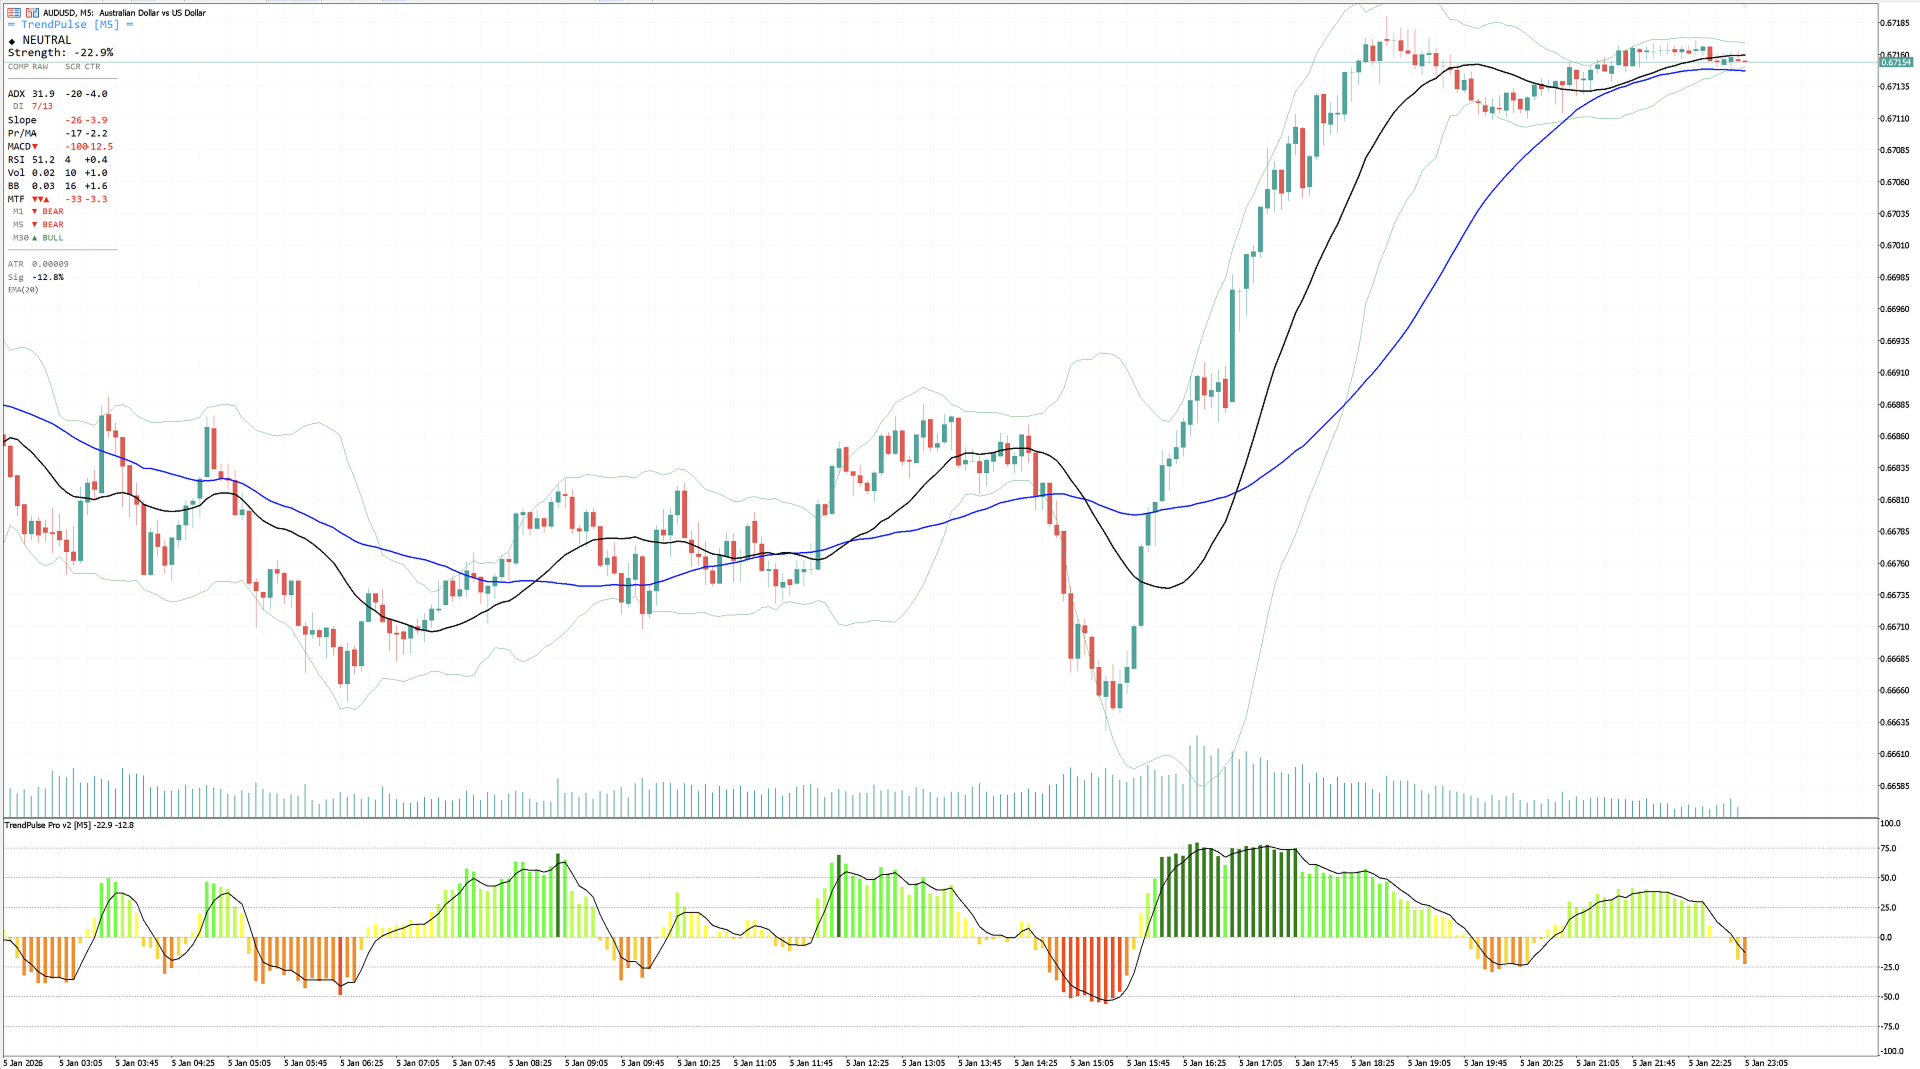
Trend Pulse Pro V2 is an advanced, multi-component trend strength indicator for MetaTrader 5 platform. It combines 8 independent technical analysis methods into one clear signal displayed as a colored histogram ranging from -100 to +100.
The indicator automatically weighs and normalizes data from each component, delivering unambiguous information about the strength and direction of the current trend. Thanks to the built-in dashboard, traders have full insight into how each element affects the final result.
🎯 Key Features
- 8 analysis components in one indicator
- Fully customizable — enable/disable components, adjust weights
- Multi Timeframe (MTF) — confluence analysis of 3 higher timeframes
- Automatic adaptation of parameters to current timeframe
- Interactive dashboard with real-time values
- Color gradient histogram (10 levels)
- Signal line EMA for confirmation
- Alert system — sound, push, email
🔧 Analysis Components
Each component can be individually enabled or disabled and assigned a custom weight affecting the final result:
ADX (default weight: 20%) — Trend strength based on DI+ and DI-
MA Slope (default weight: 15%) — Dynamics and direction of moving average
Price vs MA (default weight: 12.5%) — Price distance from moving average (in ATR units)
MACD (default weight: 12.5%) — Momentum and MACD histogram
RSI (default weight: 10%) — Relative strength — overbought/oversold conditions
Volume (default weight: 10%) — Current volume ratio to average volume
Bollinger Bands (default weight: 10%) — Band width — market volatility
MTF Confluence (default weight: 10%) — Direction agreement on 3 higher TFs
⚙️ Complete Settings List
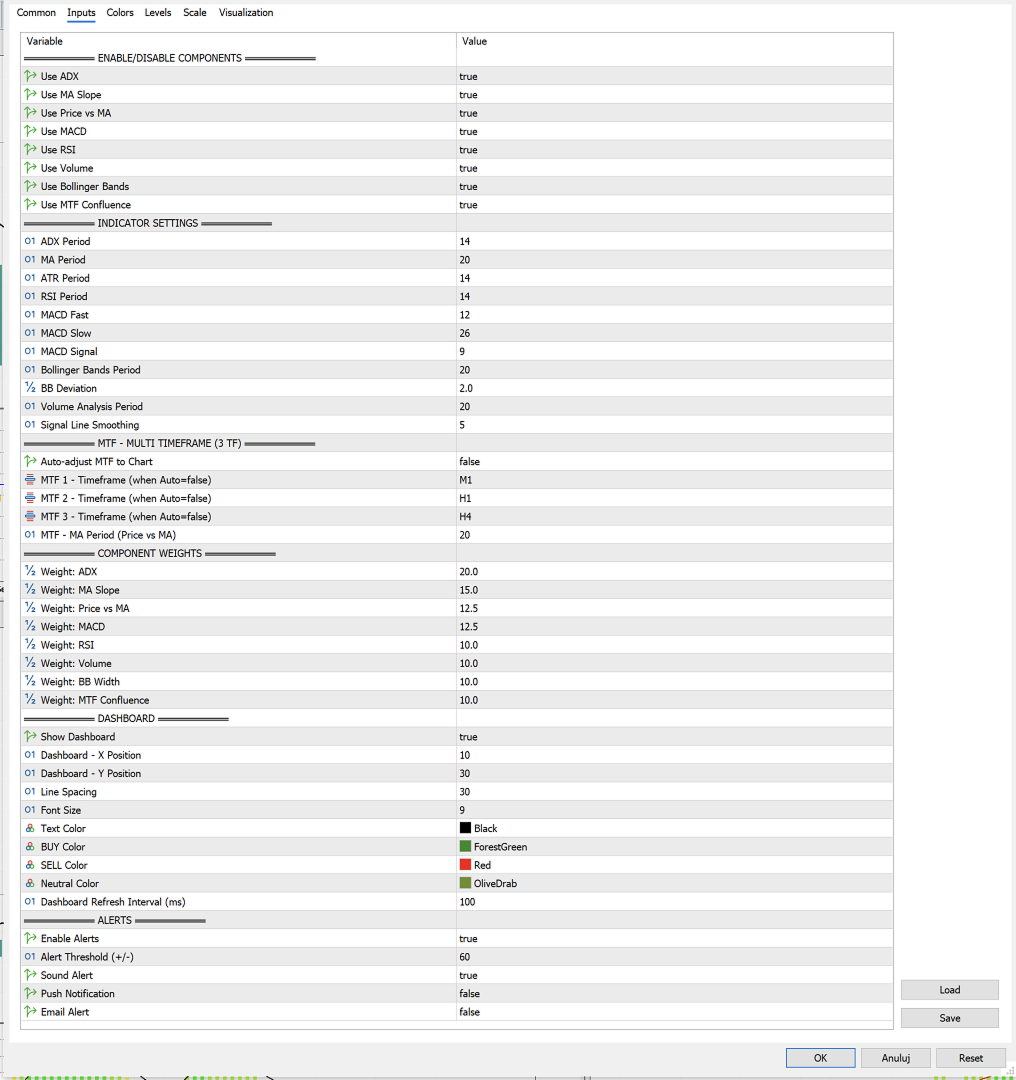
1️⃣ Enable/Disable Components
- Use ADX — Enables ADX analysis (default: Yes)
- Use MA Slope — Enables moving average slope analysis (default: Yes)
- Use Price vs MA — Enables price position relative to MA analysis (default: Yes)
- Use MACD — Enables MACD analysis (default: Yes)
- Use RSI — Enables RSI analysis (default: Yes)
- Use Volume — Enables volume analysis (default: Yes)
- Use Bollinger Bands — Enables BB width analysis (default: Yes)
- Use MTF Confluence — Enables Multi Timeframe analysis (default: Yes)
2️⃣ Indicator Settings
- ADX Period — Period for ADX indicator (default: 14)
- MA Period — EMA moving average period (default: 20)
- ATR Period — ATR period for normalization (default: 14)
- RSI Period — RSI indicator period (default: 14)
- MACD Fast — Fast EMA for MACD (default: 12)
- MACD Slow — Slow EMA for MACD (default: 26)
- MACD Signal — MACD signal line (default: 9)
- Bollinger Bands Period — BB middle line period (default: 20)
- BB Deviation — Standard deviation multiplier (default: 2.0)
- Volume Analysis Period — Period for average volume calculation (default: 20)
- Signal Line Smoothing — EMA period for signal line (default: 5)
3️⃣ Multi Timeframe (MTF)
- Auto-adjust MTF — Automatic TF selection based on current chart (default: Yes)
- MTF 1 - Timeframe — First higher TF when Auto=false (default: M15)
- MTF 2 - Timeframe — Second higher TF when Auto=false (default: H1)
- MTF 3 - Timeframe — Third higher TF when Auto=false (default: H4)
- MTF - MA Period — EMA period for MTF analysis (default: 50)
Available timeframes: M1, M5, M15, M30, H1, H4, D1, W1, MN
Auto Mode — indicator automatically selects optimal higher timeframes:
- M1 → M5, M15, H1
- M5 → M15, H1, H4
- M15 → H1, H4, D1
- M30 → H1, H4, D1
- H1 → H4, D1, W1
- H4 → D1, W1, MN
- D1 → W1, MN, MN
4️⃣ Component Weights
You can assign a custom weight to each component determining its impact on the final result. The sum of active component weights is automatically normalized to 100%.
- Weight: ADX — ADX impact on result (default: 20.0)
- Weight: MA Slope — MA slope impact (default: 15.0)
- Weight: Price vs MA — Price position impact (default: 12.5)
- Weight: MACD — MACD impact (default: 12.5)
- Weight: RSI — RSI impact (default: 10.0)
- Weight: Volume — Volume impact (default: 10.0)
- Weight: BB Width — Bollinger Bands impact (default: 10.0)
- Weight: MTF Confluence — MTF analysis impact (default: 10.0)
💡 Tip: Set higher weight to components you trust most in your trading strategy.
5️⃣ Dashboard
- Show Dashboard — Enables panel on chart (default: Yes)
- Dashboard - X Position — Distance from left edge in pixels (default: 10)
- Dashboard - Y Position — Distance from top edge in pixels (default: 30)
- Line Spacing — Row height in pixels (default: 18)
- Font Size — Text size (default: 9)
- Text Color — Standard text color (default: White)
- BUY Color — Buy signal color (default: Lime)
- SELL Color — Sell signal color (default: Red)
- Neutral Color — Neutral signal color (default: Gold)
- Refresh Interval — Dashboard update frequency in ms (default: 500)
6️⃣ Alerts
- Enable Alerts — Activates notification system (default: Yes)
- Alert Threshold (+/-) — Value triggering alert (default: 75)
- Sound Alert — Sound notification (default: Yes)
- Push Notification — Phone alert, requires MT5 configuration (default: No)
- Email Alert — Email notification, requires MT5 configuration (default: No)
📊 Dashboard — Panel Contents
Dashboard displays in real-time:
- Main Signal — STRONG BUY / BUY / WEAK BUY / NEUTRAL / WEAK SELL / SELL / STRONG SELL
- Trend Strength — Percentage value from -100% to +100%
- Components Table — Name, raw value (RAW), score (SCR), contribution (CTR)
- ADX Details — DI+ and DI- values
- MTF Details — Direction on each of 3 timeframes (▲ BULL / ▼ BEAR / ─ FLAT)
- ATR — Current ATR value
- Signal Line — Smoothed signal line value
📈 Signal Interpretation
+75 to +100 → ▲▲ STRONG BUY — Strong uptrend, consider long position
+50 to +74 → ▲ BUY — Uptrend, buy signal
+25 to +49 → ↗ WEAK BUY — Weak buy signal, look for confirmation
-24 to +24 → ◆ NEUTRAL — No clear trend, stay out of the market
-25 to -49 → ↘ WEAK SELL — Weak sell signal, look for confirmation
-50 to -74 → ▼ SELL — Downtrend, sell signal
-75 to -100 → ▼▼ STRONG SELL — Strong downtrend, consider short position
🎨 Visualization
- Histogram — color gradient from dark green (strong BUY) through yellow (neutral) to dark red (strong SELL)
- Signal Line — white EMA line for direction confirmation
- Reference Levels — dotted lines at levels: ±75, ±50, ±25, 0
💡 Usage Examples
Scalping (M1-M5):
- Disable MTF Confluence
- Increase RSI and MACD weight
- Shorten indicator periods
Day Trading (M15-H1):
- Enable all components
- Use default settings
- Set alert at ±50 level
Swing Trading (H4-D1):
- Increase ADX and MTF Confluence weight
- Extend indicator periods
- Set alert at ±75 level
⚠️ Notes
- Indicator automatically adapts parameters to current timeframe
- All calculations are based on real market data
- Indicator does not repaint — signals do not change retrospectively
• • Dashboard optimized for performance (throttling)