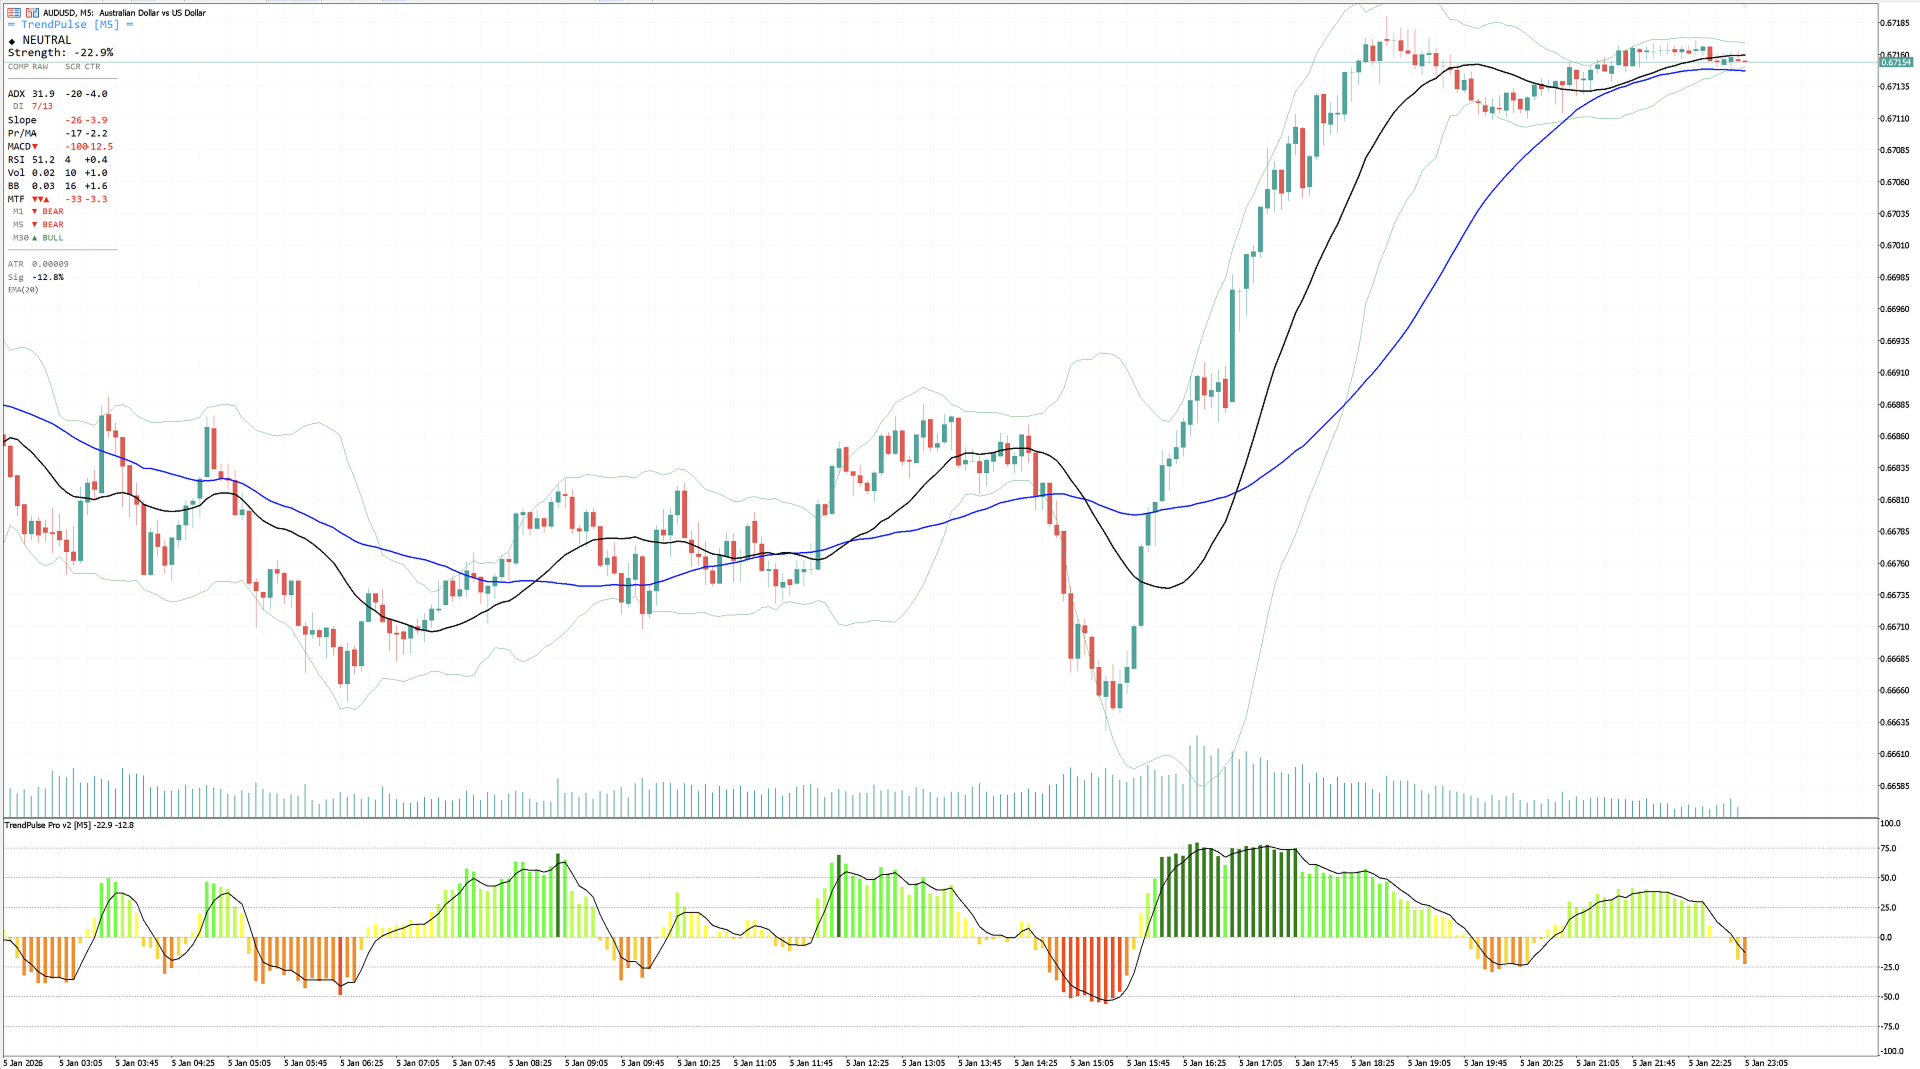
Trend Pulse Pro V2

MTF MA Dashboard Pro v1.04 - プロフェッショナル・マルチタイムフレーム移動平均線アナライザー
​MT5用の高度なテクニカル指標。インテリジェントなゴールデンクロス/デッドクロス検出機能と、完全にカスタマイズ可能なビジュアルダッシュボードを備えた、包括的なマルチタイムフレーム移動平均線分析を提供します。
​時間足の切り替えはもう必要ありません!最大4つの時間足を同時に分析し、トレンドの一致を瞬時に発見します。
​═══ 主な機能 ═══
​▶ マルチタイムフレーム分析
​最大4つの時間足を同時に監視(M1-MN1 + カスタム期間)
​各時間足を個別に設定可能
​全時間足でリアルタイム同期
​あらゆる銘柄に対応(FX、ゴールド、指数、仮想通貨)
​▶ デュアルMAシステム
​各時間足に2本の移動平均線(短期&長期)
​期間:1-500(完全にカスタマイズ可能)
​種類:SMA, EMA, SMMA, LWMA
​適用価格:Close, Open, High, Low, Median, Typical, Weighted
​▶ ゴールデンクロス/デッドクロス検出
​強気のゴールデンクロスを自動識別(短期MAが長期MAを上抜け)
​弱気のデッドクロスを自動識別(短期MAが長期MAを下抜け)
​ダッシュボード上の明確な視覚シグナル
​リペイントなし(No repaint)- 確定したシグナルは固定されます
​▶ リアルタイムトレンド分析
​瞬時のトレンド分類:強気/弱気/混合
​移動平均線に対する価格の位置に基づく判定
​全時間足の全体的なバイアスを示すマーケットサマリー
​モメンタムの変化を示す方向矢印(↑↓→)
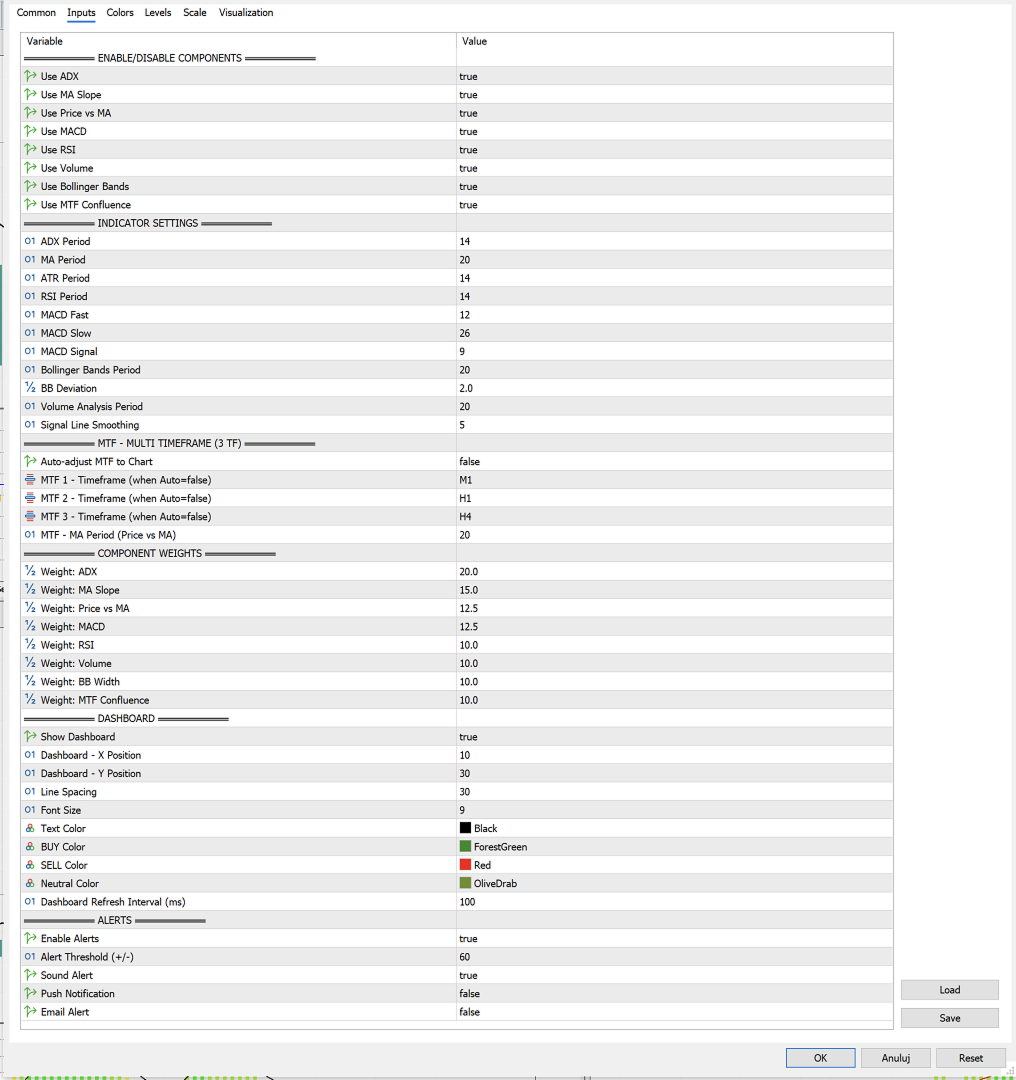
​▶ プロフェッショナルな視覚化
​10種類のフォント:Arial, Arial Bold, Consolas, Courier, Tahoma, Verdana, Calibri, Segoe UI, Lucida Console, Times New Roman
​5つのカラーテーマ:クラシック、ダークモード、ブルー、グリーン、カスタム
​位置、フォントサイズ(8-12)、行の高さ(20-30)を調整可能
​表示/非表示:MA値、方向矢印、クロス状態、バー数
​▶ スマートアラートシステム
​MAクロスアラート(ゴールデンクロス/デッドクロス)
​マルチタイムフレーム一致アラート
​一致に必要な最小時間足数を設定可能(2-4)
​3種類の通知:ターミナルポップアップ、モバイルプッシュ通知、Eメール
​カスタマイズ可能なアラート条件
​▶ パフォーマンスと使いやすさ
​最適化された計算エンジン
​調整可能な更新レート(100-2000ms)
​低CPU使用率
​30秒で完了する簡単なセットアップ
​10回のアクティベーション込み
​═══ こんな方に最適 ═══
✓ マルチタイムフレームでのトレンド確認戦略
✓ スイングトレードおよびデイトレード
✓ MAクロスオーバー取引システム
✓ 市場構造の分析
✓ トレンドフォロー手法
​═══ 特徴 ═══
⭐ MQL5で最もカスタマイズ性の高いMAダッシュボード
⭐ 10種類のプロ用フォントを備えた唯一のインジケーター
⭐ 高度なゴールデンクロス/デッドクロス検出
⭐ カスタム期間を含む全ての時間足で動作
⭐ すべてのパラメータを完全に制御可能
​🎯 30秒で使用準備完了
チャートに適用して分析を開始するだけです!すべての設定は直感的なインターフェースからアクセスできます。
​MTF MA Dashboard Proを使用して、よりスマートな取引決定を行うプロのトレーダーに参加しましょう。
おすすめのプロダクト
Anchored VWAP Trading Indicator Struggling to identify true market value and key support/resistance levels? The Anchored VWAP Trading Indicator helps you track price based on real traded volume, giving you a clear edge in your trading decisions. This tool allows you to anchor VWAP from any point on the chart, making it ideal for analyzing trends, reversals, and institutional activity. Key Features Anchored VWAP from any candle Accurate volume-weighted price calculation Works on all symbol
The TrendLinePro indicator for MetaTrader 5 creates a trend line based on the last candle highs and lows. The number of candles to be used to determine the direction can be selected yourself. The trend line can also be used to set an SL. Changes in trend directions can optionally be displayed with an arrow. Input Parameters: Number of Candles for Distance: 3 Display Direction Changes Arrows: false
Bid Price Timer Indicator — 精密なタイミングとスマートな価格追跡! Bid Price Timer Indicator は、 時間・正確さ・明確さ を重視するトレーダーのために設計された、強力なトレードツールです。 主な特徴: 固定タイマー表示 – タイマーは常にチャートの 右側 に表示され、(X_Offset で位置調整可能)。 価格に連動した動き – タイマーは Bid価格 に合わせてリアルタイムで 上下に移動 。 自動再配置 – 価格が変化すると、タイマーは自動的に 新しい価格レベルに追従 。 オプションの水平ライン – 正確なBid価格レベル を視覚的に表示可能。 ️ リアルタイム更新 – タイマーは 毎秒更新 され、 次のローソク足までのカウントダウン を表示。完璧なエントリータイミングを逃しません! トレーダーが選ぶ理由: ローソク足のクローズを 高精度で予測 できる チャートを シンプル・モダン・分かりやすく 保てる スキャルピング、デイトレード、テクニカル分析 に最適 シンプルで洗練さ
1. Why did I develop this series of indicators I found that most traders need to use multiple time frame indicators. They usually switch time frame to see indicators. However, once the timeframe is switched, you cannot see the  corresponding relationship  between  the price in the smaller timeframe  and  the indicator in the larger timeframe . For example: if your price chart is in H1 timeframe, you can see H4, D1 and W1 indicators in H1 timeframe Chart. This is more helpful for you to find th
This multi-timeframe indicator continues the traditions of Giant on the MT5 platform. It is based on author's indicators that collect signals from different charts. Very often, the price starts moving in the specified direction in a few minutes. Frequent repetition of signals in one direction indicates a prevailing trend.  The signals for the trader are arrows on the chart and alerts. Everything is set up for trading. You only need to specify the desired currency pair. It is recommended to set
This indicator let user clearly see Buy/Sell signals. When a bar is closed and conditions meet, arrow signal will come up at Close Price, up is Buy and down is Sell. It works on all Timeframes. And you can set sound alert when signals come up.
Indicator introduction:  A channel and trend line indicator, which is a good tool for manual trading, and also can be used for creating new EAs, without drifting or repainting.  It applies to any timeframes and any symbols.   The work of the indicator is shown in the screenshots. For any novice and programming trading friend, you can write the signal into the EA to play freely, buffer 0 corresponds to the bold trend line, buffer 4 and 5 respectively corresponds to the channel's upper and lower f
1. Why did I develop this series of indicators I found that most traders need to use multiple time frame indicators. They usually switch time frame to see indicators. However, once the timeframe is switched, you cannot see the  corresponding relationship  between  the price in the smaller timeframe  and  the indicator in the larger timeframe . For example: if your price chart is in H1 timeframe, you can see H4, D1 and W1 indicators in H1 timeframe Chart. This is more helpful for you to find th
Dark Breakout   is an Indicator for intraday trading. This Indicator is based on Trend Following  strategy, providing an entry signal on the breakout. The signal is provided by the arrow, which confirms the breaking of the level. We can enter in good price with this Indicator, in order to follow the main trend on the current instrument. It is advised to use low spread ECN brokers.    Recommended Brokers This Indicator does Not repaint and N ot lag . Recommended timeframes are M5, M15 and H1. R
The Quantitative Qualitative Estimation (QQE) indicator is derived from Wilder’s famous Relative Strength Index (RSI). In essence, the QQE is a heavily smoothed RSI. Modification of this version: ( converted from tradingview script by Mihkell00, original from Glaz, 100% identical output) So there are Two QQEs. One that is shown on the chart as columns, and the other "hidden" in the background which also has a 50 MA   bollinger band   acting as a zero line. When both of them agree - you get a b
1. Why did I develop this series of indicators I found that most traders need to use multiple time frame indicators. They usually switch time frame to see indicators. However, once the timeframe is switched, you cannot see the  corresponding relationship  between  the price in the smaller timeframe  and  the indicator in the larger timeframe . For example: if your price chart is in H1 timeframe, you can see H4, D1 and W1 indicators in H1 timeframe Chart. This is more helpful for you to find th
TrendScalper – Professional Trend Scalping Signal Indicator (MT5) TrendScalper is a professional-grade trend-following and scalping signal indicator designed for MetaTrader 5 . It combines EMA crossover logic , MACD momentum confirmation , and ADX trend strength filtering to deliver high-quality buy and sell signals during strong and controlled market conditions. This indicator is built for precision trading , focusing on low-risk entries , trend continuation , and filtered market environmen
1. Why did I develop this series of indicators I found that most traders need to use multiple time frame indicators. They usually switch time frame to see indicators. However, once the timeframe is switched, you cannot see the  corresponding relationship  between  the price in the smaller timeframe  and  the indicator in the larger timeframe . For example: if your price chart is in H1 timeframe, you can see H4, D1 and W1 indicators in H1 timeframe Chart. This is more helpful for you to find th
This Indicator adding power to traditional zigzag indicator. With High-Low numbers in vision it will be easier to estimate change of trend by knowing the depth of each wave. Information including points, pips, percentage%, and #bars can be displayed based on configuration. All information is real-time update. This indicator is especially useful in sideway market to buy low sell high.
推測をやめて、統計的優位性を持って取引を始めましょう 株価指数はFXとは異なる動きをします。決まったセッションがあり、オーバーナイトでギャップが発生し、予測可能な統計パターンに従います。このインジケーターは、DAX、S&P 500、ダウ・ジョーンズなどの指数を自信を持って取引するために必要な確率データを提供します。 何が違うのか ほとんどのインジケーターは何が起こったかを示します。このインジケーターは次に何が起こる可能性が高いかを示します。毎取引日、インジケーターは100日間のヒストリカルデータに対して現在のセットアップを分析します。類似のギャップ、類似のオープニングポジションを持つ日を見つけ、価格が主要なレベルに到達した頻度を正確に計算します。ギャップが埋まるか、昨日の高値がテストされるかの推測はもう必要ありません。実際のデータに基づいた正確なパーセンテージが得られます。 すべての入力パラメータを説明した完全なマニュアルはこちら: https://www.mql5.com/en/blogs/post/766370 優れたセットアップを見つけるための戦略ガイドはこちら: https:/
移動平均線クロス、ボリンジャーと移動平均線のクロス、移動平均線の角度でサイン表示 MT5インジケータ こちらに サイト があります。 このインジケータは3つのパターンでサインを表示(切り替え可能)します。 ① 移動平均線のクロス ② ボリンジャーバンドと短期移動平均線とのクロス ③ ボリンジャーバンドと短期移動平均線とのクロスと、中期移動平均線と長期移動平均線の角度 ⓸ ボリンジャーバンドと短期移動平均線とのクロス(サインを交互に表示) 移動平均線のクロス 指定した短期移動平均線と長期移動平均線のゴールデンクロスでは買いサイン、デットクロスでは売りサインを表示します。 ディフォルトでは短期は5,長期は20となっています。 もちろん変更可能になります。 移動平均線の種類をEMA(指数平滑移動平均線)やSMMA(平滑化移動平均)などに変更可能で適する価格も変更可能になります。 ボリンジャーバンドと短期移動平均線のクロス ボリンジャーバンド(以降BB)と短期移動平均線のクロスでサインを表示します。 ディフォルトではBB+1σと5MAのゴールデンクロスで買いサイン、BB-1σと5MAのデット
Automated Anchored Volume Weighted Average Price You set a period, and the indicator will find the highest and lowest price point in the period and derive a AVWAP from there. It also prints out a median line. You can use the generated VWAP lines as a channel, as S/R levels or as a volatility indicator. It's based on tick volume to be compatible with most CFD brokers. Happy trading!
Utilities
Douglas Lucio De Araujo
Indicator with 3 features - Clock : Clock independent of the chart, counting continues even when the market is closed. - Template : After setting up a configuration in any graphic, be it color patterns, indicators, zoom ... The configuration will be copied to all active graphics. - TimeFrame : Set the TimeFrame on a chart, and with just one click all the active charts will be changed to the same TimeFrame.
1. Why did I develop this series of indicators I found that most traders need to use multiple time frame indicators. They usually switch time frame to see indicators. However, once the timeframe is switched, you cannot see the  corresponding relationship  between  the price in the smaller timeframe  and  the indicator in the larger timeframe . For example: if your price chart is in H1 timeframe, you can see H4, D1 and W1 indicators in H1 timeframe Chart. This is more helpful for you to find th
Paranormal Insightment  Use with : Ritz MA Ribbon Dynamics (check on my product) Ritz Paranormal Insightment   is a precision-engineered analytical indicator that blends   momentum intelligence   and   trend confirmation   into a single visual system. It merges the   DeMarker oscillator   with a   dynamic Moving Average filter , detecting price exhaustion and directional shifts with remarkable clarity. The indicator translates subtle market imbalances into actionable visual and auditory signal
The 4 headed dragon is an indicator that has two functions. 1) Set the background trend. 2) Mark the predominant trend. By combining these two indicator signals, we will be able to trade for or against the trend, adapting the signals to your reading of the market. You can download the demo and test it yourself. 1) Set the background trend.    Define four possibilities of trend that are the four heads of the dragon, marked by colors on the indicator, marking a) Powerful buying trend. b) Weak
Sequence Algo
Itumeleng Mohlouwa Kgotso Tladi
SEQUENCE ALGO - Your Trading Edge Unlock Market Opportunities with Precision Signal Intelligence SEQUENCE ALGO is a sophisticated trading indicator designed to help you identify high-probability entry and exit points in real-time. Built for traders who demand accuracy and clarity in their decision-making process. Key Benefits: Clear Visual Signals   - Eliminate guesswork with intuitive BUY and SELL alerts that cut through market noise and highlight potential trading opportunities. Real-Time Ana
Visual Polar Bear Indicator
AL MOOSAWI ABDULLAH JAFFER BAQER
Unlock the Market's True Direction with the Visual Polar Bear Indicator Are you tired of relying on single-instrument indicators that only show a fraction of the market's story? Do you want a powerful, visual tool that cuts through the noise and gives you a clear, comprehensive view of currency strength and weakness? Introducing the Visual Polar Bear Indicator , a sophisticated multi-asset cluster indicator designed to give you a decisive edge in the forex market. For just $30, you can transfor
Brilliant Reversals MultiCurrency Scanner MT5は、複数の通貨ペアにおける潜在的な反転ポイントを特定しようとするトレーダーのために設計された最先端のトレーディングインジケーターです。高度なアルゴリズムを活用することで、このツールは瞬時に洞察を提供し、トレーディング戦略を最適化しようとする初心者と経験豊富なトレーダーの両方にとって非常に貴重です。 このインジケーターは、市場の状況に基づいてリアルタイムの売買シグナルを提供することで、トレーダーの意思決定を強化し、取引パフォーマンスを向上させます。包括的なダッシュボードとアラート機能を備えており、主要な通貨ペアを簡単に監視し、市場の機会に迅速に対応できます。 MQL製品のインストールガイド | MT4/MT5で購入したMQL製品の更新 | 一般的なトラブルシューティングガイド | インジケーター設定 / ガイド 主な特徴 バッファ統合: インジケーターの値をアクセス可能なバッファとして公開し、Expert Advisorがシグナルベースのトレーディングを効果的に利用できるようにします。 視覚的矢印シ
KT DMA is a modified and advanced version of the classic Displaced Moving Averages with buy/sell crossover alerts and a Multi-Timeframe scanner that shows DMA's direction across each real-time time frame. A Displaced Moving Average is a simple moving average that moves ahead or backward in a time frame (either short-term or long-term). It also allows you to predict price movement more accurately. Features Depicts the trend direction using the alignment of three moving averages. Buy/Sell signals
Institutional Structure & Momentum Dashboard PRO Institutional Structure & Momentum Dashboard PRO is a technical analysis indicator for MetaTrader 5 designed to display market structure, price levels, and momentum conditions across multiple timeframes. The indicator projects support and resistance levels derived from higher timeframe data and combines them with additional filters to assist in identifying potential trading conditions. It provides a visual overview of price structure and signal s
このプロダクトを購入した人は以下も購入しています
ARIPoint is a powerful trading companion designed to generate high-probability entry signals with dynamic TP/SL/DP levels based on volatility. Built-in performance tracking shows win/loss stats, PP1/PP2 hits, and success rates all updated live. Key Features: Buy/Sell signals with adaptive volatility bands Real-time TP/SL/DP levels based on ATR Built-in MA Filter with optional ATR/StdDev volatility Performance stats panel (Success, Profit/Loss, PP1/PP2) Alerts via popup, sound, push, or email Cu
SuperScalp Pro
Van Minh Nguyen
4.57 (21)
SuperScalp Pro – 高度なマルチフィルタースキャルピングインジケーターシステム SuperScalp Pro は、クラシックな Supertrend と複数のインテリジェント確認フィルターを組み合わせた高度なスキャルピングインジケーターです。M1 から H4 まで複数の時間足で効率的に動作し、XAUUSD、BTCUSD、主要 Forex 通貨ペア向けに最適化されています。 このインジケーターは明確な Buy / Sell シグナルを提供し、ATR に基づいてエントリー価格、Stop Loss、Take Profit を自動計算します。Fibonacci Take Profit 機能により、重要な価格帯で早期決済し、到達時に通知を送信します。 初期設定では Fibonacci Take Profit が有効化されており、より安定した取引体験を重視しています。チャートに適用するだけですぐ利用可能です。上級者向けに、すべてのパラメータは自由にカスタマイズできます。 EMA、RSI、ADX、Volume、VWAP、Bollinger Bands、MACD Divergence な
このインジケーターを購入された方には、以下の特典を 無料 で提供しています: 各トレードを自動で管理し、ストップロスとテイクプロフィットを設定し、戦略ルールに基づいてポジションを決済する補助ツール 「Bomber Utility」 様々な銘柄に合わせたインジケーターの設定ファイル(セットファイル) 「最小リスク」、「バランスリスク」、「待機戦略」 の3つのモードで使用できる Bomber Utility 用の設定ファイル このトレーディング戦略をすぐに導入・設定・開始できる ステップバイステップのビデオマニュアル ご注意: 上記の特典を受け取るには、MQL5のプライベートメッセージシステムを通じて販売者にご連絡ください。 オリジナルのカスタムインジケーター 「Divergence Bomber(ダイバージェンス・ボンバー)」 をご紹介します。これは、MACDのダイバージェンス(乖離)戦略に基づいた 「オールインワン」型のトレーディングシステム です。 このテクニカルインジケーターの主な目的は、価格とMACDインジケーターの間に発生するダイバージェンスを検出 し、将来の価格の動きを示す
Entry In The Zone and SMC Multi Timeframe is a real-time 2-in-1 market analysis tool that combines market structure analysis and a No Repaint BUY / SELL signal system into a single indicator, built on Smart Money Concepts (SMC) — a widely adopted framework used by professional traders to understand market structure. This indicator helps you see the market more clearly, make decisions based on structure rather than guesswork, and focus on high-probability zones where price is more likely to react
Power Candles V3 - 初の自己最適化ストレングス・インジケーター Power Candles V3 は、ストレングス分析をそのままトレード可能なシステムへと変えます。チャートを市場の強さで色分けするだけでなく、バックグラウンドでリアルタイムの自動最適化を実行し、あなたの銘柄に最適な Stop Loss、Take Profit、シグナル閾値を提示します。ワンクリックでライブトレードに適用できます。 このツールは Stein Investments エコシステムの一部です。  18 種のツール一覧、AI によるセットアップ提案、  そしてコミュニティ参加はこちら: https://stein.investments Version 3 の新機能 - AUTO-OPTIMIZER チャート読み込み時、そして各バーの確定ごとに、Power Candles V3 は該当銘柄の過去データ上で 3,000 を超えるトレードの組み合わせ をシミュレーションします: 2 つの戦略 を並列でテスト: Momentum (MOM) と Reversal (REV) 3 段階のシグナル閾値
Gold Entry Sniper – ゴールドスキャルピング&スイングトレード用プロフェッショナル多時間足ATRダッシュボード Gold Entry Sniper は、XAUUSDや他の銘柄向けに正確な 売買シグナル を提供する、MetaTrader 5用の高度なインジケーターです。 ATRトレーリングストップロジック と 多時間足分析ダッシュボード を搭載し、スキャルピングからスイングトレードまで対応します。 主な特徴と利点 多時間足シグナル分析 – M1、M5、M15 のトレンドを同時表示。 ATRベースのトレーリングストップ – ボラティリティに応じて動的に調整。 プロ仕様のチャートダッシュボード – シグナル状況、ATRレベル、回帰線、売買方向を表示。 明確な売買マーカー – 自動矢印とテキストラベル。 エグジットアラートとトレード管理 – 利益確定のための自動検出。 完全カスタマイズ可能 – パネル位置、色、フォント、ATR/回帰設定を調整可能。 ゴールド(XAUUSD)に最適化 – M1〜M15のスキャルピングに最適、FXや指数、暗号資産にも対応。 Gold Entry
優れたテクニカルインジケーター「Grabber」をご紹介します。これは、すぐに使える「オールインワン」トレーディング戦略として機能します。 ひとつのコードに、市場のテクニカル分析ツール、取引シグナル(矢印)、アラート機能、プッシュ通知が強力に統合されています。 このインジケーターを購入された方には、以下の特典を無料で提供します: Grabberユーティリティ:オープンポジションを自動で管理するツール ステップバイステップのビデオマニュアル:インジケーターのインストール、設定、取引方法を解説 カスタムセットファイル:インジケーターをすばやく自動設定し、最大限の成果を出すための設定ファイル 他の戦略はもう忘れてください!Grabberだけが、あなたを新たなトレードの高みへと導いてくれるのです。 Grabber戦略の主な特徴: 推奨タイムフレーム:M5〜H4 対応通貨ペア・資産:どれでも使用可能ですが、私が実際に検証した以下を推奨します(GBPUSD、GBPCAD、GBPCHF、AUDCAD、AUDUSD、AUDSGD、AUDCHF、NZDUSD、NZDCAD、EURCAD、EURUSD、E
このインジケーターを購入すると、プロ仕様のトレードマネージャーを無料で差し上げます。 まず第一に、このトレーディングシステムがノンリペイント、ノンリドロー、ノンラグのインジケーターであることを強調する価値がある。これにより、手動取引とロボット取引の両方に理想的なものになっています。 オンラインコース、マニュアル、プリセットのダウンロード。 「スマートトレンドトレーディングシステム MT5」は、新規および経験豊富なトレーダー向けにカスタマイズされた包括的なトレーディングソリューションです。10以上のプレミアムインジケーターを組み合わせ、7つ以上の堅実なトレーディング戦略を備えており、多様な市場状況に対応する多目的な選択肢となっています。 トレンドフォロー戦略:トレンドを効果的に乗り越えるための正確なエントリーとストップロス管理を提供します。 リバーサル戦略:潜在的なトレンドの反転を特定し、トレーダーがレンジ相場を活用できるようにします。 スキャルピング戦略:高速で正確なデイトレードおよび短期取引のために設計されています。 安定性:すべてのインジケーターはノンリペイント、ノンリドロー、ノ
Quantum TrendPulse を ご紹介します。これは、   SuperTrend   、   RSI   、および Stochastic のパワーを 1 つの包括的なインジケーターに組み合わせて、取引の可能性を最大限に引き出す究極の取引ツールです。精度と効率を求めるトレーダー向けに設計されたこのインジケーターは、市場のトレンド、勢いの変化、最適なエントリー ポイントとエグジット ポイントを自信を持って特定するのに役立ちます。 主な特徴: SuperTrend 統合: 現在の市場動向に簡単に追従し、収益性の波に乗ることができます。 RSI精度: 買われすぎと売られすぎのレベルを検出し、市場の反転のタイミングに最適で、SuperTrendのフィルターとして使用されます。 確率的精度: 確率的振動を活用して、変動の激しい市場で隠れたチャンスを見つけます。SuperTrend のフィルターとして使用されます。 マルチタイムフレーム分析:   M5 から H1 または H4 まで、さまざまなタイムフレームで市場を常に把握します。 カスタマイズ可能なアラート: カスタム取引条件が満たされ
Azimuth Pro
Ottaviano De Cicco
5 (7)
Azimuth Pro V2:MT5向けシンセティック・フラクタル構造分析と確認済みエントリー 概要 Azimuth Pro は Merkava Labs によるマルチレベルスイング構造インジケーターです。4つのネストされたスイングレイヤー、スイングアンカーVWAP、ABCパターン検出、3タイムフレーム構造フィルタリング、そして確定バーでの確認済みエントリー — 1つのチャートで、ミクロスイングからマクロサイクルまでを網羅するワークフロー。 これはブラインドシグナル製品ではありません。ロケーション、コンテキスト、タイミングを重視するトレーダーのための構造ファーストワークフローです。 V2発売記念オファー — Azimuth Pro V2をUSD 399で(次の100本)。最終価格:USD 499。 1. V2での変更点 シンセティック・マルチタイムフレームエンジン 上位タイムフレーム分析をMeridian Proと同じ独自のシンセティックアーキテクチャで一から再構築。よりクリーンなHTFコンテキスト、安定したライブ動作、従来のMTF同期問題なし。シンセティックエンジンは 固定比率タ
Gann Made Easy   は、ミスター・ギャンの理論を使用した取引の最良の原則に基づいた、プロフェッショナルで使いやすい外国為替取引システムです。 W・D・ガン。このインジケーターは、ストップロスとテイクプロフィットレベルを含む正確な買いと売りのシグナルを提供します。 PUSH通知を利用して外出先でも取引可能です。 ご購入後、取引方法の説明と優れた追加インジケーターを無料で入手するには、私にご連絡ください! おそらく、ギャンの取引手法についてはすでに何度も聞いたことがあるでしょう。通常、ギャンの理論は初心者のトレーダーだけでなく、すでにある程度の取引経験がある人にとっても非常に複雑なものです。なぜなら、ギャンの取引手法は理論的にはそれほど簡単に適用できるものではないからです。私はその知識を磨き、最良の原則を私の外国為替インジケーターに組み込むために数年を費やしました。 このインジケーターは非常に簡単に適用できます。必要なのは、それをチャートに添付し、簡単な取引推奨事項に従うだけです。このインジケーターは常に市場分析の仕事を行い、取引の機会を探します。適切なエントリーポイントを検
これはMT5のインジケーターで、再描画なしで取引に参入するための正確なシグナルを提供します。 外国為替、暗号通貨、金属、株式、インデックスなど、あらゆる金融資産に適用できます。かなり正確な見積もりを提供し、取引を開始して終了するのに最適な時期を教えてくれます。1つのシグナルを処理しただけでインジケーターの元が取れた例の 動画 (6:22)をご覧ください。Entry PointsPro インジケーターの助けを借りたほとんどのトレーダーの最初の1週間の結果が改善しています。 Telegramグループ に登録してください。Entry Points Proインジケーターのメリットは次の通りです。 再描画のないエントリーシグナル 再描画されるインジケーターでは一度表示されたシグナルが削除されて大きな金銭的損失につながることがありますが、これと異なり、表示されて確認されたシグナルは消えることがありません。 エラーなしの取引開始 インジケーターアルゴリズムによって取引を開始する(資産を売買する)理想的な瞬間を見つけることができます。それを使用するすべてのトレーダーの成功率が向上します。 あら
FX Trend NG:次世代マルチマーケット・トレンドインテリジェンス 概要 FX Trend NG は、複数の時間足に対応したプロフェッショナル向けトレンド分析およびマーケット監視ツールです。 市場全体の構造を数秒で把握することができます。 複数のチャートを切り替える必要はありません。どの銘柄がトレンド中なのか、どこでモメンタムが弱まっているのか、そしてどの時間足で強い整合性があるのかを瞬時に確認できます。 ローンチ特別オファー – FX Trend NG を $30(6ヶ月) または $80 永久ライセンス でご利用いただけます。 すでに Stein Investments のユーザーですか? -> メッセージを送信 して、プライベートグループへアクセスしてください。 セットアップや詳細情報が必要ですか? -> Stein Investments 公式ページ をご覧ください。 1. FX Trend NG が他と異なる理由 3ステート・トレンドロジック ― Buy と Sell だけではない • 多くのインジケーターは Buy または Sell の2状態のみを表示します。
マーケットメーカーのためのツール。 Meravith は次の機能を提供します: すべての時間足を分析し、現在有効なトレンドを表示します。 強気と弱気の出来高が等しくなる流動性ゾーン(出来高均衡)を強調表示します。 異なる時間足のすべての流動性レベルをチャート上に直接表示します。 テキスト形式の市場分析を生成し、参考情報として表示します。 現在のトレンドに基づいて目標値、サポートレベル、ストップロスを計算します。 取引のリスクリワード比を算出します。 口座残高に基づいてポジションサイズを計算し、潜在的な利益を推定します。 また、市場に大きな変化があった場合には警告を表示します。 インジケーターの主要ライン: 強気/弱気の出来高エグゾーストライン ― 目標値として機能します。 市場のトレンドを示すライン。市場が強気か弱気かによって色が変わり、トレンドのサポートとして機能します。主にその色が市場センチメントを示します。 出来高均衡ライン(Eq)。Eq(Volume Equilibrium)ラインはシステムの中核です。これは買い手と売り手の出来高のバランスポイントを表します。市場の流動性を示し
SignalTech MT5 is a trading system for EURUSD, USDCHF, USDJPY, AUDUSD, NZDUSD, EURJPY, AUDJPY, NZDJPY, CADJPY H2 and H3 Timeframe.  It can generate signals with Buy/Sell Arrows and Pop-Up/Sound Alerts. Each signal has clear Entry and Stop Loss levels, which should be automatically flagged on the chart, as well as potential Targets 1, 2, and 3. The Entry and TP levels are fixed after the trade is taken. The exit level is dynamic. If there are signs of a potential short-term trend reversal, the
BTMM State Engine Pro is a MetaTrader 5 indicator for traders who use the Beat The Market Maker approach: Asian session context, kill zone timing, level progression, peak formation detection, and a multi-pair scanner from a single chart. It combines cycle state logic with a built-in scanner dashboard so you do not need the same tool on many charts at once. What it does Draws the Asian session range; session times can follow broker server offset or be set in inputs. Tracks level progression (L
Bill Williams Advanced is designed for automatic chart analysis using Bill Williams' "Profitunity" system. The indicator analyzes four timeframes at once. Manual (Be sure to read before purchasing) Advantages 1. Analyzes the chart using Bill Williams' "Profitunity" system. Signals are displayed in a table in the corner of the screen and on the price chart. 2. Finds all known AO and AC signals, as well as zone signals. Equipped with a trend filter based on the Alligator. 3. Finds "Divergence Bar
トレンド スクリーナー インジケーターでトレンド取引の力を解き放ちます。ファジー ロジックと複数通貨システムを活用した究極のトレンド取引ソリューションです。 ファジー ロジックを活用した革新的なトレンド インジケーターである Trend Screener を使用して、トレンド取引を向上させます。 これは、13 を超えるプレミアム ツールと機能、および 3 つの取引戦略を組み合わせた強力なトレンド追跡インジケーターであり、Metatrader をトレンド アナライザーにする多用途の選択肢となります。 期間限定オファー : トレンド スクリーナー インジケーターは、わずか 100 ドルで生涯ご利用いただけます。 (元の価格 50$ ) (オファー延長) Trend Screener の 100% 非再描画精度の揺るぎない精度を体験して、取引の決定が過去の価格変動の影響を受けないようにしてください。 マルチタイムフレームおよびマルチ通貨機能の多用途性を解放し、比類のない自信を持って外国為替、商品、暗号通貨、インデックスの世界を取引できるようにします。 Trend Screener の包括的な
まず第一に、この取引インジケーターは再描画されず、再描画されず、遅延しないことを強調する価値があります。これにより、手動取引とロボット取引の両方に理想的なものになります。 ユーザーマニュアル:設定、入力、戦略。 アトミックアナリストは、価格の強さとモメンタムを利用して市場でより良いエッジを見つけるためのPA価格アクションインジケーターです。ノイズや誤ったシグナルを除去し、取引ポテンシャルを高めるための高度なフィルターを備えています。複雑なインジケーターの複数のレイヤーを使用して、アトミックアナリストはチャートをスキャンし、複雑な数学的計算をシンプルなシグナルと色に変換します。これにより、どのような初心者トレーダーでも理解して使用し、一貫した取引の決定を行うことができます。 「アトミックアナリスト」は、新規および経験豊富なトレーダー向けにカスタマイズされた包括的な取引ソリューションです。プレミアムインジケーターとトップノッチの機能を1つの取引戦略に組み合わせ、すべてのタイプのトレーダーにとって汎用性のある選択肢にします。 デイリートレーディングとスキャルピング戦略:高速で正確なデイ
ご紹介     Quantum Breakout PRO は 、ブレイクアウト ゾーンの取引方法を変革する画期的な MQL5 インジケーターです。 13年以上の取引経験を持つ経験豊富なトレーダーのチームによって開発されました。     クォンタム ブレイクアウト プロ   は、革新的でダイナミックなブレイクアウト ゾーン戦略により、あなたのトレーディングの旅を新たな高みに押し上げるように設計されています。 クォンタム ブレイクアウト インジケーターは、5 つの利益ターゲット ゾーンを備えたブレイクアウト ゾーン上のシグナル矢印と、ブレイクアウト ボックスに基づいたストップロスの提案を提供します。 初心者トレーダーにもプロのトレーダーにも適しています。 量子EAチャネル:       ここをクリック 重要!購入後、インストールマニュアルを受け取るためにプライベートメッセージを送ってください。 推奨事項: 時間枠: M15 通貨ペア: GBPJPY、EURJPY、USDJPY、NZDUSD、XAUUSD アカウントの種類: ECN、Raw、またはスプレッドが非常に低い R
OmniSync Projection
Antonio-alin Teculescu
5 (1)
Chronos Fractal Engine is an innovative price projection indicator for MetaTrader 5, designed to transform your technical analysis by intelligently identifying and projecting historical price patterns. Built upon an advanced correlation algorithm and the fractal principles of the market, this powerful tool visualizes potential future price movements, giving you a unique edge in your trading decisions. What is Chronos Fractal Engine? At its core, the Chronos Fractal Engine employs a sophisticat
FX Power: 通貨の強弱を分析して、より賢い取引を実現 概要 FX Power は主要通貨と金の実際の強弱をあらゆる市場状況で理解するための必須ツールです。強い通貨を買い、弱い通貨を売ることで、 FX Power は取引の意思決定を簡素化し、高い確率の取引機会を見出します。トレンドを追従する場合でも、極端なデルタ値を使用して反転を予測する場合でも、このツールはあなたの取引スタイルに完全に適応します。ただ取引するだけではなく、 FX Power で賢く取引をしましょう。 1. なぜ FX Power がトレーダーにとって非常に有益なのか 通貨と金のリアルタイム強弱分析 • FX Power は主要通貨と金の相対的な強弱を計算し、マーケットダイナミクスに関する明確な洞察を提供します。 • どの資産がリードしているか、または後れを取っているかを監視して、取引するペアを賢く選びましょう。 マルチタイムフレームの包括的なビュー • 短期、中期、長期のタイムフレームで通貨と金の強弱を追跡し、マーケットトレンドに基づいて取引戦略を調整できます。 • スキャルピングからスイングトレード
あなたのシンボルでどの戦略が実際に機能するか確認しましょう - リアルマネーをリスクにさらす前に。 Power Barは、あらゆるシンボルとあらゆるタイムフレームで 極端な価格バー を検出し、3つの異なるトレード戦略を即座にバックテストします。勝率、プロフィットファクター、損益を並べて比較できます。すべてが1つのインタラクティブなパネルに集約されています。 推測なし。カーブフィッティングなし。データだけです。 Power Barが特別な理由 ほとんどのインジケーターはシグナルを出すだけで、それが機能するかどうかは推測に任されます。Power Barはさらに先を行きます - すべてのシグナルを 3つの戦略 に対してテストし、統計を表示します。FlipFlop、Momentum、Reversalをワンクリックで切り替え、数値が即座に変化するのを確認できます。 FlipFlop - 常にポジションを保有。シグナルでエントリーし、反対シグナルでイグジット。当社のリサーチでは、US30、US500、DAXなどのトレンドのあるインデックスで最も効果的です。 Momentum - シグナルの方向に
まず正直に言いましょう。 どんなインジケーターも、それ単体であなたを利益化させることはできません。もしそう言う人がいるなら、それは夢を売っているだけです。完璧な売買シグナル(矢印)を表示するインジケーターは、いくらでも“完璧に見せる”ことができます。正しい過去の区間を拡大して、勝ちトレードだけを切り取ればいいだけです。私たちはそれをしません。 SMC Intraday Formula はツールです。 市場構造を読み取り、最も高い確率の価格ゾーンを特定し、今この瞬間のスマートマネーの痕跡をシンプルな言葉で正確に示します。最終判断はあなたが行います。トレードを実行するのもあなたです。しかし今は「希望」ではなく「精度」でエントリーできます。 私たちはこのインジケーターを、ゴールド(XAUUSD)および主要FX通貨ペアで約3年間、日々のスキャルピングに使用してきました。M1、M5、M15、M30の主要ツールです。これは未来を予測しようとするのではなく、今まさに形成されている高確率セットアップを示し、その理由を説明します。 他のすべてのインジケーターと何が違うのか? ほとんどのトレーディングイ
Market Structure Order Block Dashboard MT5 は、市場構造と主要な価格反応ゾーンをチャート上で直接読み取りたいトレーダー向けに設計された MT5 インジケーターです。BOS、ChoCH、オーダーブロック、Fair Value Gap (FVG)、流動性、Kill Zones、Volume Profile、そして素早い分析のためのコンパクトなダッシュボードを組み合わせています。 本インジケーターは、市場構造、ICT、Smart Money の概念を意思決定の枠組みとして使用するトレーダーを対象としています。トレンド継続、反転の可能性、価格の不均衡、流動性ターゲット、注目ゾーンをより構造的に特定する助けとなります。 購入者向けの付属リソース 購入後、MQL5 のプライベートメッセージにてご依頼いただくと、完全な PDF ユーザーガイドとパラメータ設定のヒントを提供いたします。MQL5 のプライベートメッセージによる直接的な技術サポート。 バージョン 1.20 では 2 つの重要な追加機能があります: Pending BOS / Pending Cho
Berma Bands
Muhammad Elbermawi
5 (8)
Berma Bands (BBs) インジケーターは、市場のトレンドを特定して活用したいトレーダーにとって貴重なツールです。価格と BBs の関係を分析することで、トレーダーは市場がトレンド段階にあるか、レンジ段階にあるかを判断できます。 詳細については、[ Berma Home Blog ] をご覧ください。 バーマ バンドは、上部バーマ バンド、中部バーマ バンド、下部バーマ バンドの 3 つの異なる線で構成されています。これらの線は価格の周りにプロットされ、全体的な傾向に対する価格の動きを視覚的に表します。これらのバンド間の距離から、ボラティリティや潜在的な傾向の反転についての洞察を得ることができます。 バーマ バンドの線がそれぞれ離れると、市場が横ばいまたはレンジ相場の期間に入っていることを示すことがよくあります。これは、明確な方向性の偏りがないことを示しています。トレーダーは、これらの期間中にトレンドを特定するのが難しいと感じる可能性があり、より明確なトレンドが出現するまで待つ場合があります。 バーマ バンドの線が 1 本の線に収束すると、強いトレンド環境の兆候となること
Crystal Heikin Ashi Signals - Professional Trend & Signal Detection Indicator Advanced Heikin Ashi Visualization with Intelligent Signal System for Manual & Automated Trading Final Price: $149 ---------> Price goes up $10 after every 10 sales . Limited slots available — act fast . Overview Crystal Heikin Ashi Signals is a professional-grade MetaTrader 5 indicator that combines pure Heikin Ashi candle visualization with an advanced momentum-shift detection system. Designed for both manual traders
Gartley Hunter Multi - An indicator for searching for harmonic patterns simultaneously on dozens of trading instruments and on all possible timeframes. Manual (Be sure to read before purchasing) | Version for MT4 Advantages 1. Patterns: Gartley, Butterfly, Shark, Crab. Bat, Alternate Bat, Deep Crab, Cypher 2. Simultaneous search for patterns on dozens of trading instruments and on all possible timeframes 3. Search for patterns of all possible sizes. From the smallest to the largest 4. All fou
ARICoin is a powerful trading companion designed to generate high-probability entry signals with dynamic TP/SL/DP levels based on volatility. Built-in performance tracking shows win/loss stats, PP1/PP2 hits, and success rates all updated live. Key Features: Buy/Sell signals with adaptive volatility bands Real-time TP/SL/DP levels based on ATR Built-in MA Filter with optional ATR/StdDev volatility Performance stats panel (Success, Profit/Loss, PP1/PP2) Alerts via popup, sound, push, or email Cust
FX Levels: あらゆる市場における非常に高精度なサポート&レジスタンス 概要 通貨ペア、株式指数、個別銘柄やコモディティなど、どのような市場でも信頼できるサポートとレジスタンスを特定したいですか? FX Levels は伝統的な “Lighthouse” メソッドと先進的な動的アプローチを融合し、ほぼ汎用的な精度を実現します。ブローカーの実務経験を活かし、自動化されたデイリー更新とリアルタイム更新を組み合わせることで、 FX Levels は反転ポイントを見つけ、利益目標を設定し、自信をもってトレードを管理するための手助けをします。今すぐ試してみて、サポート/レジスタンス分析の正確性がどれほどトレードを向上させるかを実感してください! 1. FX Levels がトレーダーにとって非常に有用な理由 非常に正確なサポート&レジスタンスゾーン • FX Levels は異なるブローカー環境でもほぼ同一のゾーンを生成するよう設計されており、データフィードの差異や時刻設定のずれによる不一致を解消します。 • つまり、どのブローカーを利用していても一貫したレベルが得られるため、戦
作者のその他のプロダクト
Gold Asian Breakout  — Multi Session Expert Advisor Trend-Filtered Breakout Strategy | MetaTrader 5 | XAUUSD What is Gold Asian Breakout Pro? Gold Asian Breakout Pro is a fully automated Expert Advisor designed specifically for gold (XAUUSD) trading. The EA utilizes a proven Asian session range breakout strategy — one of the most repeatable and stable formations in the gold market. The system automatically identifies the Asian session price range (High/Low) each day, then opens positions when
MTF MADashboard Pro
Wojciech Jerzy Magda
5 (1)
MTF MA Dashboard Pro v1.04 - 日本語 MTF MA Dashboard Pro v1.04 - プロフェッショナル・マルチタイムフレーム移動平均線アナライザー MT5向けの高度なテクニカルインジケーターで、インテリジェントなゴールデンクロス/デッドクロス検出と完全にカスタマイズ可能なビジュアルダッシュボードを備えた包括的なマルチタイムフレーム移動平均線分析を提供します。 タイムフレームの切り替えをやめましょう!最大4つのタイムフレームを同時に分析し、トレンドの一致を瞬時に発見できます。 主要機能 マルチタイムフレーム分析 最大4つのタイムフレームを同時に監視(M1-MN1 + カスタム期間) 各タイムフレームを独立して設定可能 すべてのタイムフレームでリアルタイム同期 あらゆるシンボルで動作(FX、ゴールド、指数、暗号通貨) デュアルMAシステム タイムフレームごとに2本の移動平均線(ファストとスロー) 期間:1-500(完全にカスタマイズ可能) 方式:SMA、EMA、SMMA、LWMA 適用価格:終値、始値、高値、安値、中央値、典型
FREE
​ ️️️CandleIntelligence MTF MA Combined Pro v3.22 ️️️ - Professional Japanese Candlestick Analysis System What Is This Indicator? CandleIntelligence MTF MA Combined Pro is an advanced educational tool combining candlestick pattern analysis with Moving Average context across multiple timeframes. The indicator recognizes 11 key Japanese candlestick formations and presents them in the context of market trend, Swing High/Low levels, and position relative to moving averages. Main Features
FREE
Engulfing Pattern EA v7 - 日本語 Engulfing Pattern EA v7は、MetaTrader 4向けの完全自動売買システムで、クラシックな包み足パターン認識と高度なテクニカル分析、マルチレイヤーフィルターシステムを組み合わせています。このロボットは最大限の柔軟性を持って設計されており、43の設定可能なパラメータにより、取引スタイル、取引商品、市場条件に合わせて戦略のあらゆる側面をカスタマイズできます。 推奨通貨ペア:USD/JPY — EAはUSD/JPY向けに特別に最適化およびテストされており、このペアで優れた結果を示しています。 ️ 重要:通貨ペア間のpip表示の違い 異なる商品でEAを使用する前に注意深くお読みください: ブローカーと通貨ペア間の価格表示システムの違いにより、同じpip値が異なる形で表示される場合があります: USD/JPY、EUR/JPY — 小数点以下2桁または3桁(例:150.00または150.000)— 10 pipsは10または100と表示 EUR/USD、GBP/USD、AUD/USD — 小数点以下4桁または5
​              ️️️  Engulfing V8 PRO️️️ V8 is an advanced trading system created for traders who prioritize stability and safety over risky strategies. The algorithm is not a "black box" – it is built upon the classic, decades-proven Price Action pattern: Bullish and Bearish Engulfing. Unlike simple indicators, this EA utilizes Multi-Timeframe (MTF) logic. The entry signal is generated on a lower timeframe (e.g., M30) but is filtered by the trend from a higher timeframe (e.g., H4). Thanks
Price Action Scalper Pro Professional Scalping Robot based on Price Action ENTRY METHODS The robot offers a flexible entry system that can be customized to your own strategy: Swing Detection Swing High / Swing Low - the robot automatically detects key reversal points on the chart. Configurable parameters allow you to set how many candles on the left and right side confirm a swing. Swing Confirmation mode opens a position only when the swing is fully confirmed. Price Action Patterns En
Candle Breakout Build your own breakout strategy — choose candle size, filters and position management What is Candle Breakout? Candle Breakout is an Expert Advisor based on the candle range breakout strategy . It gives you the tools to build your own strategy — you decide what candle size you're interested in, which trend filters to enable, how to manage your position and what risk you accept. You build the strategy, the EA executes it. Choose your candle size — set minimum and maximum range i
フィルタ:
レビューなし
レビューに返信