DailyHit
- Indicators
- Version: 1.1
- Updated: 25 November 2025
- Activations: 5

Read carefully, because I’m about to sell my strategy based on over 11 years of study:
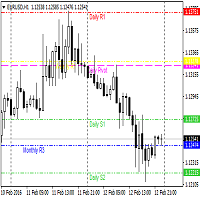
- This indicator plots multiple levels: thick and dotted, taking the ATR into account.
- On 90% of trading days, it touches one thick level and one dotted level.
- Levels are updated daily.
- If the price touches a thick level and a dotted level in a single day, trading for that day is over—you wait for the next day to look for the same setup.
- If the price comes very close to a level but doesn’t reach it, it’s likely to move toward another thick or dotted level, but always aiming for one thick and one dotted level.
- These touches occur from the market opening of whichever market you trade, but it has only been analyzed for the DAX, Nasdaq, and SP500. I don’t know if it will work for other markets.
- That is, from the European market opening for the DAX, and from the U.S. market opening for the Nasdaq and SP500. Trading outside these ranges does not guarantee results.
*This indicator is for analysis purposes only; trading with it is at your own risk. Profits are not guaranteed.*The rectangles and the green check marks in the screenshots are not part of the indicator.
Recommendation: Analyze on 30-minute charts for DAX, SP500, and Nasdaq during their trading hours, when volatility is higher.
You can also use it alongside other favorite indicators you already have.
Before purchasing, I encourage you to test it.
In the indicator settings, you can select how many periods you want to see. Change it as you like to test it.
Before purchasing, I encourage you to test it.