
Scanner for news event and economic calendar
- Experts
-
Mark Nicole Olarte
 Why Work With Me?
I don't just write code — I build trading solutions that work. With years of hands-on experience in the MetaTrader ecosystem, I specialize in transforming complex trading strategies into fully automated systems that trade for you 24/5.
What I Do Best: - Version: 3.0
- Updated: 22 March 2026
- Activations: 5
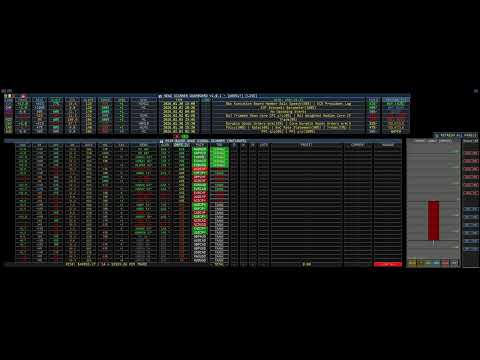
The first statistical MT5 dashboard designed to scan news events and economic calendars using mathematical probability.
THE SEVEN PILLARS: THE COMMANDMENTS OF PROFITThis system does not just look at news; it analyzes the science of market reactions through seven elite pillars:
1. Power (Math) This is the heartbeat of the market. Using a proprietary Net Score calculation, the system boils down complex momentum into a single number. You see the power shift before the candle even finishes.
- Technical Breakdown: The engine identifies every news event for the week and cross-references them with a 3-year rolling buffer of institutional biases. If an event has a 74% historical bullish bias, it is multiplied by its impact weight (High, Med, or Low). The Net Score is the mathematical sum of all assigned weights for the week.
2. Beat Percentage The Beat pillar tracks how madly a currency’s news events actually exceed market expectations.
- Technical Breakdown: This metric tracks surprise momentum. It compares actual data against the analyst consensus (Forecast). If 8 out of 10 reports came in higher than expected, the Beat percentage is 80%, indicating the currency is in an Economic Beat Phase.
3. W-Hit (Win-Hit Rate) The Win-Hit rate is a probability shield. It tells you the exact percentage of historical news events that resulted in a profitable move.
- Technical Breakdown: The engine scans the last 12 weeks of historical data and checks if the identified news bias actually resulted in a candle closing in that same direction. A 75% hit rate tells you the market is respecting the fundamentals for that currency.
4. Dev (Deviation) Deviation measures the volatility or the "fuel" of profit. High deviation indicates explosive moves, while low deviation suggest a quiet market.
- Technical Breakdown: This measures the blast radius. It calculates the mathematical gap between the Forecast and the Actual result over the last 6 months of high-impact news. A high score identifies which currency is most likely to produce fast-moving gaps.
5. W-ATR (Volatility) Market context is everything. This pillar tracks the current Average True Range (ATR) relative to historical norms.
- Technical Breakdown: It uses 12 weekly candlesticks to calculate the average move. By comparing the current movement to this long-term average, it reveals how much "gas is in the tank" for potential expansion.
6. Sync Percentage Sync measures how perfectly a currency is moving in correlation with its basket.
- Technical Breakdown: It calculates institutional consensus by weighing the direction of all events scheduled for the week. If a currency has multiple high-impact buy events and zero sell events, the Sync is 100%, indicating unanimous fundamental pressure.
7. Streak Momentum is like a freight train. The Streak pillar counts consecutive winning candles to confirm trend support.
- Technical Breakdown: It scans the last 10 weekly candles. A positive streak (e.g., +4) confirms institutional support, while an extreme streak (+5 or more) warns of potential over-extension.
- Curr: Color-coded currency identification for instant recognition.
- News: Precise counts of High, Medium, and Low impact events.
- Time: A precision countdown to the next major event.
- Link: Institutional confluence showing where big money is stacking bets.
- History: A scrollable window of every recorded Beat and Miss.
- Edge Percentage: Your statistical advantage; scores over 70% indicate high-probability odds.
- Outlook: A professional-view summary of overall sentiment.
The Pair Scanner automatically matches the strongest currencies against the weakest ones.
- Alignment: Checks if the H1, D1, and W1 timeframes are pointing in the same direction.
- Confluence Percentage: Combines all 7 pillars into one final score.
- Trade Stats: Real-time tracking of daily, weekly, and monthly performance.
- Management: Instant precision buttons for execution and copying.
Focus your entire trading existence on the progress of the current weekly candle. This panel removes chart fatigue by focusing on one move and one expansion.
- Visual Pulsing: Observe the bid price as it pulses within the candle body.
- Professional Design: An institutional-style visual that makes every movement clear.
- Strategic Focus: Instead of watching multiple timeframes, you catch the weekly expansion and finish your work for the week.
This is a comprehensive risk management system designed to protect your capital:
- Smart Lot Division: Automatically calculates size based on your balance.
- Hard Stop Losses: Every trade setup includes a pre-calculated safety net.
- Statistical Filtering: The system stays flat when probability scores are low.
- Dynamic Confluence: Requires multiple points of alignment before generating a signal.
Risk Warning: Trading financial markets involves significant risk. No system can guarantee profits. Use the tools provided to trade responsibly.


















I bought this indicator. At first glance, it looks very professional, but there is no manual. For some pairs, it shows a test trade in green, and when you click on it, a position is opened. However, it doesn’t say anywhere when you should open a position. I am still waiting for a proper guide.