Weekday Stats
- 指标
- 版本: 1.10
- 更新: 9 九月 2025
- 激活: 20

Weekday Stats
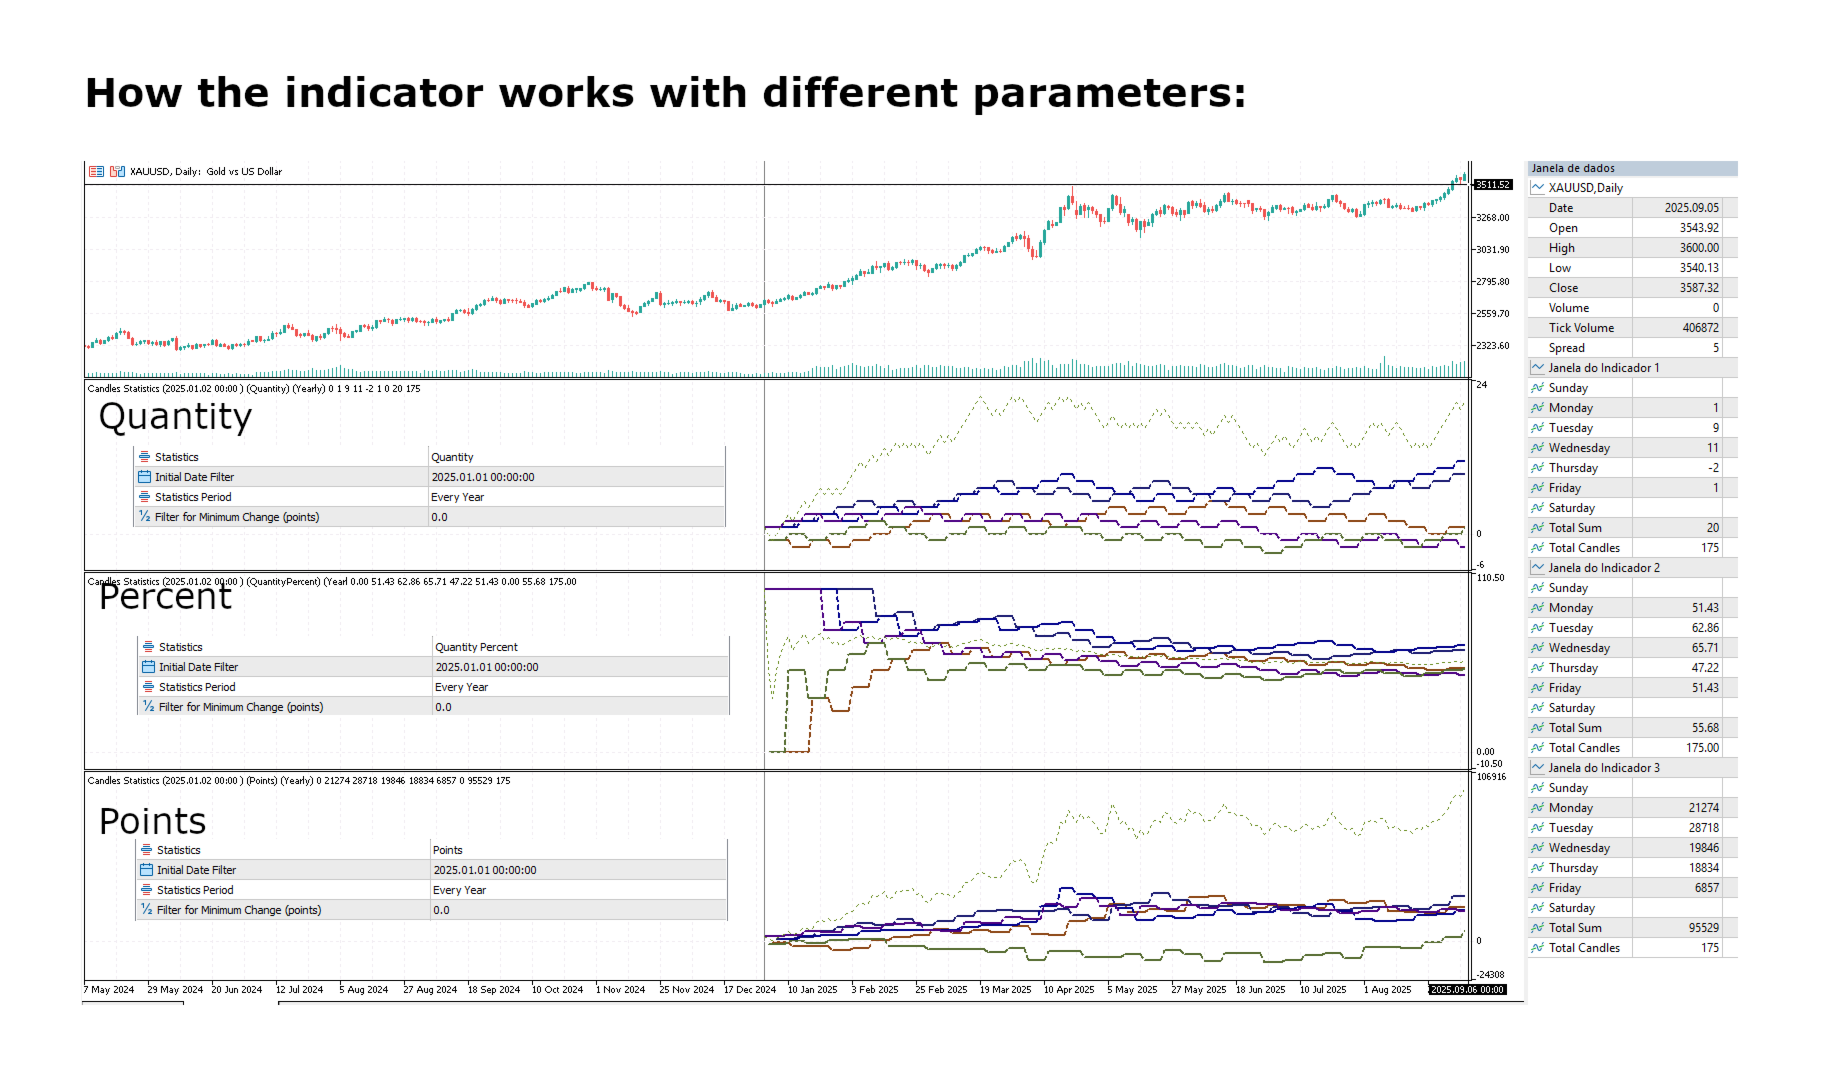
Overview: A Price Analysis Indicator by weekday. A quantitative technical analysis indicator developed for statistical analysis of price variations, with data classified by weekday. This indicator processes candle data and displays statistical results based on user input parameters. The input parameters allow defining the type and frequency of the statistics to be calculated. This indicator provides a quantitative basis for identifying market patterns.
Output Data: The indicator calculates and displays three main statistical properties for each day of the week:
-
Directional Candle Variation: The balance of positive (bullish) candles minus negative (bearish) candles.
-
Percentage of Positive Candles: The percentage ratio between the total number of positive candles and the total number of candles sampled in the period.
-
Total Points: The result of the sum of points from positive candles subtracted from the sum of points from negative candles.
Sampling Period Configuration: The user can define the time period for the calculation of statistics through the input parameters. Options include:
-
Full History (Never): Sampling from the beginning of the asset's historical data series.
-
Yearly (Every Year): Sampling restricted to the data of the current calendar year.
-
Monthly (Every Month): Sampling restricted to the data of the current calendar month.
Data Filters: The sampling can be filtered by a minimum variation in points, defining a cut-off value for the inclusion of candles in the statistical calculations. This allows for the exclusion of candles with low volatility.
Timeframe Restrictions: The statistics timeframe depends on the chart's timeframe and the input parameters. (If the chart is on M1, the statistics will be for M1 candles, and so on). The indicator is not compatible with timeframes higher than D1, such as weekly (W1) or monthly (MN), due to its weekday classification methodology.
Visualization: Data Window: The data window shows the data related to the selected statistical parameters and the statistical calculations of the historical candle sampling.
Data Sampling Start: The indicator shows the start of the historical series at the top of the sub-window. Sometimes the start of the historical series may be different from the one requested by the input parameter. To check if the data was obtained correctly, verify the initial date on the indicator. If the initial date is different from the one you requested, check if the asset has the requested data history and if your platform's configuration allows for unlimited data history.
Alerts:
-
For some reasons, the data range of the data used may be different from the one requested by the input parameter. This can occur for a few reasons: 1.1 The platform is configured to limit the maximum number of historical candles. Check the maximum number of bars allowed in the history in your platform's configuration. 1.2 The chart symbol does not have old data.
-
-
Since this indicator counts the variation of candles in relation to the day of the week, it does not work on timeframes greater than D1 (weekly and monthly timeframes, for example).
-