Market Squeeze Momentum Indicator
- Indicators
- Quang Huy Quach
- Version: 1.2
1. Introduction
The Market Squeeze Momentum Indicator (SQZMOM_LB) is a powerful technical analysis tool designed to help traders identify periods of low market volatility (the "squeeze" phase) and predict the direction and strength of price momentum after the squeeze ends. This indicator combines the principles of Bollinger Bands and Keltner Channels to detect changes in market volatility, along with a momentum oscillator to measure buying/selling pressure.
2. Key Components of the Indicator
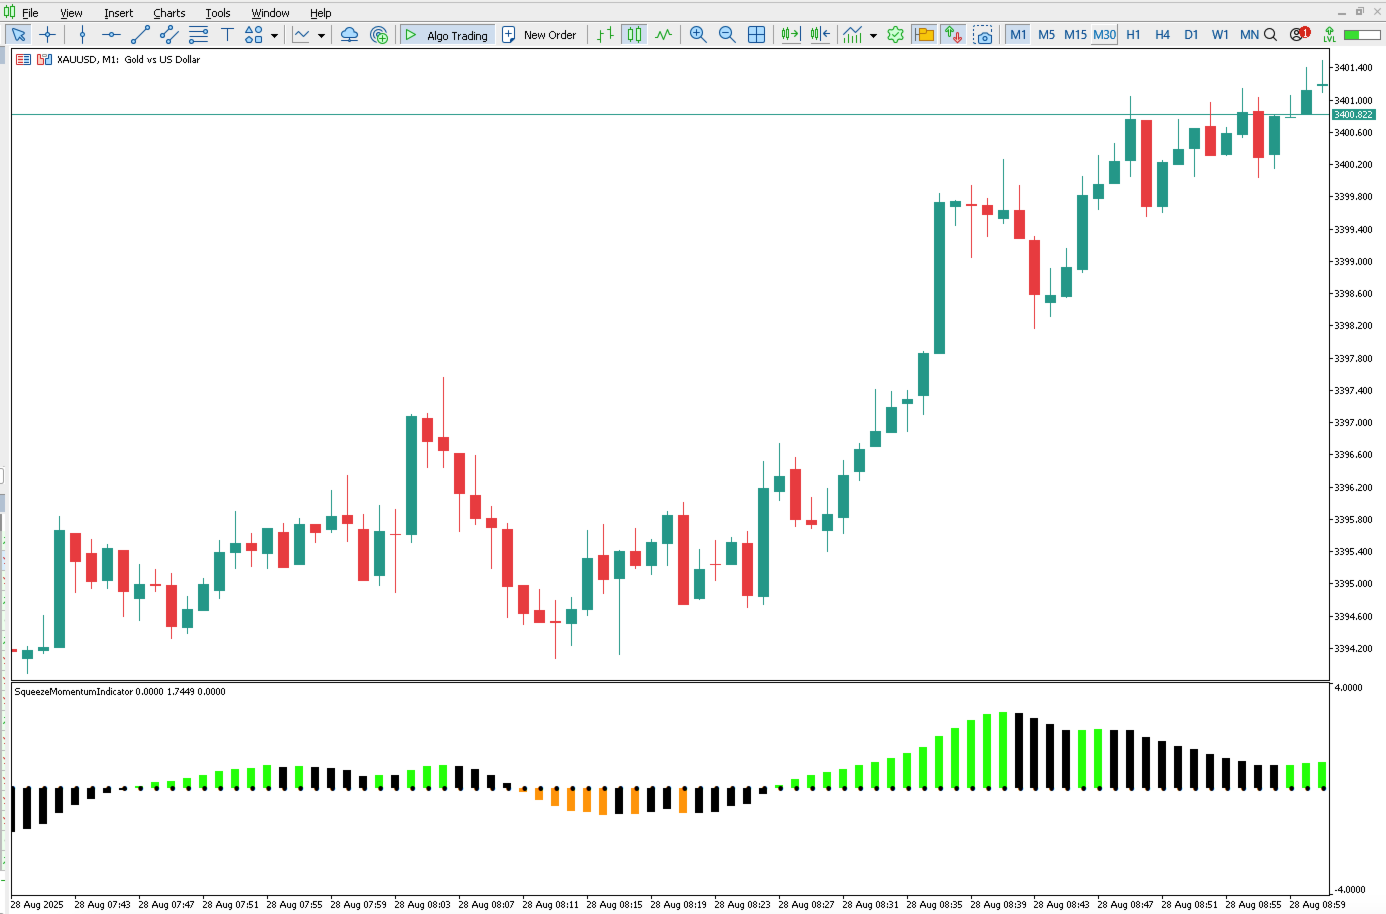
The Market Squeeze Momentum Indicator is displayed in a separate window below the price chart and consists of two main components:
2.1. Squeeze Dots
These are small dots located on the indicator's zero line, representing the market's volatility state:
- Black Dots (Squeeze On): Appear when the market is in a "squeeze" phase. This occurs when the Bollinger Bands are entirely within the Keltner Channels, indicating very low volatility. This is a phase of energy accumulation, often signaling a significant price move is imminent.
- White Dots (Squeeze Off / Release): Appear when the market exits the squeeze phase. This occurs when the Bollinger Bands expand outside the Keltner Channels, indicating increasing volatility. This is the most important signal of the indicator, suggesting a strong price move may be about to begin.
- Yellow Dots (No Squeeze): Appear when the market is neither in a clear squeeze nor a clear release. This represents an intermediate or undefined state.
2.2. Momentum Histogram
These are colored bars that represent price momentum. The height of the bar indicates the strength of the momentum, and the color indicates the direction and change in momentum:
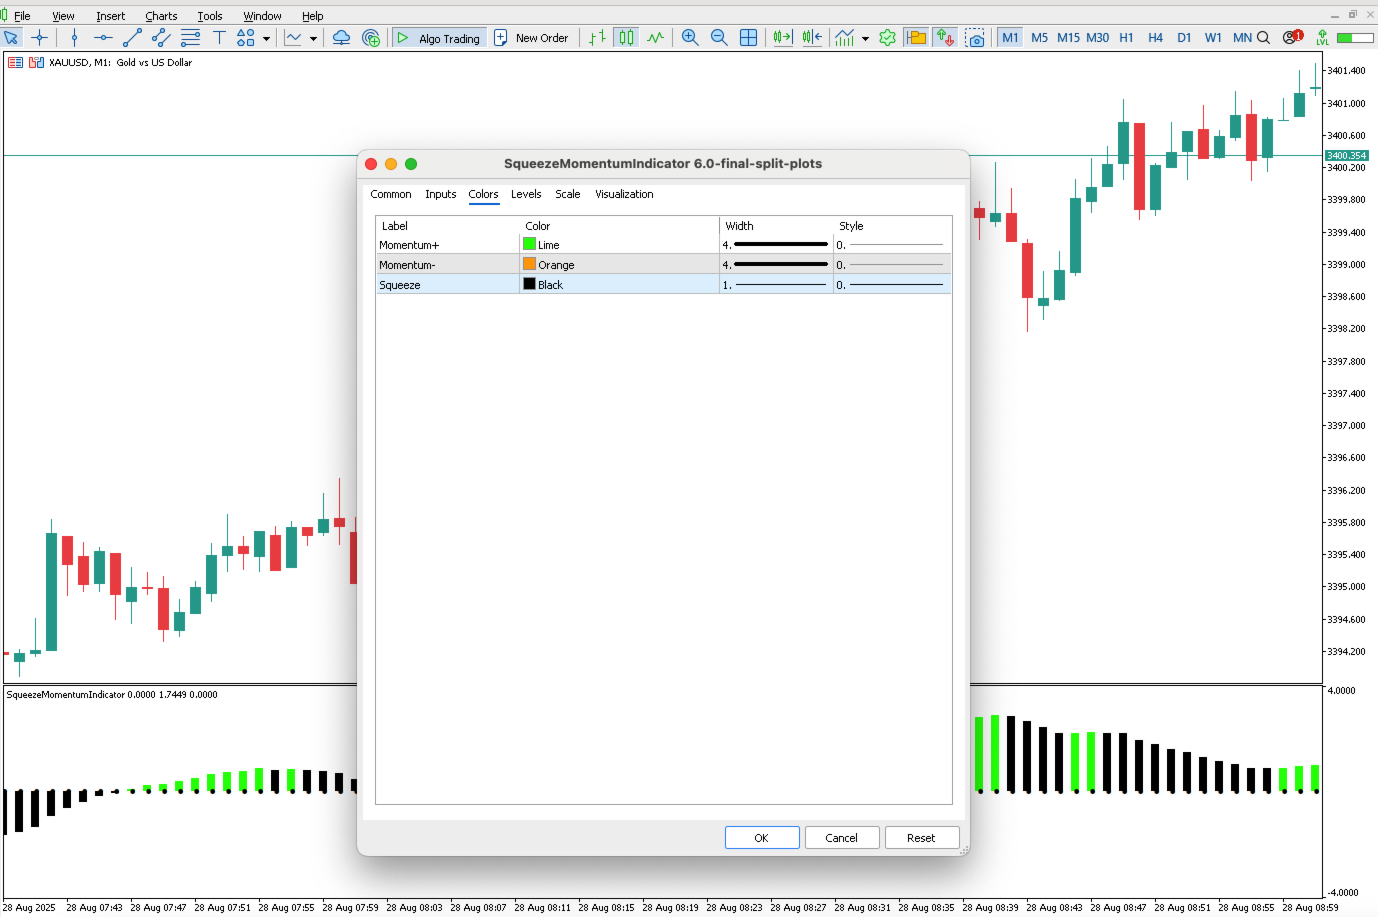
- Bright Green Bars (Lime): Positive momentum (price is rising) and strengthening.
- Dark Green Bars (Green): Positive momentum (price is rising) but weakening (may be nearing a reversal or consolidation).
- Orange Bars (Orange): Negative momentum (price is falling) and strengthening (falling deeper).
- Gold Bars (Gold): Negative momentum (price is falling) but weakening (may be nearing a reversal or bounce).
3. How to Apply the Market Squeeze Momentum Indicator in Trading
This indicator should not be used in isolation but in conjunction with other technical analysis tools. Here's how to use it effectively:
3.1. Identifying Entry Signals
The primary signal for considering an entry is the transition from Black Dots to White Dots (Squeeze Off). This indicates that the market has accumulated enough energy, and a significant price move is likely to occur.
- After White Dots appear:
- If the histogram turns Bright Green (Lime): This is a strong signal that upward momentum is beginning. Consider a Buy (Long) entry.
- If the histogram turns Orange: This is a strong signal that downward momentum is beginning. Consider a Sell (Short) entry.
3.2. Assessing Momentum Strength and Change
- Strong Momentum: Bright Green (Lime) or Orange bars indicate strong momentum in that direction.
- Weakening Momentum:
- When Bright Green bars turn into Dark Green bars: Upward momentum is weakening.
- When Orange bars turn into Gold bars: Downward momentum is weakening. These are important signs to consider taking profits or tightening stop-loss levels.
3.3. Identifying Exit Signals
- Profit Taking / Tightening Stop Loss: When momentum begins to weaken (transition from a brighter to a darker shade in the same direction), this can be a signal to take partial or full profits, or to move your stop-loss to protect gains.
- Momentum Reversal: When the histogram crosses from positive to negative (or vice-versa), this is a clear momentum reversal signal, which may warrant exiting a trade or even reversing your position.
4. Important Considerations
- Combine with Other Tools: The Market Squeeze Momentum Indicator works best when used with trend-identifying tools, support/resistance levels, or other confirming indicators.
- Not a Perfect Signal: No indicator is foolproof. False signals can occur.
- Timeframes: The indicator can be used on various timeframes, but effectiveness and signal frequency may vary.
- Risk Management: Always adhere to strict risk management principles.