ColorWave Multi MA
- Indicators
- simple077
- Version: 1.0
- Activations: 15
ColorWave Multi MA
The ColorWave Multi MA is a highly configurable Moving Average (MA) indicator, with some advanced features:
1. Purpose of the indicator
-
It draws a moving average line on the chart.
-
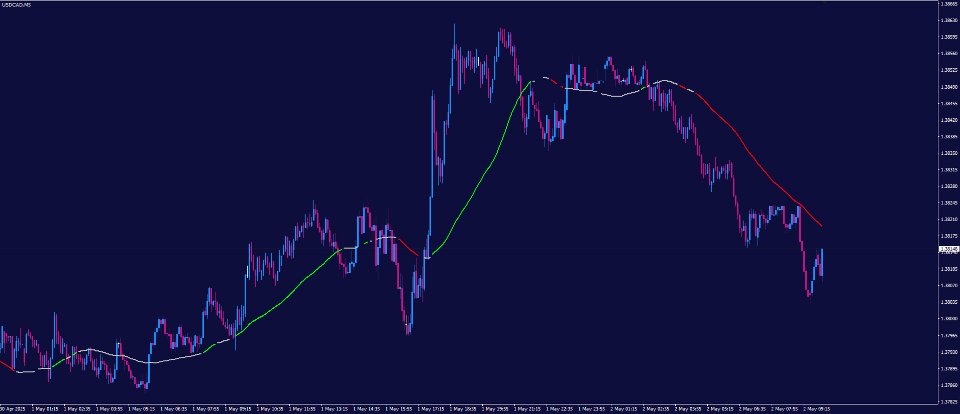
Instead of a single color, it splits the MA into three line segments:
-
Up (green) when the MA is rising,
-
Down (red) when the MA is falling,
-
Flat (gray, dotted) when the MA is flat within a threshold.
-
It supports many MA types, not just the standard SMA/EMA.
This is useful for traders because it visually shows trend direction and flat (sideways) markets more clearly than a normal MA.
2. User Inputs
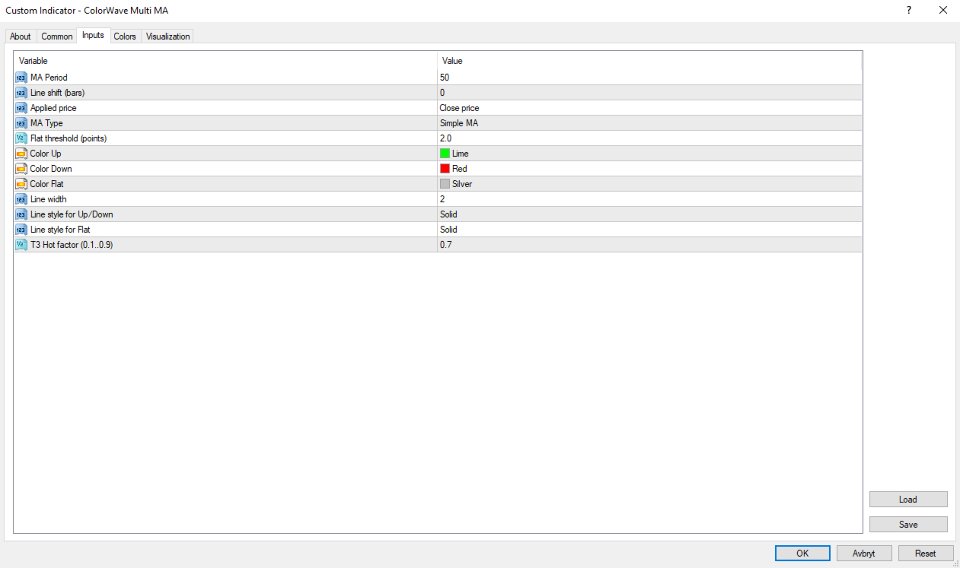
You have a lot of customization:
-
Period (InpPeriod) → How many bars to use in calculation.
-
Shift (InpShift) → Moves the MA left/right on the chart.
-
Applied price (InpAppliedPrice) → Choose Close, Open, High, Low, Median, Typical, Weighted.
-
MA type (InpMAType) → One of 8 types:
-
SMA, EMA, SMMA, LWMA, DEMA, TEMA, HMA, T3.
-
Flat threshold (InpFlatPoints) → Defines what “flat” means. Example: 0.5 points means if slope is smaller than 0.5 pipette, it’s flat.
-
Colors (InpColorUp, InpColorDown, InpColorFlat) → Different for up, down, flat.
-
Line width (InpLineWidth) and styles (InpLineStyle, InpFlatStyle).
-
T3 hot factor (InpT3Hot) → Parameter for the special T3 moving average.
3. How it calculates
The code does 3 main things inside OnCalculate():
-
Prepares price array
-
Gets the price (close/open/etc.) for each bar and stores in PriceArr.
-
Computes the moving average
-
Depending on InpMAType, it calls the right function:
-
ComputeSMA() = simple average.
-
ComputeEMA() = exponential.
-
ComputeSMMA() = smoothed.
-
ComputeLWMA() = weighted.
-
ComputeDEMA() = double EMA = 2×EMA1 – EMA2.
-
ComputeTEMA() = triple EMA = 3×EMA1 – 3×EMA2 + EMA3.
-
ComputeHMA() = Hull MA (fast-reacting, smooth).
-
ComputeT3() = Tim Tillson’s T3, very smooth.
-
Classifies slope (Up, Down, Flat)
-
It looks at current MA value (current_ma) and previous MA value (prev_ma).
-
Slope = current_ma - prev_ma.
-
If slope > threshold → UpBuffer gets the MA value.
-
If slope < -threshold → DownBuffer gets the MA value.
-
If |slope| ≤ threshold → FlatBuffer gets the MA value.
Since each buffer is drawn with different style/color, the line is automatically segmented.
4. Buffers and drawing
-
MT4 indicators use buffers to store values for drawing.
-
You have 3 buffers:
-
UpBuffer[] (green solid)
-
DnBuffer[] (red solid)
-
FlBuffer[] (gray dotted)
At each bar, only one buffer gets a value (others get EMPTY_VALUE).
This makes the line appear in 3 colors depending on slope.
5. Special details
-
No repainting:
-
It doesn’t recalc historical values incorrectly.
-
The only value that can change is the last bar, same as a normal MA.
-
Flat detection:
-
Controlled by InpFlatPoints.
-
On a 5-digit broker, 10 points = 1 pip.
-
If you set 0.5, it means half a pipette sensitivity → very sensitive flat detection.
-
Performance:
-
It optimizes recalculation: only recalculates the newest bars, not everything every tick.
-
Advanced MA formulas:
-
Includes non-standard averages (Hull, DEMA, TEMA, T3).
-
Makes it more powerful than built-in MT4 MAs.
6. What you will see on chart
-
A moving average line that changes color and style:
-
Green solid → trend up,
-
Red solid → trend down,
-
Gray dotted → flat sideways.
-
The transitions between colors show where slope changes.
✅ In short:
This is a multi-type adaptive moving average that visually marks trend direction and flat conditions with color-coded segments. It’s much clearer than a regular MA because it tells you not only where the average is but also whether the market is trending or ranging.
