Predator Supply Demand volume zones

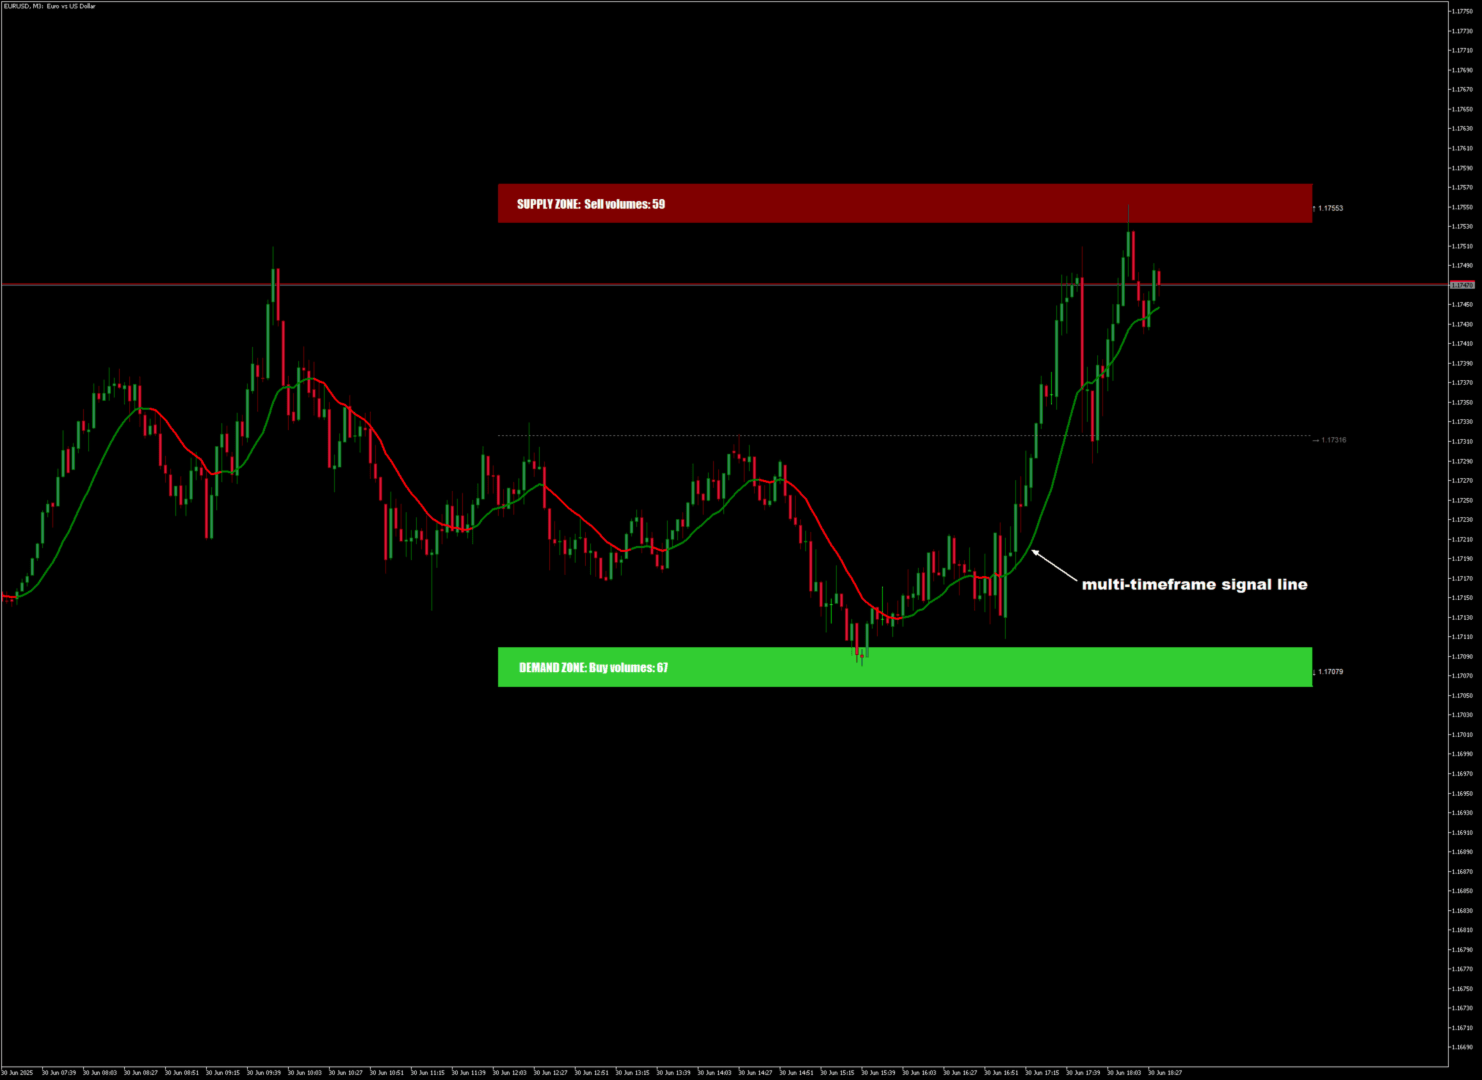
Supply Demand Volume Zones — Institutional Support & Resistance levels with Bull/Bear Pressure

Supply Demand Volume is a precision tool designed to automatically detect key supply and demand zones based on price structure, volume analysis, and real-time volatility. Built for traders who rely on accurate support and resistance levels, supply and demand order flow, Wyckoff schematics, or Smart money concepts, this indicator offers enhanced insights by showing buy vs. sell Volumes and marking potential reversal signals.

 Key Features:

  •  Automatic Zone Detection – Identifies the most relevant high institutional volume support and resistance areas, confirmed by historical highs/lows, and Average True Range.

  • Bull/Bear Volume Analysis – Displays real-time dominance between bulls and bears, helping you confirm trade direction.

  •  Midline and Price Labels – Mid-zone guidance with customizable color-coded labels and level markers.

  •  Time-Based Zone Extension – Zones auto-extend into the future for continued relevance without redrawing.

🧠 Ideal For:

  • Reversal Traders

  • Breakout Traders

  • Volume/Price Action Traders

  • Scalping & Intraday Strategies

  • If buy volume is greater than sell volume, price is likely to break above the supply zone. If sell volume is greater than buy volume, price may break below the demand zone. If both are equal, the market is likely to consolidate or bounce between the two levels.

    NOTE: Should not be used as a stand-alone indicator. Include other confirmations such as RSI, TDI, SQUEEZE MOMENTUM, MA, Stochastic Oscillator, Candlestick patterns etc. 


🖥️ Compatible With:

  • All symbols (Forex, Indices, Metals, Crypto)

  • All timeframes (M1 to MN)

Take control of your charts.
Let Predator Supply Demand Volume zones screener map out hidden volume zones and turn raw price action into actionable intelligence.

🚀 Optimize your entries. Validate with volume. Trade with confidence.


Recommended products
Was: $249  Now: $99   Market Profile defines a number of day types that can help the trader to determine market behaviour. A key feature is the Value Area, representing the range of price action where 70% of trading took place. Understanding the Value Area can give traders valuable insight into market direction and establish the higher odds trade. It is an excellent addition to any system you may be using. Inspired by Jim Dalton’s book “Mind Over Markets”, this indicator is designed to suit the
Volume Profile V6
Andrey Kolesnik
4.67 (3)
The volume profile indicator of the market + a smart oscillator. It works on almost all instruments-currency pairs, stocks, futures, cryptocurrency, on real volumes and on tick ones. You can set both the automatic definition of the profile range, for example, for a week or a month, etc., and set the range manually by moving the boundaries (two vertical lines red and blue). It is shown as a histogram. The width of the histogram at this level means, conditionally, the number of transactions condu
The SMC Venom Model BPR indicator is a professional tool for traders working within the Smart Money (SMC) concept. It automatically identifies two key patterns on the price chart: FVG   (Fair Value Gap) is a combination of three candles, in which there is a gap between the first and third candles. It forms a zone between levels where there is no volume support, which often leads to a price correction. BPR   (Balanced Price Range) is a combination of two FVG patterns that form a “bridge” - a zon
Supply and Demand Indicator + FREE Currency Strength Meter ADD-ON Looking for a powerful tool that can help you identify the most reactive zones in the forex market? Our supply and demand indicator for MetaTrader 4 and 5 is exactly what you need. With its advanced algorithms and real-time analysis, this indicator helps traders of all experience levels make informed trading decisions. The supply and demand indicator is a cutting-edge tool that helps traders identify areas where buyers and sellers
PivotWave
Jeffrey Quiatchon
Introducing PivotWave – your ultimate trading companion that redefines precision and market analysis. Designed with traders in mind, PivotWave is more than just an indicator; it’s a powerful tool that captures the pulse of the market, identifying key turning points and trends with pinpoint accuracy. PivotWave leverages advanced algorithms to provide clear visual signals for optimal entry and exit points, making it easier for traders to navigate volatile market conditions. Whether you are a begin
FabFlowInPrice
Fabiano Luiz Roberto
Tape Reading, flow monitoring. FabFlowInPrice   is a powerful indicator for those who like Tape Reading (Times & Trades). It presents the volumes traded at each price level, considering the purchase, sale and direct aggressions for each level. Excellent tool for market flow analysis. Thought of flow so monitor who is attacking the most, buyers, sellers or direct exchanges, thought FabFlowInPrice. The indicator displays information in 4 distinct and fixed periods, on any timeframe: @Day - All t
Description The indicator uses market profile theory to show the most relevant trading zones, on a daily basis. The zones to be shown are LVN (low volume nodes) and POC (point of control). An LVN zone is one which represents price areas with the least time or volume throughout the day. Typically, these areas indicate a supply or demand initiative, and in the future, they can turn into important breakout or retracement zones. A POC zone is one which represents price areas with the most time or vo
The professional tool of stock traders in now available on MetaTrader 5 . The Actual depth of market chart indicator visualizes the depth of market in the form of a histogram displayed on a chart, which refreshes in the real-time mode. Meet new updates according to user requests! Now Actual Depth of Market indicator displays the current ratio of volume of buy and sell requests (B/S ratio). It shows the share of volume of each type of requests in the entire flow of requests as well as the absolu
This indicator allows you to enjoy the two most popular products for analyzing request volumes and market deals at a favorable price: Actual Depth of Market Chart Actual Tick Footprint Volume Chart This product combines the power of both indicators and is provided as a single file. The functionality of Actual COMBO Depth of Market AND Tick Volume Chart is fully identical to the original indicators. You will enjoy the power of these two products combined into the single super-indicator! Below is
RR Ratio KS Visual Calculator Unlock effortless risk-reward mastery with the RR Ratio KS Visual Calculator —a sleek, professional MetaTrader 5 indicator that automates TP/SL calculations and delivers crystal-clear visual setups directly on your chart. No more tedious manual math or miscalculations: it instantly computes precise dollar amounts based on your lot size and position direction (buy/sell), displaying interactive lines for TP, SL, half-price targets, and open levels. Perfect for traders
The indicator automatically identifies and labels essential elements of market structure shift, including: Break of Structure (BoS): Detected when there is a significant price movement breaking previous structural points. It mark possible uptrend and downtrend lines(UP & DN, It means constantly update high and low ), and once the price breaks through these lines, mark the red (BEAR) and green (BULL) arrows. BoS typically occurs when the price decisively moves through swing lows or swing highs t
BoxChart MT5
Evgeny Shevtsov
5 (7)
The market is unfair if only because 10% of participants manage 90% of funds. An ordinary trader has slim changes to stand against these "vultures". This problem can be solved. You just need to be among these 10%, learn to predict their intentions and move with them. Volume is the only preemptive factor that faultlessly works on any timeframe and symbol. First, the volume appears and is accumulated, and only then the price moves. The price moves from one volume to another. Areas of volume accumu
Max Min Delta Indicator - Market Volume Imbalance Analysis Gain Deeper Insights into Market Volume Imbalance with Delta Analysis What is the Max Min Delta Indicator? The Max Min Delta Indicator is a powerful market volume analysis tool that visually represents maximum and minimum delta values using a histogram. It helps traders identify market strength, weakness, absorption, and aggressive buying/selling activity with precision. Key Features Histogram Visualization: Displays Max Delta (Green) an
The Accumulation and Distribution indicator is a volume-based indicator that was essentially designed to measure underlying supply and demand. This is accomplished by trying to determine whether traders are actually accumulating (buying) or distributing (selling). This is accomplished by plotting a cumulative total of the money flow volume for each period. This indicator can reveal divergences between volume flow and actual price to primarily affirm a current trend or to anticipate a future reve
The Donchian Time Sync Analyzer brings powerful multi-timeframe dimension to classic Donchian channel analysis, allowing traders to simultaneously monitor trend strength and potential reversal signals across five different chart periods. This advanced indicator calculates the highest highs and lowest lows across your selected timeframes, generating clear visual signals that help identify convergence of trend direction across multiple time horizons. By providing coordinated analysis from minute t
Trade smarter, not harder: Empower your trading with Harmonacci Patterns This is arguably the most complete harmonic price formation auto-recognition indicator you can find for the MetaTrader Platform. It detects 19 different patterns, takes fibonacci projections as seriously as you do, displays the Potential Reversal Zone (PRZ) and finds suitable stop-loss and take-profit levels. [ Installation Guide | Update Guide | Troubleshooting | FAQ | All Products ] It detects 19 different harmonic pri
Market profile was developed by Peter Steidlmayer in the second half of last century. This is a very effective tool if you understand the nature and usage. It's not like common tools like EMA, RSI, MACD or Bollinger Bands. It operates independently of price, not based on price but its core is volume. The volume is normal, as the instrument is sung everywhere. But the special thing here is that the Market Profile represents the volume at each price level. 1. Price Histogram The Price Histogram i
No Demand No Supply MT5
Trade The Volume Waves Single Member P.C.
No Demand No Supply   This indicator identifies   No Demand –No Supply candles to your chart and plots volume bars colored according to the signal. It can be applied to all timeframes or to a specific one only. It can also be used as regular volume indicator  with exceptional future of WEIGHTED VOLUME. Furthermore is has an alert notification, sound and email when a signals occurs. The indicator does not repaint but the alert will come on two candles back due to the definition of No Demand No Su
TRI Visualizer
Yoshimi Mon 三 Ura
TRI Visualizer MT5 – Thermodynamic Market Analysis Overview The TRI (Thermal Range Indicator) Visualizer Enhanced is a rare market analysis indicator that goes beyond conventional technical analysis, applying principles of thermodynamics from physics. It interprets market price fluctuations as “thermodynamic energy,” enabling the highly accurate detection of subtle market changes that are often overlooked. Innovative Mechanisms 1. Dual Calculation Engines Classic TRI Mode Formula: |Close
The Smart Supply and Demand Rectangle Tool Indicator is your ultimate MT5 companion for instantly visualizing key supply and demand data—right where you need it: on your zones, in real time. This tool automatically overlays rich, actionable data ontop of your zones, such as zone classification, pip distance, strength, and zone size—cleanly positioned inside each zone. No more clutter, no more guessing—just clear, dynamic insights to support your decisions. Built for Traders. Powered by Precis
CvdDeltaVolumes
Parasbhai N Patel
Delta + CVD & CVD Candles Order-flow indicator combining Delta (Ask–Bid), Cumulative Volume Delta (CVD), and a unique CVD-based synthetic candle system. Shows buy/sell pressure, volume aggressiveness, and momentum shifts with optional Delta histogram, CVD line, and CVD+Delta combined candles. Useful for scalping, intraday trading, divergence detection, and understanding buyer/seller dominance. Overview The Delta + CVD & CVD Candles Indicator combines multiple order-flow tools into one clean
Volume Profile Density V2.40 Displays the distribution of traded volume by price level, showing where institutional activity occurs. Unlike standard volume (over time), it reveals where volume actually concentrated. Key points: Horizontal bars = volume at each price Longer bar → higher volume Red zones = major support/resistance Main uses: Identify true support/resistance zones Locate POC (Point of Control) Define Value Area (70% of total volume) Use low-volume zones for stops and targets Color
Haven Fibonacci Volume Profiles — Your Automatic Market Range Analyst Introducing Haven Fibonacci Volume Profiles — a powerful tool that takes market analysis to the next level. This indicator automatically identifies key price ranges built on significant pivot points and overlays a detailed Volume Profile along with Fibonacci levels on each one. This allows traders to instantly see where liquidity is concentrated and where true support and resistance levels are located. Other products -> HERE .
Volume Candle Indicator
Pablo Filipe Soares De Almeida
Volume Color Histogram for MetaTrader 5. This indicator displays volume as a histogram in a separate window. The bars are colored based on the direction of the price candle: green for bullish (close > open) and red for bearish (close < open). Key Features Volume source: Tick volume or real volume (user-selectable). Optional moving average line over the volume histogram, which can be enabled via input. Supported average types: SMA, EMA, SMMA, LWMA. Average period is configurable. Compatible with
Weiss Wave with lots of functionality and lightweight. The same can be used both in markets that have access to volume (REAL=Contracts, Tick=Business) or points! You will be able to:     - Analyze the volume of the market by swings made!     - Define the source of the data presented in the graphic, its size and color! Or simply hide this information!     - Define whether or not to show the swings in the graph and how many swings! In addition to setting the trend line color, thickness an
Best SAR MT5
Ashkan Hazegh Nikrou
4.33 (3)
Description :  we are happy to introduce our new free indicator based on one of professional and popular indicators in forex market (Parabolic SAR) this indicator is new modification on original Parabolic SAR indicator, in pro SAR indicator you can see cross over between dots and price chart, this crossover is not signal but talk about end of movement potential, you can start buy by new blue dot, and place stop loss one atr before first blue dot, and finally you can exit as soon as dots cross p
FREE
Delta Profile Volume
Teresinha Moraes Correia
Technical Description of the Indicator – Delta Profile for MetaTrader 5 The Delta Profile is an indicator developed for MetaTrader 5 focused on detailed analysis of volume flow within a defined range of candles. It organizes and displays information about the imbalance of positive volumes (associated with upward movements) and negative volumes (associated with downward movements) at different price levels. The result is a clear view of the chart points where the highest concentration of trades o
Wapv Price and volume
Eduardo Da Costa Custodio Santos
The WAPV Price and Volume Indicator for MT5 is part of the ( Wyckoff Academy Wave Market ) and (Wyckoff Academy Price and Volume) toolset. The WAPV Price and Volume Indicator for MT5 was created to make it easy to visualize the volume movement on the chart in an intuitive way. With it you can observe the moments of peak volume and moments when the market has no professional interest Identify moments when the market is moving by inertia and not by movement of "smart money". It consists of 4 color
The new update makes this indicator a complete tool for studying, analyzing and operating probabilistic patterns. It includes: On-chart Multi-asset percentage monitor. Configurable martingales. Twenty-one pre-configured patterns, including Mhi patterns and C3. An advanced pattern editor to store up to 5 custom patterns. Backtest mode to test results with loss reports. Trend filter. Hit operational filter. Martingale Cycles option. Various types of strategies and alerts. Confluence between patter
New Combined Indicator - 3 in 1 Are you looking for trading tools that can enhance your market analysis and investment strategies? We have combined three of our best indicators into a single powerful and convenient solution, allowing you to get the most value for your trading. 1. Order Block Indicator (previously sold for $32.90) The Order Block Indicator is an essential tool for identifying areas of strong institutional interest within the market. This indicator marks the highs and lows of orde
Buyers of this product also purchase
New Update of   Smart Trend Trading System MT5 For  2026 Market: If You Buy this Indicator you will Get my Professional Trade Manager + EA  for FREE . First of all Its worth emphasizing here that this Trading System is Non-Repainting   , Non Redrawing and Non Lagging Indicator Which makes it ideal from both manual and robot trading .  [Online course] , [manual] and [download presets] . The Smart Trend Trading System MT5 is a comprehensive trading solution tailored for new and experienced traders
Divergence Bomber
Ihor Otkydach
4.99 (76)
Each buyer of this indicator also receives the following for free: The custom utility "Bomber Utility", which automatically manages every trade, sets Stop Loss and Take Profit levels, and closes trades according to the rules of this strategy Set files for configuring the indicator for various assets Set files for configuring Bomber Utility in the following modes: "Minimum Risk", "Balanced Risk", and "Wait-and-See Strategy" A step-by-step video manual to help you quickly install, configure, and s
Gold Sniper Scalper Pro
Ich Khiem Nguyen
5 (4)
Gold Sniper Scalper Pro - Gold (XAU/USD) Trading System on MetaTrader 5 For the serious trader: Approach Gold trading with a structured, data-driven methodology that combines multiple market analysis factors. This tool is built to support your Gold trading analysis. Limited Price Opportunity This is a chance to own Gold Sniper Scalper Pro before the price increases. The product price will increase by $50 after every 10 subsequent purchases. Final Price: $498 Features That Define Your Analytical
ARIPoint
Temirlan Kdyrkhan
1 (1)
ARIPoint is a powerful trading companion designed to generate high-probability entry signals with dynamic TP/SL/DP levels based on volatility. Built-in performance tracking shows win/loss stats, PP1/PP2 hits, and success rates all updated live. Key Features: Buy/Sell signals with adaptive volatility bands Real-time TP/SL/DP levels based on ATR Built-in MA Filter with optional ATR/StdDev volatility Performance stats panel (Success, Profit/Loss, PP1/PP2) Alerts via popup, sound, push, or email Cu
***  Entry In The Zone and SMC Multi Timeframe is a real-time market analysis tool developed based on Smart Money Concepts (SMC). It is designed to help traders analyze market structure systematically and gain a clearer view of overall market direction. The system analyzes Reversal Points, Key Zones, and Market Structure across multiple timeframes, while displaying Point Of Interest (POI) , No Repaint Signals, and Auto Fibonacci Levels to help detect pullbacks and reversal points with precision.
Trend Screener Pro MT5
STE S.S.COMPANY
4.84 (99)
Unlock the Power of Trends Trading with the Trend Screener Indicator: Your Ultimate Trend Trading Solution powered by Fuzzy Logic and Multi-Currencies System! Elevate your trading game with the Trend Screener, the revolutionary trend indicator designed to transform your Metatrader into a powerful Trend Analyzer. This comprehensive tool leverages fuzzy logic and integrates over 13 premium features and three trading strategies, offering unmatched precision and versatility. LIMITED TIME OFFER : Tre
Atomic Analyst MT5
Issam Kassas
4.31 (26)
New Update of   Atomic Analyst MT5 For  2026 Market: If You Buy this Indicator you will Get my Professional   Trade Manager + EA  for   FREE . First of all Its worth emphasizing here that this Trading Indicator is   Non-Repainting   , Non Redrawing and Non Lagging Indicator   Indicator, Which makes it ideal from both manual and robot trading.  User manual: settings, inputs and strategy . The Atomic Analyst  is a PA Price Action Indicator that uses Strength and Momentum of the price to find a bet
FX Power MT5 NG
Daniel Stein
5 (27)
FX Power: Analyze Currency Strength for Smarter Trading Decisions Overview FX Power is your go-to tool for understanding the real strength of currencies and Gold in any market condition. By identifying strong currencies to buy and weak ones to sell, FX Power simplifies trading decisions and uncovers high-probability opportunities. Whether you’re looking to follow trends or anticipate reversals using extreme delta values, this tool adapts seamlessly to your trading style. Don’t just trade—trade
First of all Its worth emphasizing here that this Trading Tool is Non Repainting , Non Redrawing and Non Lagging Indicator , Which makes it ideal for professional trading . Online course, user manual and demo. The Smart Price Action Concepts Indicator is a very powerful tool for both new and experienced traders . It packs more than 20 useful indicators into one , combining advanced trading ideas like Inner Circle Trader Analysis and Smart Money Concepts Trading Strategies . This indicator focus
Quantum TrendPulse
Bogdan Ion Puscasu
5 (19)
Introducing Quantum TrendPulse , the ultimate trading tool that combines the power of SuperTrend , RSI , and Stochastic into one comprehensive indicator to maximize your trading potential. Designed for traders who seek precision and efficiency, this indicator helps you identify market trends, momentum shifts, and optimal entry and exit points with confidence. Key Features: SuperTrend Integration: Easily follow the prevailing market trend and ride the wave of profitability. RSI Precision: Detect
Quantum Trend Sniper
Bogdan Ion Puscasu
4.74 (53)
Introducing   Quantum Trend Sniper Indicator , the groundbreaking MQL5 Indicator that's transforming the way you identify and trade trend reversals! Developed by a team of experienced traders with trading experience of over 13 years,   Quantum Trend Sniper Indicator   is designed to propel your trading journey to new heights with its innovative way of identifying trend reversals with extremely high accuracy. ***Buy Quantum Trend Sniper Indicator and you could get Quantum Breakout Indicator for
Trend indicator AI mt5
Ramil Minniakhmetov
5 (12)
Trend Ai indicator  mt5 is great tool that will enhance a trader’s market analysis by combining trend identification with actionable entry points and reversal alerts.  This indicator empowers users to navigate the complexities of the forex market with confidence and precision Beyond the primary signals, Trend Ai indicator identifies secondary entry points that arise during pullbacks or retracements, enabling traders to capitalize on price corrections within the established trend. Important Advan
TPSproTREND PrO MT5
Roman Podpora
4.72 (18)
Buy TREND PRO now and get another advanced trend indicator for free To receive, write in private messages. ИНСТРУКЦИЯ RUS    -  INSTRUCTIONS  ENG    -  VERSION MT4   Main functions: Accurate entry signals WITHOUT REPAINTING! Once a signal appears, it remains valid! This is a significant distinction from repainting indicators that might provide a signal and then alter it, potentially leading to deposit losses. Now, you can enter the market with higher probability and precision. There's also a f
Grabber System MT5
Ihor Otkydach
5 (19)
Let me introduce you to an excellent technical indicator – Grabber, which works as a ready-to-use "All-Inclusive" trading strategy. Within a single code, it integrates powerful tools for technical market analysis, trading signals (arrows), alert functions, and push notifications. Every buyer of this indicator also receives the following for free: Grabber Utility for automatic management of open orders Step-by-step video guide: how to install, configure, and trade with the indicator Custom set fi
Top indicator for MT5   providing accurate signals to enter a trade without repainting! It can be applied to any financial assets:   forex, cryptocurrencies, metals, stocks, indices .  Watch  the video  (6:22) with an example of processing only one signal that paid off the indicator! MT4 version is here It will provide pretty accurate trading signals and tell you when it's best to open a trade and close it. Most traders improve their trading results during the first trading week with the help of
How many times have you bought a trading indicator with great back-tests, live account performance proof with fantastic numbers and stats all over the place but after using it, you end up blowing your account? You shouldn't trust a signal by itself, you need to know why it appeared in the first place, and that's what RelicusRoad Pro does best! User Manual + Strategies + Training Videos + Private Group with VIP Access + Mobile Version Available A New Way To Look At The Market RelicusRoad is the
Blahtech Supply Demand MT5
Blahtech Limited
4.54 (13)
Was: $299  Now: $99  Supply Demand uses previous price action to identify potential imbalances between buyers and sellers. The key is to identify the better odds zones, not just the untouched ones. Blahtech Supply Demand indicator delivers functionality previously unavailable on any trading platform. This 4-in-1 indicator not only highlights the higher probability zones using a multi-criteria strength engine, but also combines it with multi-timeframe trend analysis, previously confirmed swings a
Support And Resistance Screener Breakthrough unique Solution With All Important levels analyzer and Markets Structures Feature Built Inside One Tool ! Our indicator has been developed by traders for traders and with one Indicator you will find all Imporant market levels with one click. LIMITED TIME OFFER : Support and Resistance Screener Indicator is available for only 50 $ and lifetime. ( Original price 125$ ) (offer extended) The available tools ( Features ) in our Indicator are :  1. HH-LL S
Introducing   Quantum Breakout PRO , the groundbreaking MQL5 Indicator that's transforming the way you trade Breakout Zones! Developed by a team of experienced traders with trading experience of over 13 years,   Quantum Breakout PRO   is designed to propel your trading journey to new heights with its innovative and dynamic breakout zone strategy. Quantum Breakout Indicator will give you signal arrows on breakout zones with 5 profit target zones and stop loss suggestion based on the breakout b
FX Volume MT5
Daniel Stein
4.86 (22)
FX Volume: Experience Genuine Market Sentiment from a Broker’s Perspective Quick Overview Looking to elevate your trading approach? FX Volume provides real-time insights into how retail traders and brokers are positioned—long before delayed reports like the COT. Whether you’re aiming for consistent gains or simply want a deeper edge in the markets, FX Volume helps you spot major imbalances, confirm breakouts, and refine your risk management. Get started now and see how genuine volume data can
Berma Bands
Muhammad Elbermawi
5 (7)
The Berma Bands (BBs) indicator is a valuable tool for traders seeking to identify and capitalize on market trends. By analyzing the relationship between the price and the BBs, traders can discern whether a market is in a trending or ranging phase. Visit the [ Berma Home Blog ] to know more. Berma Bands are composed of three distinct lines: the Upper Berma Band, the Middle Berma Band, and the Lower Berma Band. These lines are plotted around the price, creating a visual representation of the pric
SynaptixQuant Dominance Matrix
Devie Arevalo Montemayor
5 (1)
SynaptixQuant Dominance Matrix: Institutional-Grade Market State Extraction Engineered for traders who require a data-driven view of market behaviour beyond surface-level indicators. The Synaptix Quant (SQ) Dominance Matrix is not a conventional currency strength display. Behind its intentionally streamlined interface runs a sophisticated analytical architecture designed to quantify market conditions with precision. Every output is generated through layered signal processing built to identify d
AriX
Temirlan Kdyrkhan
1 (4)
AriX Indicator for MT5 A powerful trend-following and signal-evaluation tool AriX is a custom MT5 indicator that combines Moving Averages and ATR-based risk/reward logic to generate clear buy/sell signals. It visualizes dynamic SL/TP levels, evaluates past trade outcomes, and displays win/loss statistics in a clean on-chart panel. Key features include: Buy/Sell signals based on MA crossovers ATR-based SL/TP1/TP2/TP3 levels with visual lines and labels Signal outcome tracking with real-time stat
Trend Forecaster
Alexey Minkov
5 (7)
The Trend Forecaster indicator utilizes a unique proprietary algorithm to determine entry points for a breakout trading strategy. The indicator identifies price clusters, analyzes price movement near levels, and provides a signal when the price breaks through a level. The Trend Forecaster indicator is suitable for all financial assets, including currencies (Forex), metals, stocks, indices, and cryptocurrencies. You can also adjust the indicator to work on any time frames, although it is recommen
Dark Absolute Trend MT5
Marco Solito
4.69 (13)
Dark Absolute Trend   is an Indicator for intraday trading. This Indicator is based on   Trend Following  strategy but use also candlestick patterns and Volatility. We can enter in good price with this Indicator, in order to follow the main trend on the current instrument. It is advised to use low spread ECN brokers. This Indicator does   Not repaint   and   N ot lag . Recommended timeframes are M5, M15 and H1. Recommended working pairs: All. I nstallation and  Update Guide   -  Troubleshooting
Pro Footprint & TPO - Order Flow for Standard Brokers (No DOM Required)。 Also engineered for brokers that DO NOT provide Market Depth (Level 2/DOM) data. Using a proprietary high-precision Tick reconstruction algorithm, this indicator simulates institutional Order Flow directly from standard price feeds. It allows you to visualize aggressive buying and selling pressure on any standard MT5 account (Forex, CFD, Crypto), bridging the gap between retail and professional trading. Footprint Visualizat
Best Solution for any Newbie or Expert Trader! This Indicator is a unique, high quality and affordable trading tool because we have incorporated a number of proprietary features and a new formula. With only ONE chart you can read Currency Strength for 28 Forex pairs! Imagine how your trading will improve because you are able to pinpoint the exact trigger point of a new trend or scalping opportunity? User manual:   click here That's the first one, the original! Don't buy a worthless wannabe clone
ARICoins
Temirlan Kdyrkhan
ARICoin is a powerful trading companion designed to generate high-probability entry signals with dynamic TP/SL/DP levels based on volatility. Built-in performance tracking shows win/loss stats, PP1/PP2 hits, and success rates all updated live. Key Features: Buy/Sell signals with adaptive volatility bands Real-time TP/SL/DP levels based on ATR Built-in MA Filter with optional ATR/StdDev volatility Performance stats panel (Success, Profit/Loss, PP1/PP2) Alerts via popup, sound, push, or email Cust
Matrix Arrow Indicator MT5
Juvenille Emperor Limited
5 (17)
Matrix Arrow Indicator MT5  is a unique 10 in 1 trend following   100% non-repainting  multi-timeframe indicator that can be used on all symbols/instruments:   forex,   commodities,   cryptocurrencies,   indices,   stocks .  Matrix Arrow Indicator MT5  will determine the current trend at its early stages, gathering information and data from up to 10 standard indicators, which are: Average Directional Movement Index (ADX) Commodity Channel Index (CCI) Classic Heiken Ashi candles Moving Average
TPSpro RFI Levels MT5
Roman Podpora
4.53 (19)
INSTRUCTIONS RUS   /   INSTRUCTIONS   ENG    -     Version MT4 Main functions: Displays active zones of sellers and buyers! The indicator displays all the correct first impulse levels/zones for purchases and sales. When these levels/zones are activated, where the search for entry points begins, the levels change color and are filled with certain colors. Arrows also appear for a more intuitive perception of the situation. LOGIC AI - Display of zones (circles) for searching entry points when acti
More from author
Predator Order Manager — Features: - Buy & Sell Orders: Effortlessly execute market orders with a single click. - Limit Orders: Set your Buy Limit and Sell Limit orders to capitalize on market movements at your preferred price points. - Stop Orders: Utilize Buy Stop and Sell Stop orders to enter trades at breakout levels, ensuring you never miss an opportunity. - Instant Breakeven Function moves stop level to breakeven(zero risk).  - Trailing Stops: Implement multiple trailing stop options, in
Revolutionize Your Trading! Unlock the Secrets of Market Dynamics with the Predator Expansion Contraction Candles Indicator. Imagine having the power to decode the secret language of the markets, to anticipate the ebbs and flows of price movements with uncanny precision. Welcome to the Predator Expansion Contraction Candles Indicator, a game-changing NON-REPAINTING tool that elevates your trading to new heights by providing unparalleled insights into market expansion and contraction phases. U
Uncover the true hidden patterns of the market with the PREDATOR AURORA Trading System—the final boss of hybrid trading Indicators. See what others don't! PREDATOR AURORA Trading System a powerhouse designed for those who refuse to cower in the shadows of mediocrity. This isn't just another indicator, it is the cheat code ; it is your unfair advantage , a sophisticated hybrid hunting system that tracks market movements with lethal precision in a jungle where only the strongest survive. Inspir
Predator Market Structure Oscillator What It Does Hunts the same institutional key levels that move billions EVERYDAY. Three proprietary algorithms decode real market structure to expose high-probability kill zones before retail traders even know what hit them. Visual Elements Green Histogram : Institutional buying pressure detected Red Histogram : Smart money distribution in progress Signal Line : Green = bullish volume, Red = sellers engaged Key Parameters Lookback Period : 14 (institutional
PREDATOR DAILY LEVELS SOFTWARE: Predator Daily Levels automates drawing daily High, Low, and Open (HLO) lines on MT5 charts, replacing manual level marking for efficient trading. It shows multiple days back with descriptive labels like "Monday High," color-coded lines (crimson highs, forest green lows, light coral opens), and customizable width, style, and font sizes. Updates occur automatically on new bars and chart changes for real-time precision across all symbols and timeframes. ​ Key Fe
Filter:
No reviews
Reply to review