Predator Orderflow System
- Indicators
-
Evans Asuma Metobo
 Best Scalper On Earth📈. 4+ years Forex, Stocks, Commodities, Crypto Expert with MBA Finance & 4 years experience in Wyckoff Schematics and Order-flow Analysis. I LOVE CODING NEW UNIQUE STUFF, i hope you find something useful here. 😊
 - Version: 1.0
- Activations: 10
Product Description
Predator Order Flow System is a professional-grade orderflow indicator for MetaTrader 5 that visualizes where institutional money is active in the market. By combining volume analysis, delta profiling, and order book depth into a single chart overlay, it gives traders a clear picture of buying and selling pressure at every price level — the same kind of insight used by institutional traders on platforms like Bookmap.
Built for both live trading and strategy backtesting, the indicator automatically adapts its update behavior depending on the environment it runs in.
Key features:
- Volume Profile — a heatmap showing accumulated buy and sell volume across price levels, with POC (Point of Control) marking the highest-activity price
- Delta Profile — a right-side panel showing the net difference between buying and selling pressure per price level
- Time Delta Profile — a bottom panel showing bar-by-bar delta momentum, smoothed for cleaner signals
- Volume Bubbles — proportionally sized dots plotted directly on the chart showing where large orders were executed
- Order Walls — highlights significant pending order clusters sourced from Level 2 market depth data
- Absorption Detection — flags price levels where high volume is met with little price movement, a classic sign of institutional absorption
- Market Bias Panel — a real-time summary label showing overall buy/sell pressure and market sentiment
User Manual
Input Parameters
| Parameter | What it does |
|---|---|
| Lookback Bars | How many bars back to analyze (default 300) |
| Price Levels | Number of horizontal zones for the volume/delta profile (default 10) |
| Bubble Price Levels | Sensitivity for detecting large order bubbles |
| Order Wall Threshold | How many times above average depth triggers an order wall (default 2.5x) |
| Volume Threshold | How many times above average volume triggers a highlight (default 3.0x) |
| Show Volume Blocks | Shows order lifecycle blocks from the order book |
| Show Volume Bubbles | Shows proportional bubbles where large orders executed |
| Show Volume Histogram | Toggles the time delta bar profile at the bottom |
| Show Order Values | Displays numeric volume labels on the chart |
| Show Delta Profile | Toggles the right-side delta panel |
| Show Time Profile | Toggles the bottom time delta panel |
| Use Order Book Data | Enables Level 2 market depth (live only, not in tester) |
| Heatmap Width | Width of the volume profile in pixels |
| Update Interval | How often the indicator refreshes in live mode (ms) |
| Bubble Size Multiplier | Scales bubble sizes up or down |
| Heatmap/Delta Offset | How far right the profiles are drawn from the current bar |
| Time Profile Height | Height of the bottom delta panel in pixels |
| Max Bubbles / Max Blocks | Performance caps to prevent chart overload |
| Buy/Sell Colors | Customize all color outputs |
| Time Delta Smoothing | Smoothing period for the bottom delta bars |
| Debug Mode | Prints internal data to the MT5 Experts log |
Reading the Chart
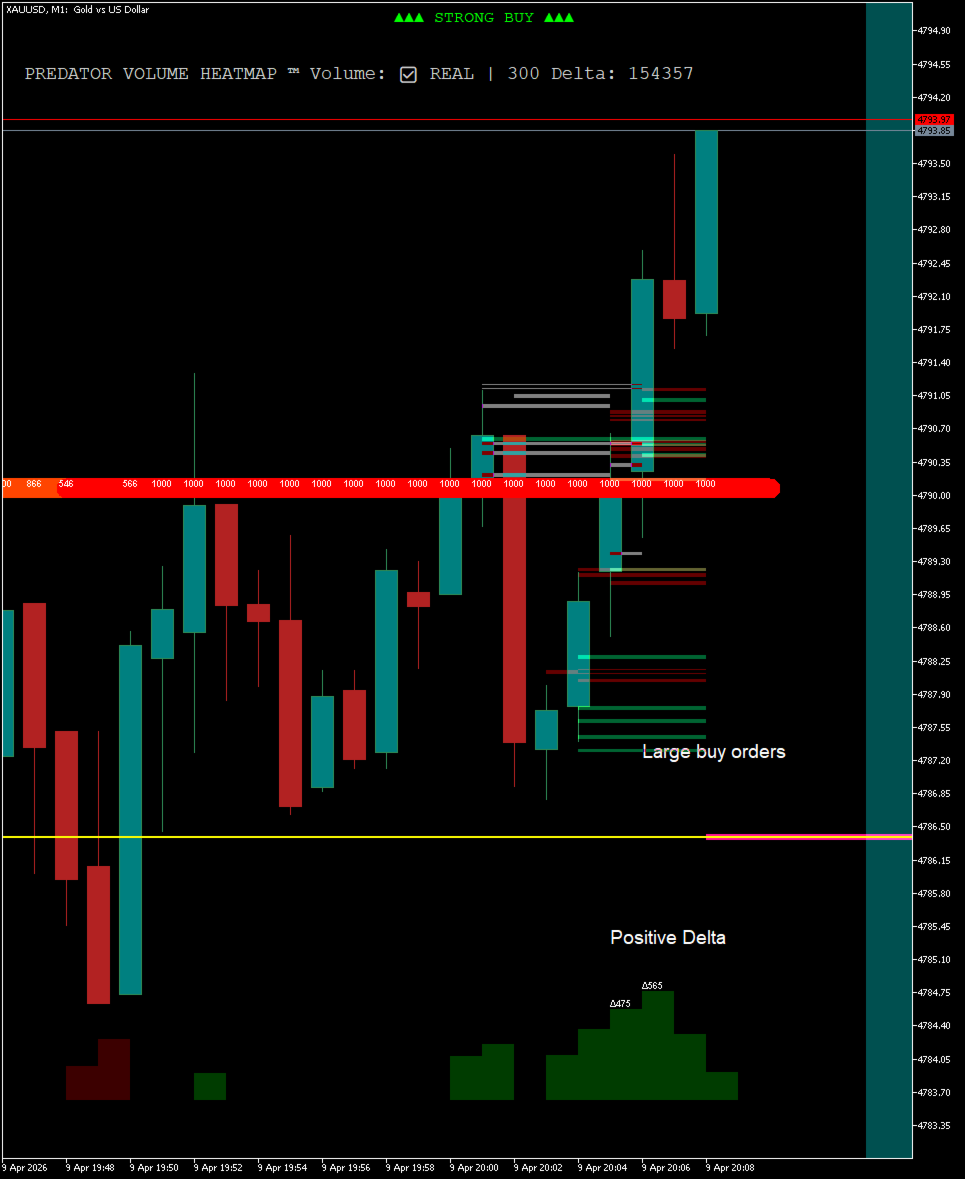
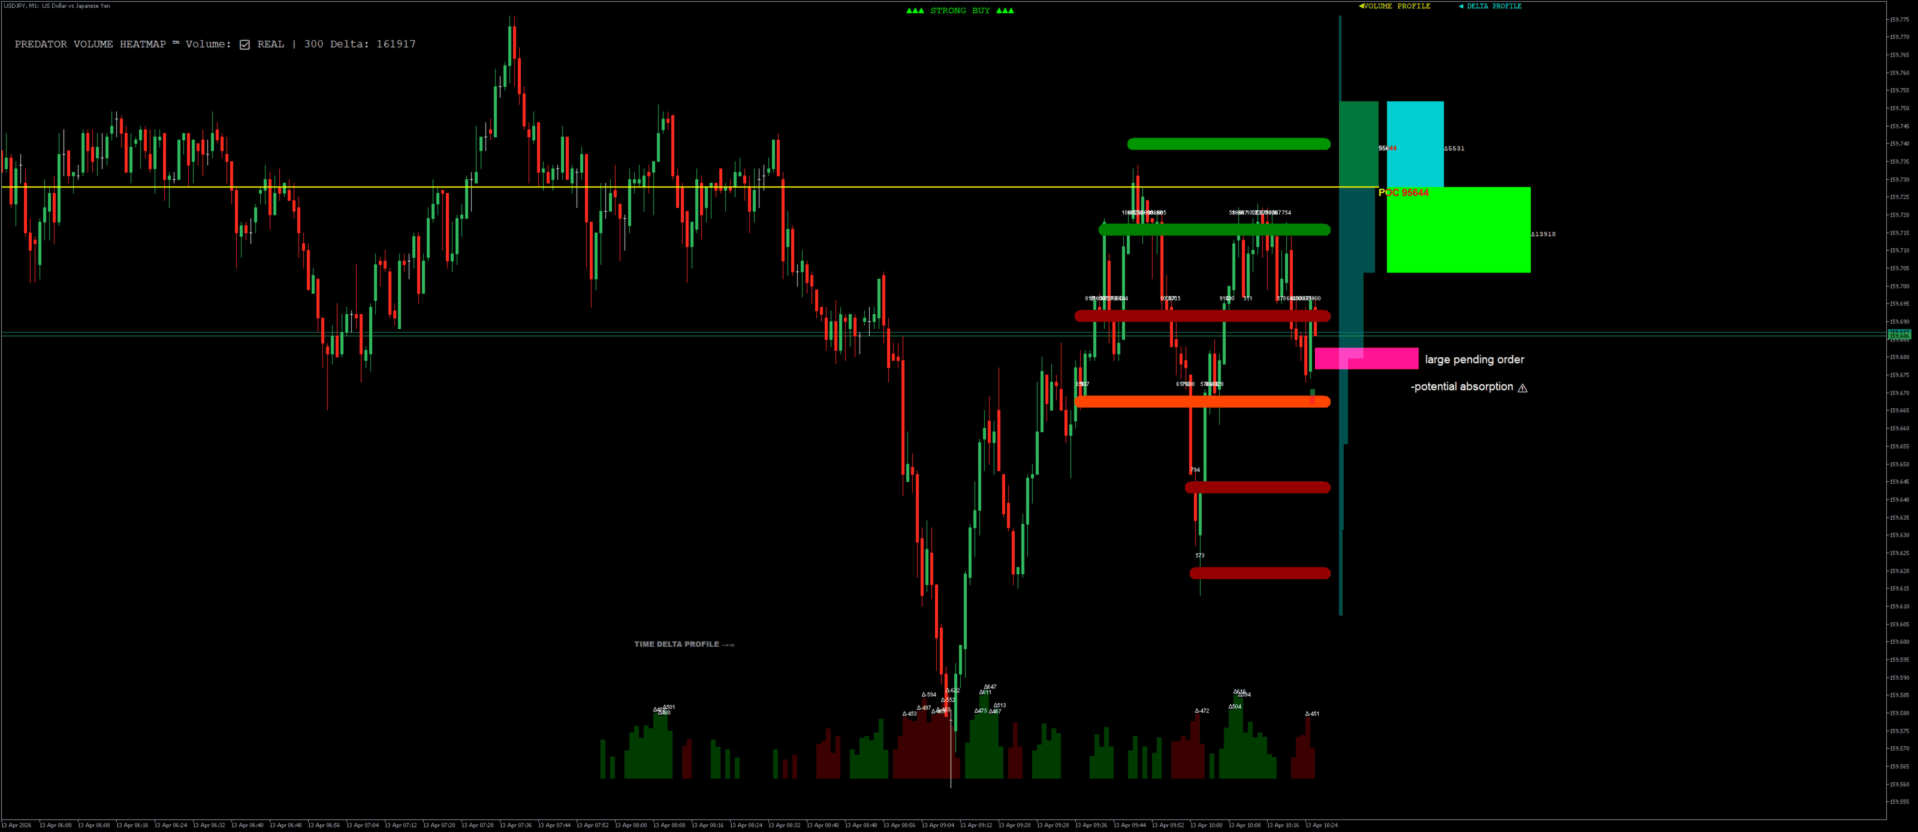
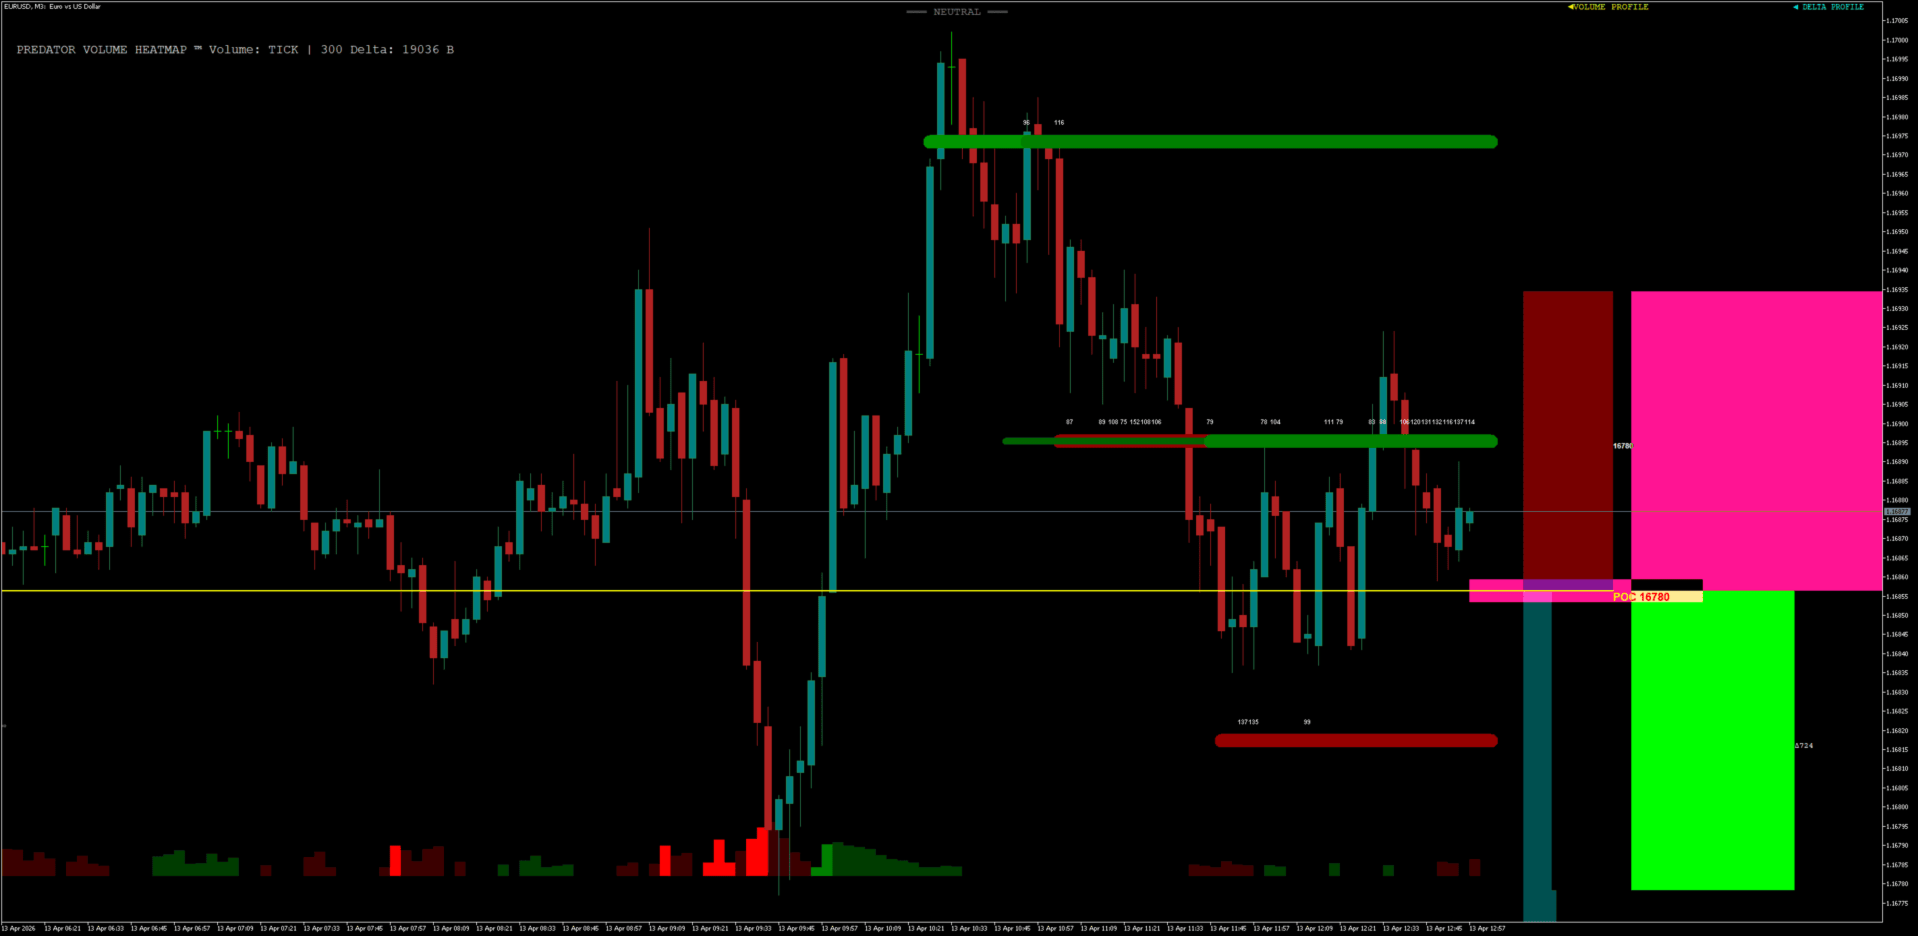
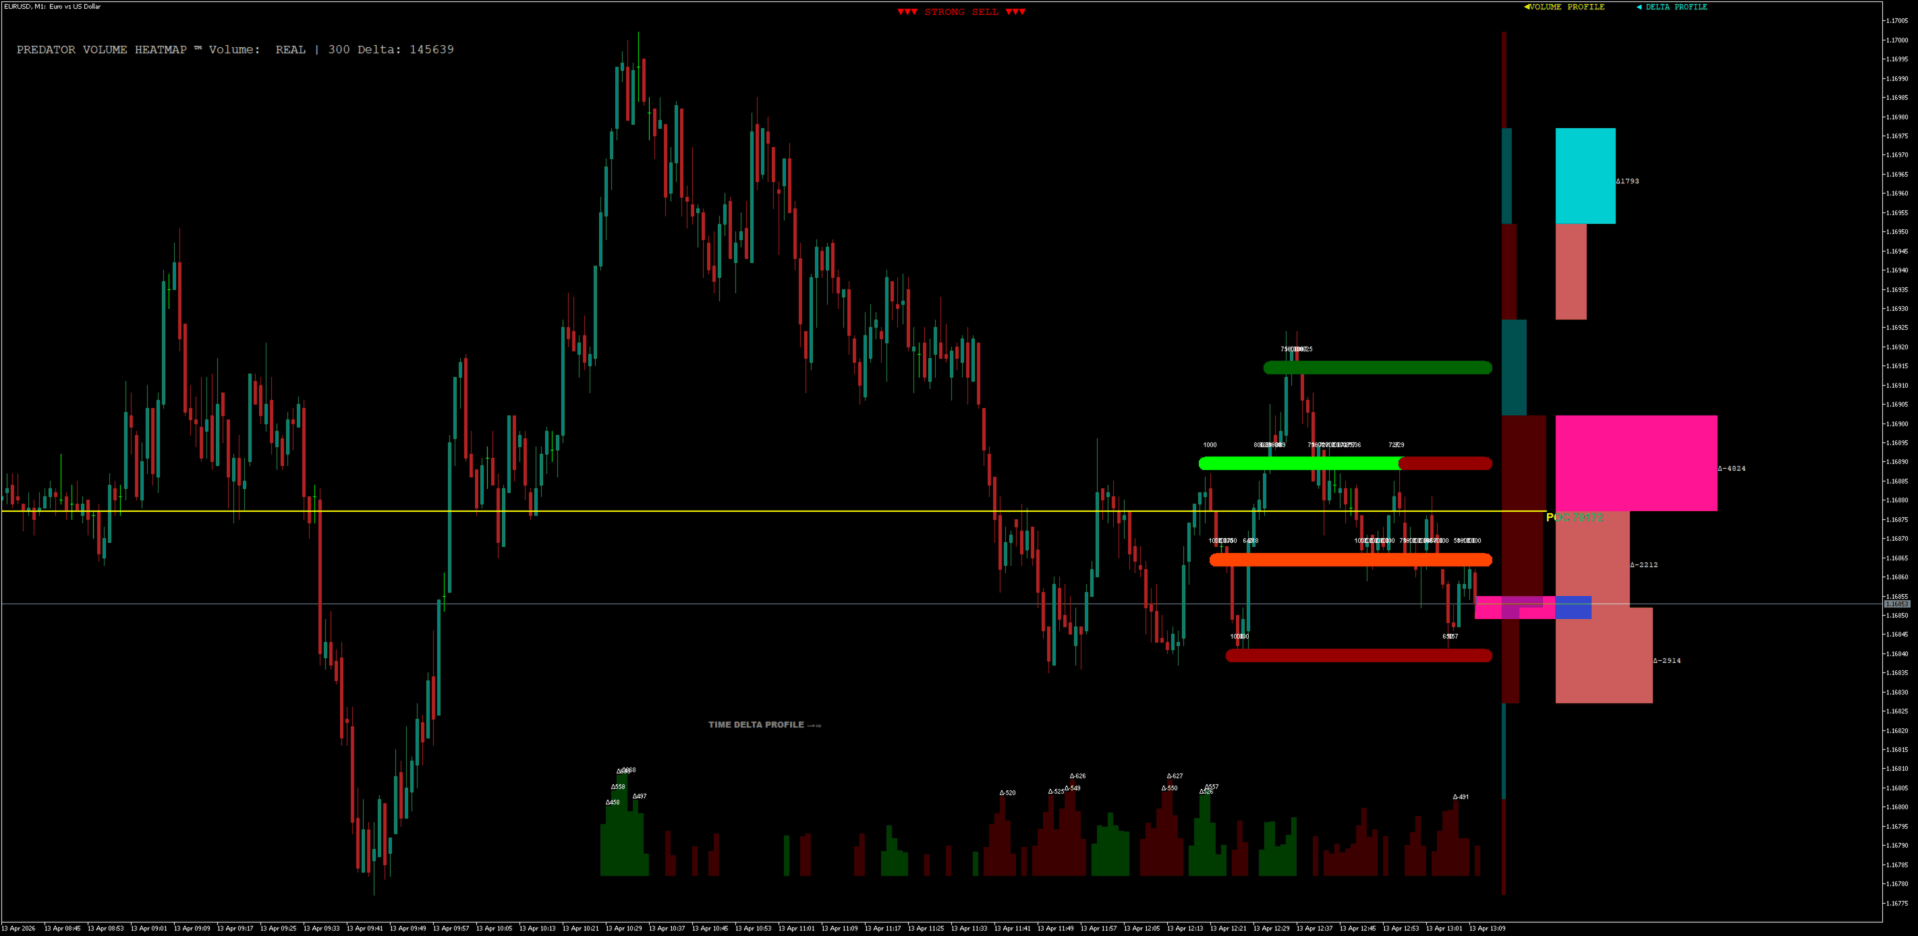
Volume Profile (right of price) Colored rectangles show volume density per price zone. Teal = buy-dominant, red = sell-dominant, yellow = absorption zone. The longest bar is the POC — the price level with the most traded volume.
Delta Profile (further right) Cyan/green bars = net buying pressure. Pink/red bars = net selling pressure. Highlighted bars indicate unusually large imbalances. Labeled with "Δ" values when enabled.
Time Delta Profile (bottom) Green bars = bars where buyers dominated. Red bars = seller-dominant bars. Bright green = accumulation signal. Orange-red = distribution signal.
Bubbles (on chart) Circles plotted at the price and time of order execution. Larger = more volume. Lime/orange = very large orders. Darker shades = smaller orders.
Top Label Shows live market bias: STRONG BUY / BULL PRESSURE / NEUTRAL / BEAR PRESSURE / STRONG SELL, updating with each calculation cycle.
Tips for Use
- Use on M5–H1 timeframes for best orderflow clarity
- POC acts as a magnet — price frequently returns to it
- Absorption zones (yellow) near key levels often precede reversals
- Order walls show where large pending orders sit — price may stall or reject there
- In the Strategy Tester, Level 2 data and the timer are automatically disabled; everything else works normally