Efficient Distance Pro
- Indicators
- Version: 2.0
- Activations: 20

Stop guessing with static moving averages that lag in fast markets and fail in choppy conditions. Efficient Distance Pro is an advanced, non-repainting channel indicator designed to give you a clearer view of market dynamics. It adapts to volatility in real-time, creating a dynamic channel around a uniquely calculated baseline to help you identify high-probability entry and exit points with greater confidence.
How It Works
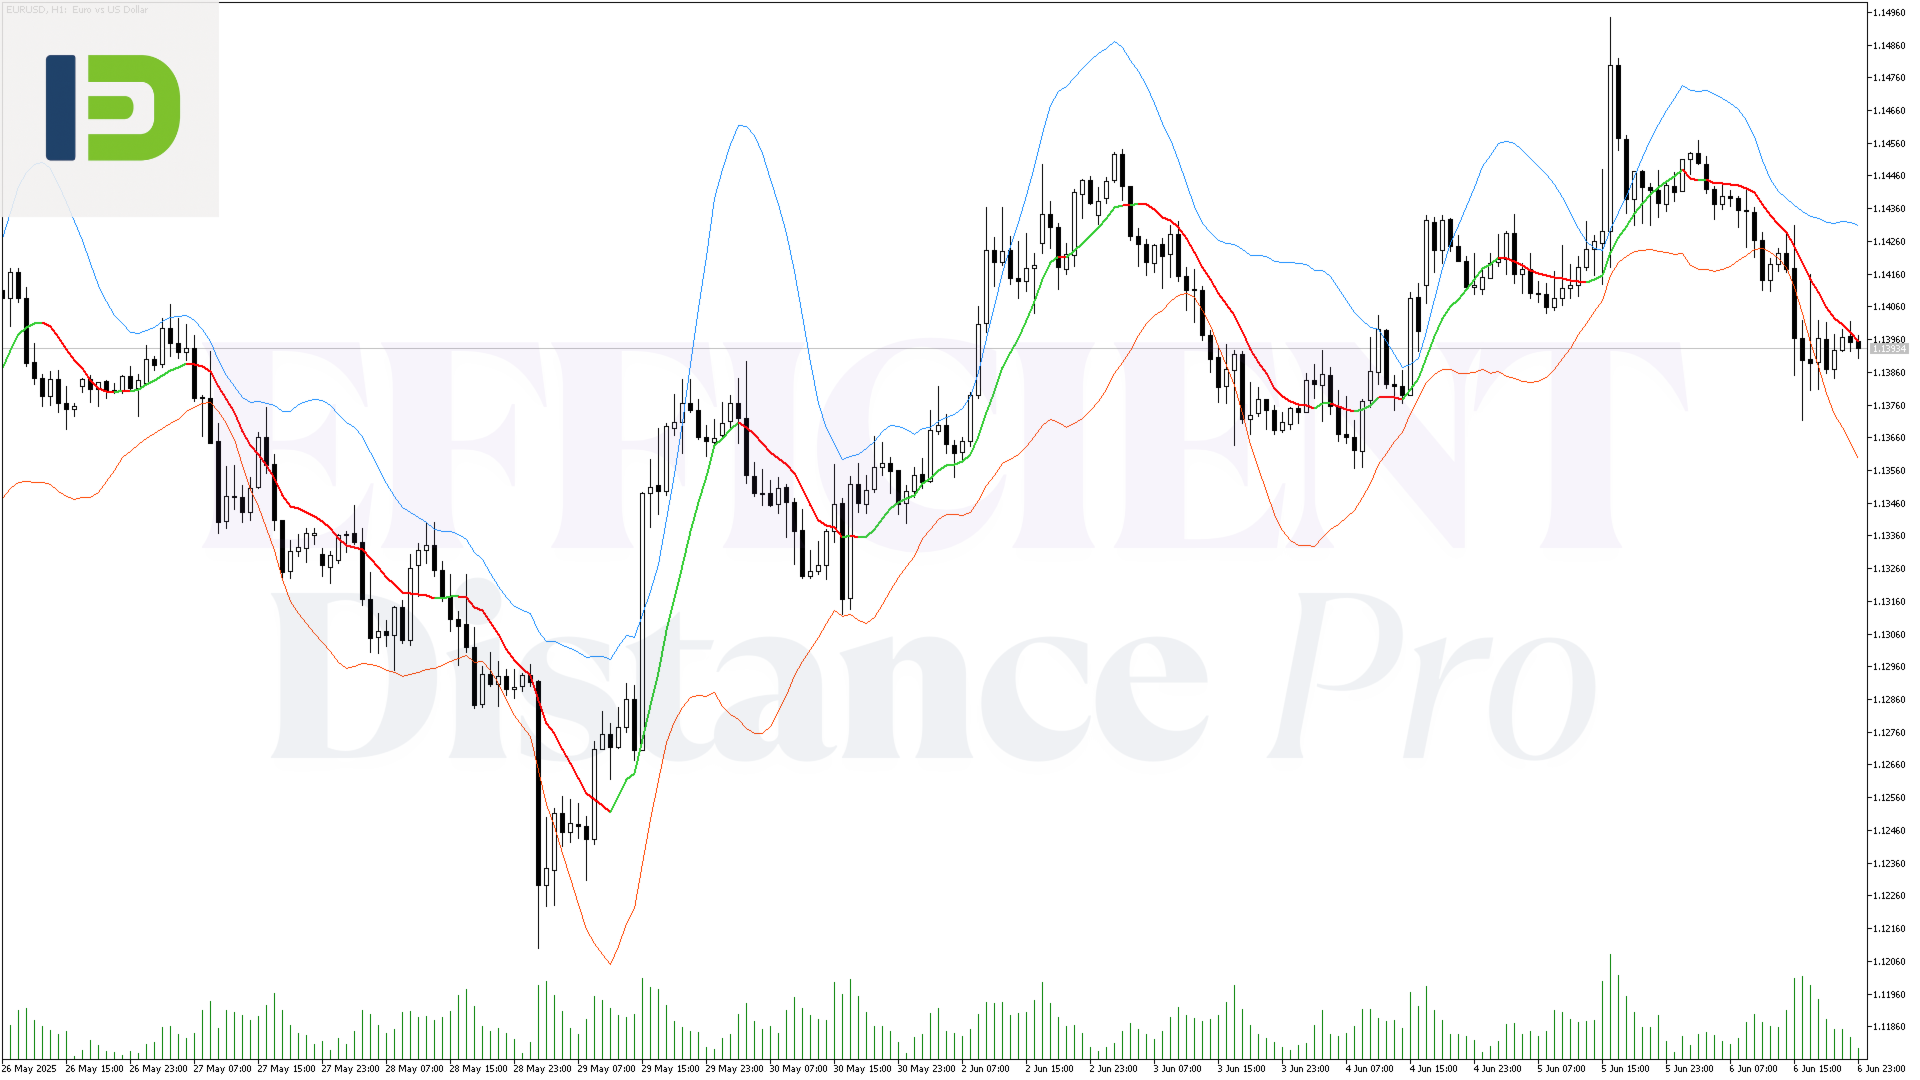
The core of the indicator is the Efficient Distance line. Unlike traditional moving averages, its calculation is weighted by price volatility. In quiet markets, it behaves like a smooth average. In volatile markets, it becomes more responsive, hugging the price action more closely. This core line changes color based on its slope, providing instant trend direction feedback.
Surrounding the core line are two Volatility Bands. These bands expand and contract based on recent price volatility (standard deviation), creating a dynamic channel. This channel helps you:
- Identify potential overbought and oversold levels when the price touches or exceeds the bands.
- Gauge trend strength: widening bands suggest increasing momentum, while narrowing bands indicate consolidation.
Key Advantages
- 100% Non-Repainting: Signals are final once a bar closes. What you see is what you get.
- Dynamic Sensitivity: Automatically adapts its baseline calculation to market volatility for a more responsive signal.
- Integrated Volatility Channel: Built-in upper and lower bands help frame the price action and spot reversal zones.
- Full Alert System: Receive notifications for price/line crossovers and slope changes via pop-up, push, or email.
- Multi-Timeframe (MTF) Capable: Analyze higher timeframe trends directly on your current chart to align your trades with the bigger picture.
- Fully Customizable: Tailor every aspect, from calculation periods and price sources to colors and alert settings.
Ideal Usage and Tips
Efficient Distance Pro is a versatile tool suitable for various trading styles, including scalping, day trading, and swing trading. It works on all assets (Forex, Crypto, Indices, Commodities).
- Trend Confirmation: Look for the price to consistently respect one side of the channel while the core line maintains a steady color (e.g., green for an uptrend).
- Reversal Signals: A strong price rejection at an outer band, especially if the bands were wide, can signal a potential reversal. Confirm with a change in the core line's color.
- Ranging Markets: When the bands are narrow and the core line is flat or frequently changing color, it signals a sideways market, which is often best to avoid.
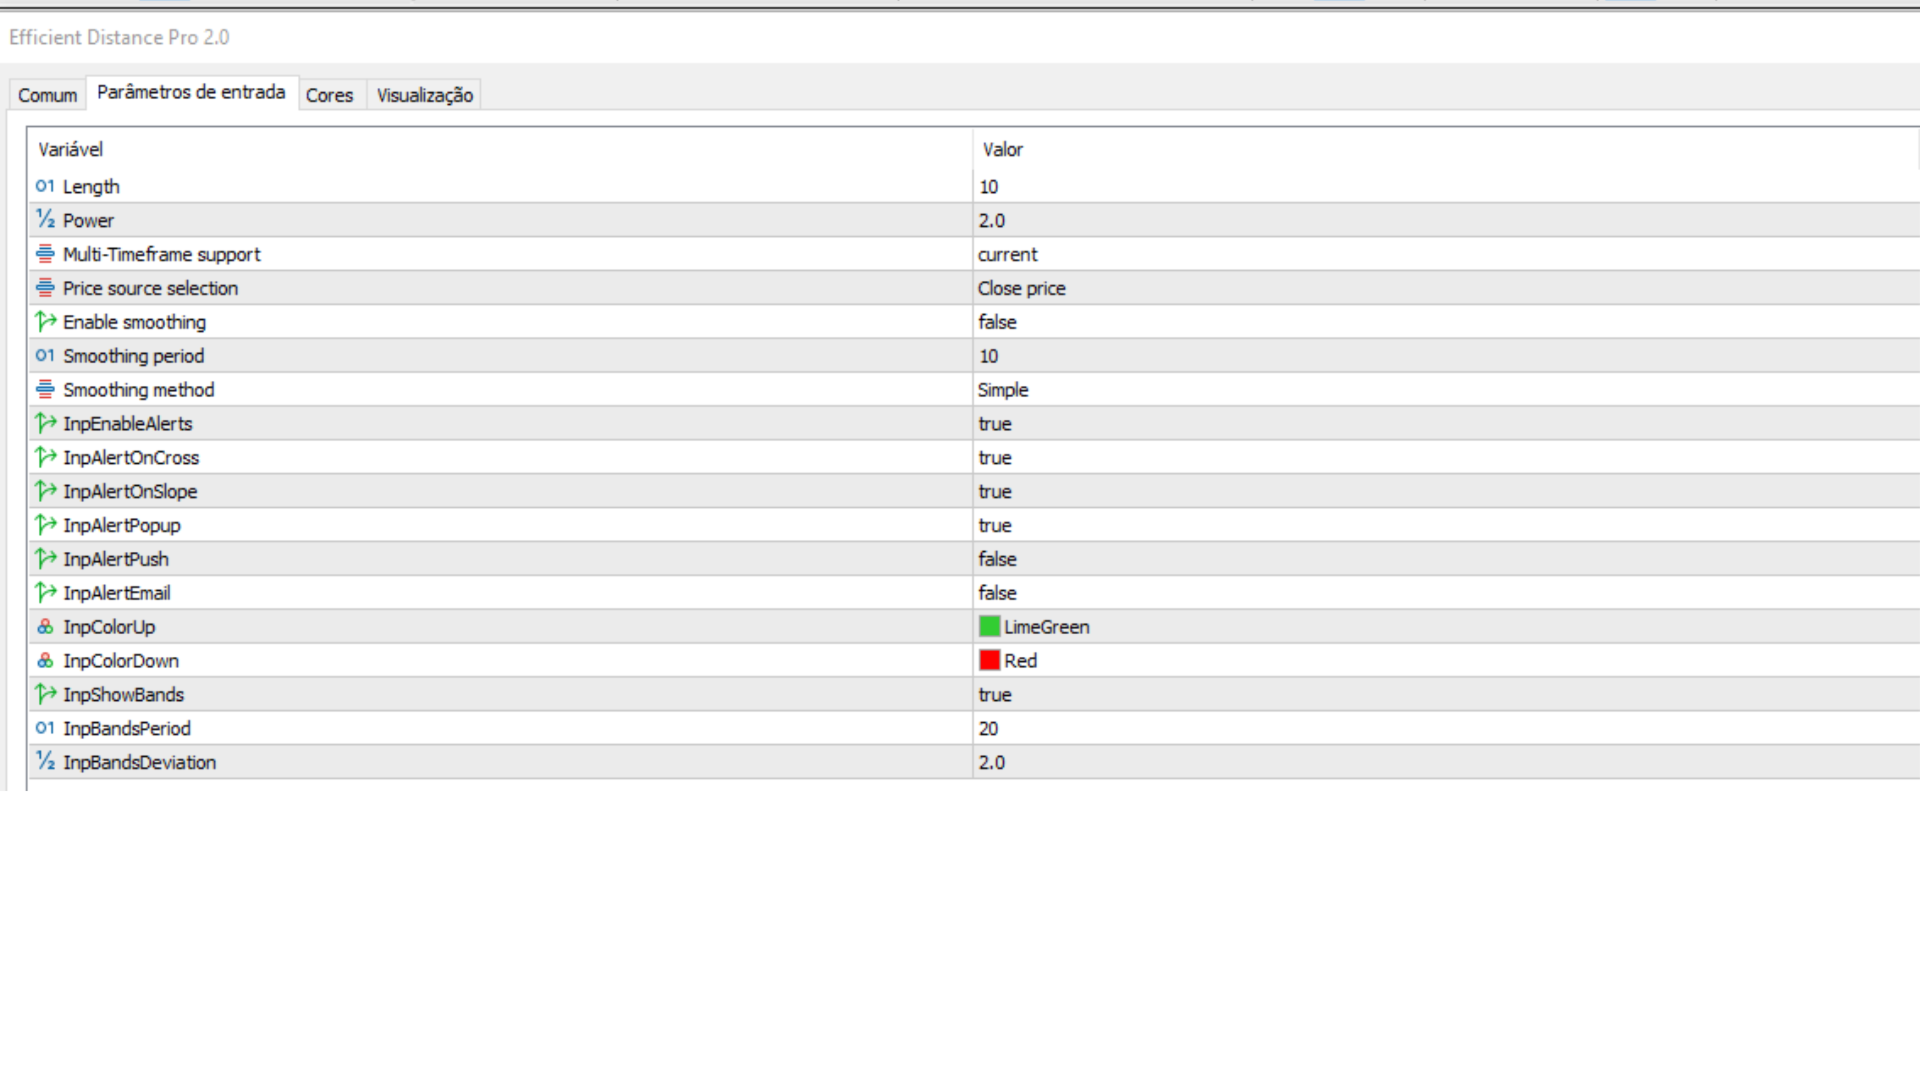
Input Parameters
- Length : The main calculation period for the baseline.
- Power : The exponent for volatility weighting. Higher values increase sensitivity.
- InpTimeframe : Select the timeframe for the indicator's calculation (Multi-Timeframe).
- InpAppliedPrice : The price source for calculation (Close, Open, Median, etc.).
- InpSmooth : Enable/disable a secondary smoothing average on the main line.
- InpSmoothPeriod : The period for the secondary smoothing.
- InpSmoothMethod : The method (SMA, EMA, etc.) for the secondary smoothing.
- InpEnableAlerts : Globally enable or disable all alerts.
- InpAlertOnCross : Alert when price crosses the main indicator line.
- InpAlertOnSlope : Alert when the main line's slope changes direction.
- InpAlertPopup / InpAlertPush / InpAlertEmail : Choose your preferred alert delivery method.
- InpColorUp / InpColorDown : Customize the colors for the rising and falling main line.
- InpShowBands : Show or hide the volatility bands.
- InpBandsPeriod : The calculation period for the volatility bands' standard deviation.
- InpBandsDeviation : The deviation multiplier for the bands' width.
User Manual - Version 2.0
Section 1: Installation
To install the Efficient Distance Pro indicator in MetaTrader 5, please follow these steps:
- Open MetaTrader 5.
- Go to File > Open Data Folder. A new window will open showing the terminal's data directory.
- Inside the data folder, navigate to MQL5 > Indicators.
- Copy the Efficient Distance Pro.mq5 or Efficient Distance Pro.ex5 file into this 'Indicators' folder.
- Return to MetaTrader 5. In the Navigator window, right-click on "Indicators" and select Refresh.
- You will now find "Efficient Distance Pro" in your list of indicators in the Navigator. Drag and drop it onto any chart to begin.
Section 2: Strategy Overview
Efficient Distance Pro is a comprehensive channel indicator that provides a dynamic baseline and volatility-based bands to help traders understand market trends, momentum, and potential reversal points. It is designed to be a central component of a trading strategy.
The Core Line (Efficient Distance)
The central line is not a simple moving average. It's a weighted average where the "distance" or difference between prices is a key factor. The calculation uses a Power parameter to give more weight to larger price movements, making it more responsive during high volatility. This line is designed to act as a dynamic support and resistance level. Its color indicates the current momentum:
- Green (or InpColorUp ): The line is sloping upwards, suggesting bullish momentum.
- Red (or InpColorDown ): The line is sloping downwards, suggesting bearish momentum.
The Volatility Bands
The upper and lower bands are calculated by adding and subtracting a multiple of the standard deviation from the core line. They create a channel that visualizes the expected range of price action. When the price hits or exceeds these bands, it can be considered overextended, often preceding a consolidation or reversal. Widening bands indicate increasing volatility, while narrowing bands signal a decrease in volatility and a potential breakout ahead.
Section 3: Detalhamento dos Parâmetros
This section provides a complete explanation of every input parameter available in the indicator's settings menu.
Main Calculation Settings
- Length : An integer that defines the primary lookback period for the baseline calculation. A shorter length makes the indicator faster and more sensitive; a longer length makes it smoother.
- Power : A double value (e.g., 2.0) that acts as an exponent in the weighting formula. Values greater than 1.0 will amplify the effect of larger price differences, increasing the indicator's responsiveness to volatility.
- InpTimeframe : Allows you to run the indicator's calculation on a higher timeframe than the one on your chart. For example, you can view the H1 channel on an M15 chart. Default is PERIOD_CURRENT .
- InpAppliedPrice : The price data used for all calculations. The default is PRICE_CLOSE , but you can choose from Open, High, Low, Median, etc., to tailor the indicator to your strategy.
Smoothing Settings
- InpSmooth : A true/false toggle to enable or disable an additional moving average applied directly to the main 'Efficient Distance' line for extra smoothness.
- InpSmoothPeriod : The period for the smoothing moving average. Only active if InpSmooth is true.
- InpSmoothMethod : The calculation method for the smoothing average (e.g., SMA, EMA, SMMA, LWMA). Only active if InpSmooth is true.
Alert System Settings
- InpEnableAlerts : The master switch (true/false) to turn all indicator alerts on or off.
- InpAlertOnCross : Set to true to receive an alert when the chart price crosses above or below the main indicator line.
- InpAlertOnSlope : Set to true to receive an alert when the indicator's main line changes direction (e.g., from falling to rising).
- InpAlertPopup : Enable/disable MetaTrader's native on-screen pop-up alerts.
- InpAlertPush : Enable/disable push notifications sent to your mobile MetaTrader 5 app. Requires configuration in your terminal settings.
- InpAlertEmail : Enable/disable email alerts. Requires configuration in your terminal settings.
Visual Settings
- InpColorUp : Sets the color of the main line when it is rising.
- InpColorDown : Sets the color of the main line when it is falling.
- InpShowBands : A true/false toggle to show or hide the upper and lower volatility bands.
- InpBandsPeriod : The lookback period used to calculate the standard deviation for the bands.
- InpBandsDeviation : The multiplier for the standard deviation. A higher value creates wider bands; a lower value creates narrower bands. 2.0 is a common value.
Section 4: Practical Usage Examples
The following are textual descriptions of chart scenarios to help you interpret the indicator's signals.
1. Ideal Buy Signal (Uptrend)
Scenario: On a EURUSD H1 chart, the market is in a clear uptrend. Indicator's Appearance: The Efficient Distance main line is consistently colored green and is sloping upwards. The volatility bands are angled upwards as well, possibly widening, which indicates strong bullish momentum. Signal: The price pulls back from its highs and touches or slightly penetrates the lower volatility band. At the same time, the main line remains green and does not flatten. This indicates that the pullback is likely a dip within a strong uptrend, presenting a high-probability buying opportunity. An entry can be considered as the price bounces off the lower band and a new candle closes bullishly.
2. Ideal Sell Signal (Downtrend)
Scenario: On a GBPJPY M30 chart, the price has been making lower lows and lower highs. Indicator's Appearance: The Efficient Distance main line is colored red and has a clear downward slope. The volatility bands are angled downwards. Signal: The price rallies briefly, moving up towards the channel's center or touching the upper volatility band. This rejection from the upper band, while the main line remains red, signals that the rally is weak and the downtrend is likely to resume. A sell entry could be placed as the price is rejected from the upper band and a bearish candle forms.
3. Sideways Market (Signal to Ignore)
Scenario: On a USDCHF H4 chart, the price is moving without a clear direction, trapped in a range. Indicator's Appearance: The Efficient Distance main line is mostly flat and is frequently changing color between green and red. The upper and lower volatility bands are also flat and are positioned close together (narrow channel). Signal: The price will bounce between the upper and lower bands. While these touches might seem like signals, the lack of a clear trend (flat, color-changing line) and low volatility (narrow bands) means these signals are unreliable and have a low probability of resulting in a significant move. This is a clear sign to stay out of the market and wait for volatility to return and a trend to establish.
Section 5: Frequently Asked Questions (FAQ)
1. Does the indicator repaint? No. Efficient Distance Pro is a 100% non-repainting indicator. Its calculations use only historical and current bar data. A signal becomes final once the bar closes and will never change in the past. 2. Which instruments and timeframes work best? The indicator is universal and works on all instruments (Forex, Crypto, Indices, etc.) and timeframes. For day trading, M15, M30, and H1 are popular choices. For swing trading, H4 and D1 are recommended. Always use the MTF feature to check the trend on a higher timeframe for better context. 3. How do the alerts work? The alerts trigger on the close of the bar when a condition is met. For example, if 'Alert on Cross' is on, you will get an alert as soon as a bar closes above or below the indicator line. This prevents multiple false alerts on the same bar while it's still forming. 4. What do the different line colors mean? The main line's color is based on its slope. The default is Green for a rising slope (bullish momentum) and Red for a falling slope (bearish momentum). You can customize these colors in the input settings. 5. Can I turn off the bands and just use the main line? Yes. In the input settings, simply set the InpShowBands parameter to 'false'. This will hide the upper and lower bands, leaving only the main Efficient Distance line on your chart. 6. How does the Multi-Timeframe (MTF) feature work? By changing the InpTimeframe parameter, you can instruct the indicator to perform all its calculations using data from a different timeframe. For example, setting it to H4 while on an M15 chart will display the H4 channel on your M15 chart. This is excellent for aligning short-term entries with the long-term trend.Section 6: Risk Disclaimer
Trading in financial markets involves substantial risk and is not suitable for all investors. The value of investments can go down as well as up, and you may lose your entire invested capital. Efficient Distance Pro is a tool for analysis and does not provide financial advice or guaranteed signals. Past performance is not indicative of future results. Always use proper risk management and never risk more than you are prepared to lose. The developer is not responsible for any losses incurred from the use of this software.