Smoothed Relative Strength Index indicator MT5
- Indicators
- Eda Kaya
- Version: 1.3
Smoothed Relative Strength Index (RSI) indicator for MetaTrader 5
The Smoothed Relative Strength Index (RSI) indicator for MetaTrader 5 is a refined oscillator designed to help traders detect potential reversal zones based on smoothed RSI data. This indicator modifies traditional RSI behavior by implementing a smoothing mechanism, which filters out erratic market noise.
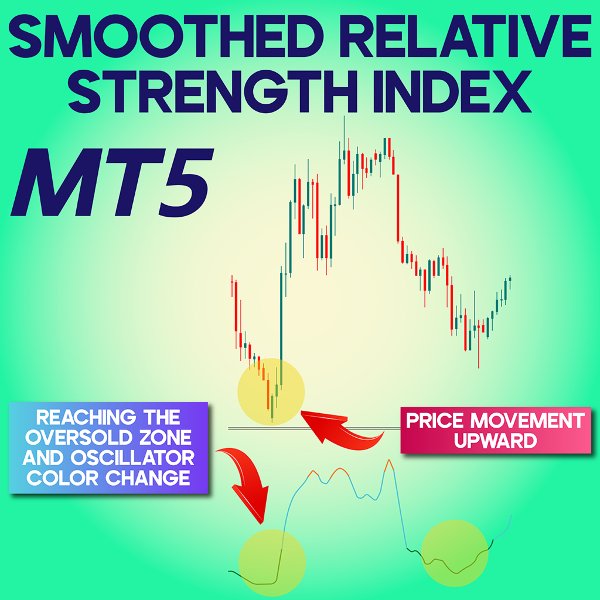
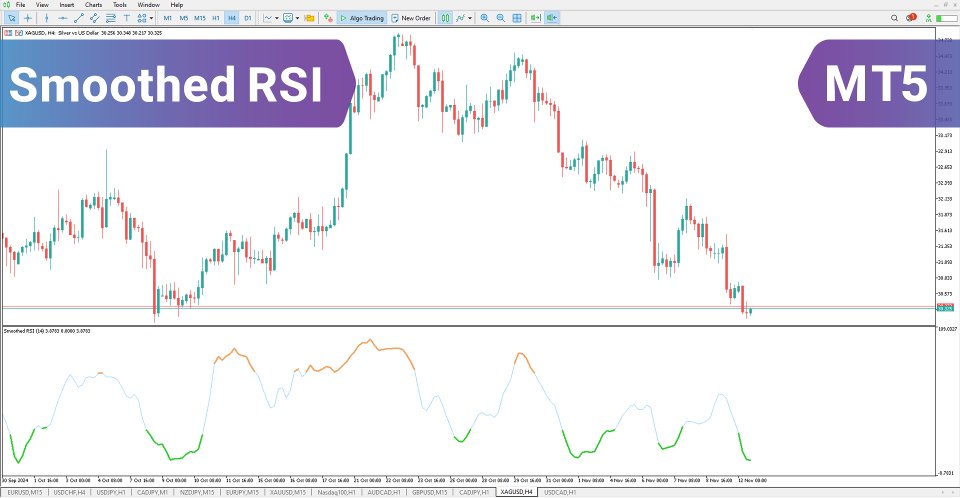
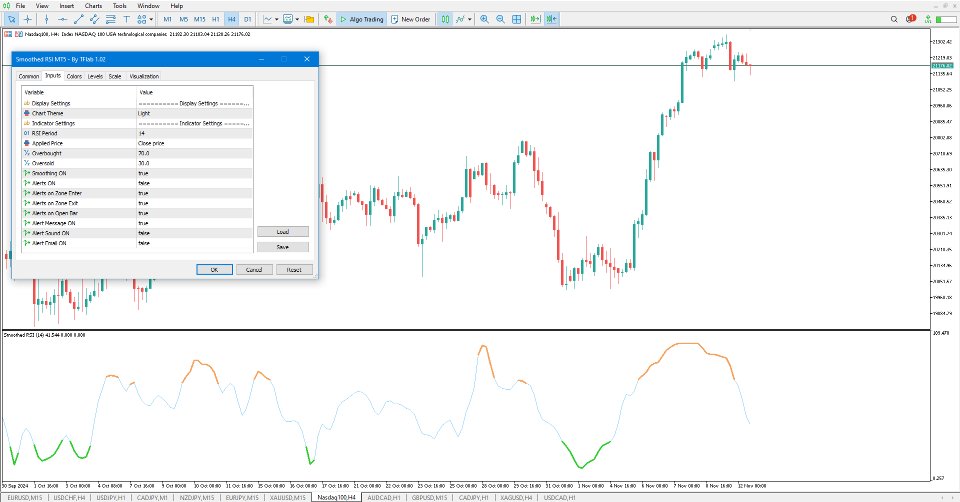
When the price enters a high-risk (overbought) zone, the line turns orange; in the low-risk (oversold) zone, it shifts to green. Notification alerts are triggered as the RSI crosses into these critical levels, enhancing real-time decision-making.
Through the integration of a smoothed average, the tool enhances RSI stability—minimizing sharp swings and improving signal clarity. As a result, traders can base entries and exits on cleaner, more reliable RSI dynamics.
«Indicator Installation & User Guide»
MT5 Indicator Installation | Smoothed Relative Strength Index indicator MT4 | ALL Products By TradingFinderLab | Best MT5 Indicator: Refined Order Block Indicator for MT5 | Best MT5 Utility: Trade Assistant Expert TF MT5 | TP & SL Tool: Risk Reward Ratio Calculator RRR MT5 | Money Management: Easy Trade Manager MT5 | Trade Copier: Free Fast Local Trade Copier MT5
RSI Indicator Table
| Category | Oscillator – Momentum – Signal Tool |
| Platform | MetaTrader 5 |
| Skill Level | Beginner-Friendly |
| Indicator Type | Strength – Trend Reversal – Signal-Based |
| Time Frame | Multiple Chart Timeframes |
| Trading Style | Scalping – Day Trade – Short-Term |
| Markets | Forex – Crypto – Indexes |
Indicator Overview
The Smoothed RSI Oscillator upgrades the traditional RSI by reducing volatility through data smoothing. It dynamically identifies and visually marks overbought conditions (orange) and oversold conditions (green), allowing traders to anticipate potential reversals or market corrections.
By filtering noise, it produces more actionable signals and reduces false entries.
Oversold Zone Behavior
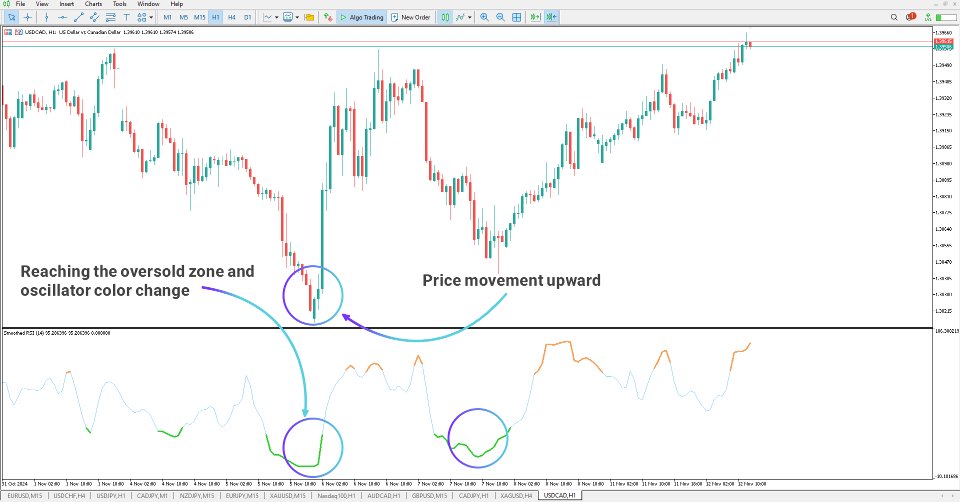
On the USD/CAD 1-hour timeframe, the Smoothed RSI highlights the oversold condition by switching the RSI line to green and triggering a zone alert. This smoothed version effectively removes unnecessary RSI jitters, offering clearer opportunities to enter long positions based on real momentum weakness.
Overbought Zone Behavior
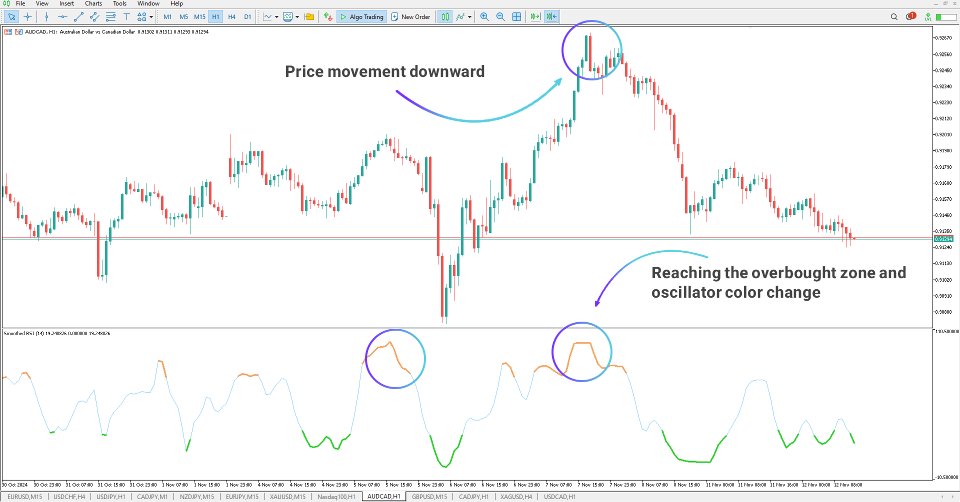
On the ADA/CAD chart (1-hour), the RSI reaches the overbought threshold, changing to orange and generating an alert. This visual and auditory signal helps traders evaluate potential exit points or short setups as momentum shows signs of exhaustion.
Settings for Smoothed RSI Indicator
Display Options:
• Chart Background Style – Customize chart visuals
Indicator Configuration:
• RSI Length – Define the calculation period
• Source Price – Select input data for calculations
• Overbought Threshold – Configure upper limit
• Oversold Threshold – Configure lower limit
• Enable Smoothing – Toggle filter on/off
• Enable Alerts – Turn alert notifications on/off
• Alert on Zone Entry – Notify on crossing into key levels
• Alert on Zone Exit – Notify on leaving key levels
• Alert on Close – Trigger alert once candle closes beyond threshold
• Text Alerts – On-screen alert messages
• Sound Alerts – Beep or tone notifications
• Email Alerts – Activate email-based notifications
Summary
The Smoothed Relative Strength Index (RSI) indicator for MetaTrader 5 is a powerful addition to any trader's toolkit.
By dynamically highlighting overbought (orange) and oversold (green) zones and integrating multiple alert mechanisms, it enables faster and more confident decision-making. The smoothing algorithm significantly enhances the original RSI by eliminating erratic fluctuations, producing more stable and trustworthy signals across all market types.
