Asia Dealing Range with STDV

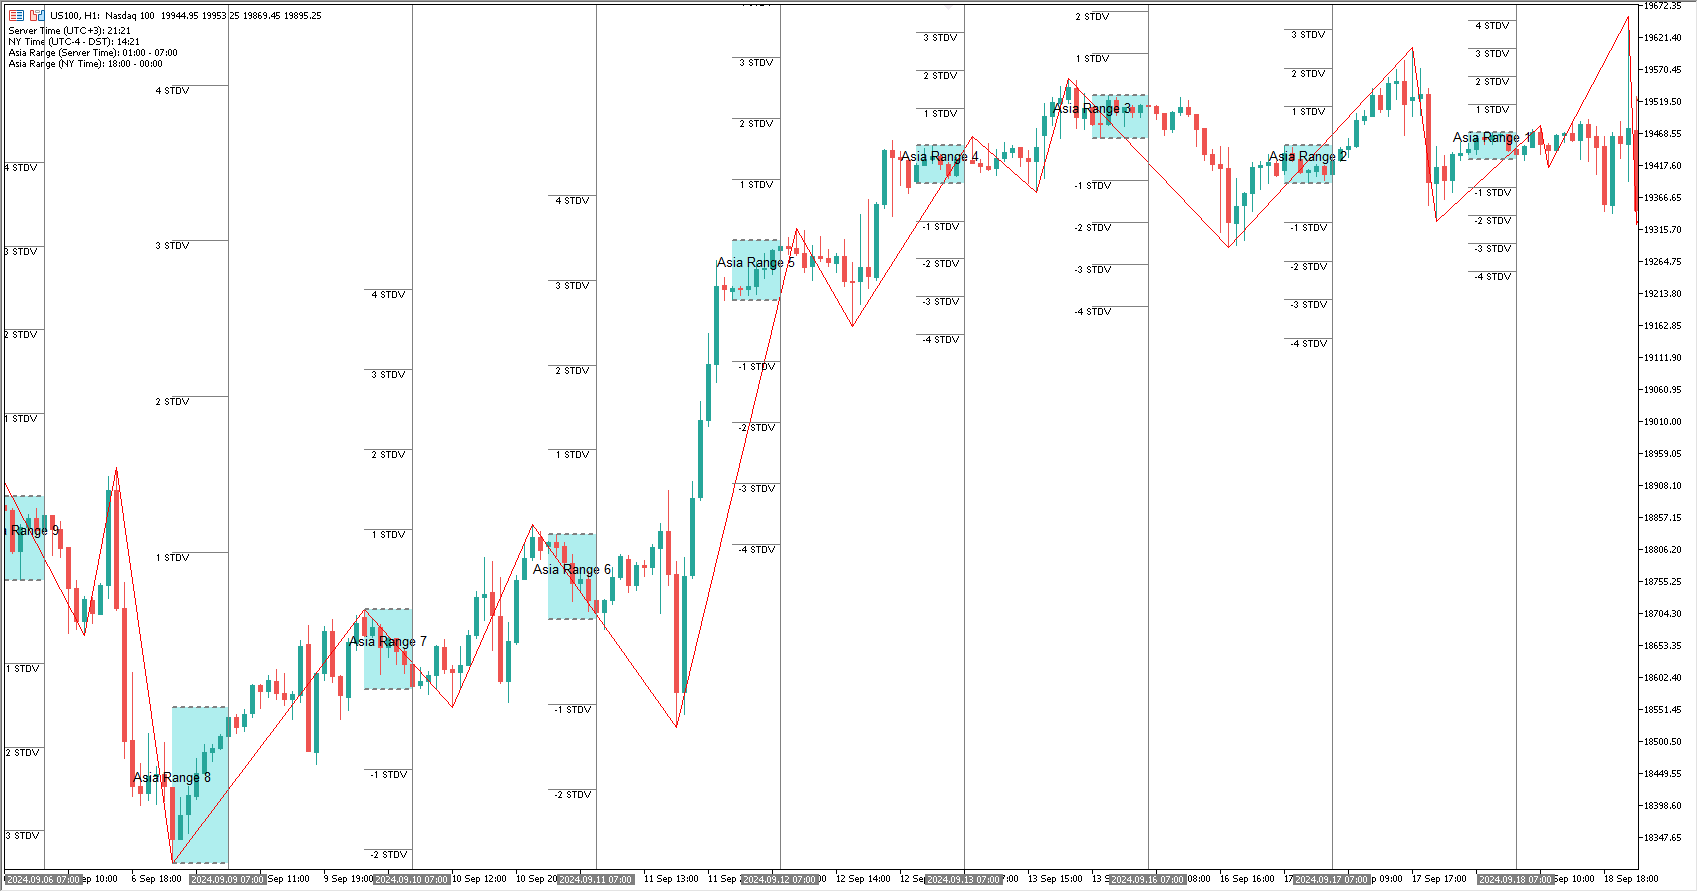
Asia Range STDV Indicator

This Indicator is designed not only to identify the Asia session trading range and Standard Deviation levels but also to assist traders in creating a systematic entry and exit strategy based on the higher timeframe daily trend. The indicator supports both bullish and bearish scenarios, allowing traders to focus on key moments when the Asia range's high or low is "swept" (broken) in line with the confirmed trend.

Strategy Overview:

1. Confirming the Daily Trend (Bullish or Bearish):

  • Bullish Trend: The user confirms that the higher timeframe (daily) is in an uptrend, meaning the market has been making higher highs and higher lows.
  • Bearish Trend: The user confirms that the higher timeframe (daily) is in a downtrend, meaning the market has been making lower highs and lower lows.
  • This trend confirmation becomes the primary filter for deciding the trade direction and whether to focus on the Asia range low or Asia range high being swept.

2. Bullish Example – Buy Setup (Asia Low Sweep):

  • Wait for the Asia Low to be Swept: In a bullish daily trend, the focus is on the Asia session low. Once price sweeps below this low (a stop hunt or liquidity grab below the Asia range), this creates a potential buy setup.
  • 15-Minute Market Structure Shift: After the sweep, the user waits for a 15-minute market structure shift (e.g., a break of a recent swing high). This confirms the potential for the market to reverse and move higher.
  • Stop Loss: Place the stop loss below the -1 or -2 Standard Deviation levels, which are plotted below the Asia range. This gives the trade room to develop while keeping the stop loss at a logical level below where the sweep occurred.
  • Take Profit: The target can be set at any positive Standard Deviation level (+1, +2, +3, or +4 STDV), which are plotted above the Asia range.

3. Bearish Example – Sell Setup (Asia High Sweep):

  • Wait for the Asia High to be Swept: In a bearish daily trend, the focus is on the Asia session high. Once price sweeps above this high (a stop hunt or liquidity grab above the Asia range), this creates a potential sell setup.
  • 15-Minute Market Structure Shift: After the sweep, the user waits for a 15-minute market structure shift (e.g., a break of a recent swing low). This confirms the potential for the market to reverse and move lower.
  • Stop Loss: Place the stop loss above the +1 or +2 Standard Deviation levels, which are plotted above the Asia range. This protects the trade if the market continues to rally after the sweep.
  • Take Profit: The target can be set at any negative Standard Deviation level (-1, -2, -3, or -4 STDV), which are plotted below the Asia range.

Key Components of the Strategy:

1. Daily Timeframe Trend Confirmation:

  • Before taking any trades, the trader must confirm whether the higher timeframe daily trend is bullish or bearish. This trend confirmation filters out counter-trend trades and aligns the strategy with the broader market movement.

2. Asia Range Sweep:

  • In a bullish scenario, the trader waits for the Asia low to be swept (price breaks below it), and in a bearish scenario, they wait for the Asia high to be swept (price breaks above it).
  • A sweep suggests a potential liquidity grab (where stop-losses of previous positions are triggered), creating an opportunity for a reversal.

3. 15-Minute Market Structure Shift:

  • Once the sweep occurs, the trader looks for a shift in the 15-minute market structure in the direction of the main trend. In a bullish case, this would be a break of a swing high, signaling that buyers have regained control. In a bearish case, it would be a break of a swing low, signaling that sellers have regained control.

4. Risk Management:

  • Stop Loss: The stop loss is placed at logical levels that correspond to either the -1 or -2 Standard Deviation for bullish trades or the +1 or +2 Standard Deviation for bearish trades. This ensures that the stop is set beyond the Asia range extremes, accounting for possible volatility.
  • Take Profit: The take profit can be set at any positive STDV for bullish trades or negative STDV for bearish trades, depending on how far the trader expects the market to move in the direction of the main trend.

Indicator Outputs:

  1. Asia Range High and Low: Two horizontal lines representing the high and low of the Asia session, which is from 18:00 (previous day) to 00:00 (current day) New York time.
  2. Asia Range Rectangle: A rectangle visually filling the area between the Asia session high and low to help easily identify the range.
  3. Standard Deviation Levels: 1st, 2nd, 3rd, and 4th standard deviations plotted both above and below the Asia range, providing key areas to set stop-losses and take profits.
  4. Multiple Session Visualization: The indicator can display multiple previous Asia sessions (as defined by a user parameter) along with their respective standard deviations and vertical session end lines.
  5. Vertical Session End Line: A vertical line marking the end of the Asia session (at midnight NY time), helping the trader visually differentiate between sessions.
  6. Chart Comment: Displays the server and NY time, including whether daylight saving is being observed, and the Asia session start and end times in both server and NY time.

How to Use:

  1. Determine the Trend: Look at the daily chart to confirm whether the market is in a bullish or bearish trend.
  2. Wait for a Sweep: Once the Asia range is established, wait for the high or low to be swept based on the direction of the trend.
  3. Look for Market Structure Shift: After the sweep, switch to the 15-minute timeframe and look for a shift in market structure (either a break of a swing high for buys or a swing low for sells).
  4. Place Entry, Stop Loss, and Take Profit: Enter the trade, set your stop loss at the nearest standard deviation level, and target the next opposite standard deviation level for take profit.


Recommended products
Hunttern ZigZag MT5
Hassan Gh Fakhraei
5 (1)
Hunt markets with Hunttern ZigZag . Easy to use with one parameter    You can use it for the following:       -Classic patterns       -Heads and shoulders       -Harmonic patterns       -Elliott Wave       -Support and resistance       -Supply and Demand Single parameter:      -Period (1-120) Features:        -Candle time        -Single parameter        -Light mode template This is version 1 of Hunttern ZigZag. We are very happy to receive feedback from you.
FREE
Free automatic Fibonacci is an indicator that automatically plots a Fibonacci retracement based on the number of bars you select on the BarsToScan setting in the indicator. The Fibonacci is automatically updated in real time as new highest and lowest values appears amongst the selected bars. You can select which level values to be displayed in the indicator settings. You can also select the color of the levels thus enabling the trader to be able to attach the indicator several times with differe
FREE
Development of the previous version of the indicator ZigZag WaveSize MT4 ZigZag WaveSize - modified standard ZigZag indicator with added information about wave length in points, levels, and different alert logic General Improvements: Code adaptation for MetaTrader 5 Optimized work with graphical objects New Features: Horizontal levels at extremes Selection of level types: horizontal/rays/segments Filter for liquidity levels (not broken by price) Buffer for breakouts: adjusting sensitivity to f
FREE
Cipher B Divergences
Alberto Gauer Borrego
4.8 (5)
Finally a Metatrader version of the very popular (and expensive) Market Cipher B indicator, or the Vumanchu Cipher B + Divergences very popular on Tradingview platform. This tool is very heavy on calculations, total are 31 plots using 97 buffers from several indicators. On my mid end computer, timeframes below M15 start getting a bit laggy, so it would require a powerful computer to run it properly at very low timeframes. It's still usable here, but somewhat sluggish response in Metatrader (lik
FREE
Necessary for traders: tools and indicators Waves automatically calculate indicators, channel trend trading Perfect trend-wave automatic calculation channel calculation , MT4 Perfect trend-wave automatic calculation channel calculation , MT5 Local Trading copying Easy And Fast Copy , MT4 Easy And Fast Copy , MT5 Local Trading copying For DEMO Easy And Fast Copy , MT4 DEMO Easy And Fast Copy , MT5 DEMO MACD is called Convergence and Divergence Moving Average, which is developed from the double e
FREE
Fibonacci Progression with Breaks Indicator MT5 Fibonacci Progression with Breaks Indicator MT5 interprets market price shifts incrementally, following the principles of the Fibonacci sequence. This technical indicator initiates from a key pivot and plots Fibonacci-based price zones aligned with the prevailing trend direction. Additionally, it highlights trade opportunities by displaying green and red arrows to indicate potential buy or sell setups. «Indicator Installation & User Guide» MT5 Ind
FREE
Pivots Lines
Abakou Nazaire Ayelenou
5 (1)
Draw pivots points Traditionnal, Fibonacci, Woodie, Classic, Demark, Camarilla for any timeframe Support all type of pivot  Traditionnal ,   Fibonacci ,   Woodie ,   Classic ,   Demark ,   Camarilla Support any timeframe (M1...H1...D1...MN1...Yearly) Support server Daylight Saving Time Support forex daily section from Sydney open to US Close Support Crypto trading Fill The gap between pivot and the trend, very helpfull Pivot points show the direction of the trend and provide definitive areas to
FREE
Valable ZigZag MT5
Sergey Ermolov
4.61 (18)
MT4 version  | Trend Monitor VZ Indicator  |   Owl Smart Levels Indicator  |  Owl Smart Levels Strategy  |  FAQ Elliott wave theory is an interpretation of processes in financial markets that relies on a visual model of waves on price charts. The Valable ZigZag indicator displays the wave structure of the market, which can be used to make trading decisions. The Valable ZigZag indicator is more stable and does not often change its direction like the classic ZigZag indicator, misleading traders.
FREE
Anti Crab Harmonic Pattern Indicator for MT5 The Anti Crab Harmonic Pattern Indicator on MetaTrader 5 uses specific Fibonacci ratios—such as 0.618, 1.27, and 2.27—to accurately pinpoint potential price reversal zones. It visually displays bullish patterns in red and bearish patterns in blue. «Indicator Installation & User Guide» MT5 Indicator Installation  | Anti Crab Harmonic Pattern Indicator MT4 | ALL Products By  TradingFinderLab  | Best MT5 Indicator:  Refined Order Block Indicator for MT 5
FREE
Bollinger Bands B
Flavio Javier Jarabeck
4.5 (2)
John Bollinger created this indicator in 2010 as a way to read the original indicator (Bollinger Bands) in a more "technical" way, shown as an oscillator. The typical range of the Bollinger Bands %B is 0 - 0.5 - 1.0, where "0" represents the lower band, the "0.5" the middle band, and "1" the upper band. The line on the indicator represents the Closing prices. As simple as that. SETTINGS Bollinger Bands period of analysis Standard Deviation multiplier Shift Price type to be analyzed If you like
FREE
All Harmonics 26 demo
Alexey Isavnin
4.25 (4)
This is the demo version of "All Harmonics 26" indicator . "All Harmonics 26" searches for 26 types of harmonic patterns and outputs them in a convenient way. You can check out the documentation here . This demo version has the following limitations: The indicator searches only for one type of harmonic patterns out of 26:- Gartley. The indicator outputs new patterns with a lag of 10 bars.
FREE
Functional in the Forex market. Functional in the B3 market - Bolsa Brasil Balcão. Motivation The technical Fibonacci retraction indicator for many is essential and the basis for all market movement forecasts. The name of the tool comes from the Italian mathematician Leonardo de Pisa (13th century). This DEMO version will work in Meta Trader with Demo and Strategy Tester. To purchase the Full version that works on a Real account, click on: https://www.mql5.com/en/market/product/38089 Opera
FREE
Linear Regression Channel Indicator for MetaTrader5 The   Linear Regression Channel Indicator for MetaTrader5   is a specialized tool in the MetaTrader 5 indicator suite that automatically generates regression channels across price charts, enabling users to recognize bullish and bearish market phases through the slope direction of the channel. An upward (positive) slope reflects a bullish market, while a downward (negative) slope indicates a bearish trend. The second-level channel boundaries ser
FREE
Babel Assistant
Iurii Bazhanov
4.5 (8)
Babel assistant 1     The MT5 netting “Babel_assistant_1” robot uses the ZigZag indicator to generate Fibonacci levels on M1, M5, M15, H1, H4, D1, W1  periods of the charts , calculates the strength of trends for buying and selling. It opens a position with "Lot for open a position" if the specified trend level 4.925 is exceeded. Then Babel places pending orders at the some Fibonacci levels and places specified Stop Loss , Take Profit. The screen displays current results of work on the position
FREE
Reversal Composite Candles
MetaQuotes Ltd.
3.69 (16)
The idea of the system is to indentify the reversal patterns using the calculation of the composite candle. The reversal patterns is similar to the "Hammer" and "Hanging Man" patterns in Japanese candlestick analysis. But it uses the composite candle instead the single candle and doesn't need the small body of the composite candle to confirm the reversal. Input parameters: Range - maximal number of bars, used in the calculation of the composite candle. Minimum - minimal size of the composite can
FREE
PZ Penta O MT5
PZ TRADING SLU
3.5 (4)
The Penta-O is a 6-point retracement harmonacci pattern which usually precedes big market movements. Penta-O patterns can expand and repaint quite a bit. To make things easier this indicator implements a twist: it waits for a donchian breakout in the right direction before signaling the trade. The end result is an otherwise repainting indicator with a very reliable trading signal. The donchian breakout period is entered as an input. [ Installation Guide | Update Guide | Troubleshooting | FAQ | A
FREE
5-0 Harmonic Pattern Indicator MT5 The 5-0 Harmonic Pattern indicator is one of the specialized tools for identifying harmonic patterns in the Forex market, available on the MetaTrader 5 platform. Traders can develop more precise trading strategies and identify potential price reversal areas (PRZ) by using this indicator in combination with technical analysis. «Indicator Installation & User Guide» MT5 Indicator Installation  |  Five zero Harmonic Pattern Indicator MT4  | ALL Products By  Trading
FREE
Anti Butterfly Harmonic Pattern Indicator MT5 The Anti Butterfly Harmonic Pattern Indicator on the MetaTrader 5 platform automatically detects harmonic pattern points X, A, B, C, and D directly on the chart. It analyzes price data and calculates Fibonacci ratios with high accuracy, enabling precise identification of potential reversal zones. «Indicator Installation & User Guide» MT5 Indicator Installation  | Anti Butterfly Harmonic Pattern Indicator MT4  | ALL Products By  TradingFinderLab  | Be
FREE
Reversal Oscillator — Advanced Momentum Shift Detector Reversal Oscillator is a free indicator designed to highlight price zones that are statistically outside their normal movement patterns, helping traders anticipate potential turning points before they occur. Unlike traditional oscillators that react mainly to overbought/oversold conditions, this indicator applies third derivative analysis (the "acceleration of the acceleration" of price) calculated using two independent methods within a n
FREE
Classic Shark Harmonic Pattern Indicator for MetaTrader 5 The Classic Shark Harmonic Pattern Indicator utilizes specific Fibonacci ratios—such as 88.6%, 113%, and 161.8%—to detect potential price reversal zones. By recognizing the geometric configuration of the pattern, the indicator automatically draws the Shark pattern on the chart and highlights the Potential Reversal Zone (PRZ) when conditions are met. «Indicator Installation & User Guide» MT5 Indicator Installation  |  Classic Shark Harmon
FREE
Forex X Code Indicator for MT5 The   Forex X Code Indicator for MT5   is a specialized tool integrated into the MetaTrader 5 platform, tailored for identifying market trends and signaling potential trade opportunities in the Forex environment. Utilizing price behavior patterns, it monitors directional movement and highlights optimal zones for entering or exiting trades. Graphically, this indicator appears as color-coded bars—blue signifying bullish momentum and red representing bearish pressure.
FREE
Parabolic SAR Color Alert Indicator MT5 The   Parabolic SAR Color Alert Indicator MT5   applies dynamic-colored dots to visually represent the direction of the market trend. In this indicator, the dots appear either above or beneath the candlesticks to signal momentum shifts. Specifically,   blue dots below the candles   highlight bullish movement, while   pink dots above the candles   confirm bearish momentum. «Indicator Installation & User Guide» MT5 Indicator Installation  |  Parabolic SAR C
FREE
Necessary for traders: tools and indicators Waves automatically calculate indicators, channel trend trading Perfect trend-wave automatic calculation channel calculation , MT4 Perfect trend-wave automatic calculation channel calculation , MT5 Local Trading copying Easy And Fast Copy , MT4 Easy And Fast Copy , MT5 Local Trading copying For DEMO Easy And Fast Copy , MT4 DEMO Easy And Fast Copy , MT5 DEMO The homeopathic indicator is also called the CCI indicator. The CCI indicator was proposed
FREE
Intraday Momentum Index IMI
Danilo Hudson Couto Monteiro
Indicador IMI (Intraday Momentum Index) Descrição O Indicador IMI (Intraday Momentum Index) é uma poderosa ferramenta de análise técnica desenvolvida para identificar a força do momentum e potenciais reversões no mercado. Este indicador quantifica a relação entre ganhos e perdas durante um período específico, ajudando traders a avaliar a dinâmica atual do mercado. Características Oscila entre 0 e 100, facilitando a interpretação das condições de mercado Identifica com precisão áreas de sobrecomp
FREE
The indicator highlights the points that a professional trader sees in ordinary indicators. VisualVol visually displays different volatility indicators on a single scale and a common align. Highlights the excess of volume indicators in color. At the same time, Tick and Real Volume, Actual range, ATR, candle size and return (open-close difference) can be displayed. Thanks to VisualVol, you will see the market periods and the right time for different trading operations. This version is intended f
FREE
The Trend Catcher: The Trend Catcher Strategy with Alert Indicator is a versatile technical analysis tool that aids traders in identifying market trends and potential entry and exit points. It features a dynamic Trend Catcher Strategy , adapting to market conditions for a clear visual representation of trend direction. Traders can customize parameters to align with their preferences and risk tolerance. The indicator assists in trend identification, signals potential reversals, serves as a trail
FREE
1. Overview The ATR Dynamic Stop (CE) is a powerful technical indicator designed to help traders identify and follow market trends. Its core function is to provide a dynamic trailing stop-loss based on price volatility, as measured by the Average True Range (ATR) indicator. The main objectives of the ATR Dynamic Stop are: Profit Optimization: It helps you ride a strong trend by setting a reasonable stop-loss, preventing premature exits due to minor market noise and fluctuations. Risk Management:
FREE
Value Chart Candlesticks
Flavio Javier Jarabeck
4.69 (13)
The idea of a Value Chart indicator was presented in the very good book I read back in 2020 , " Dynamic Trading Indicators: Winning with Value Charts and Price Action Profile ", from the authors Mark Helweg and David Stendahl. The idea is simple and the result is pure genius: Present candlestick Price analysis in a detrended way! HOW TO READ THIS INDICATOR Look for Overbought and Oversold levels. Of course, you will need to test the settings a lot to find the "correct" one for your approach. It
FREE
Bollinger Squeeze Basic Indicator for MT5 The Bollinger Squeeze Basic indicator is based on the concept of market compression. When the Bollinger Bands contract within the Keltner Channel, it may signal a temporary drop in volatility and the potential for a significant price movement. This technical analysis tool illustrates squeeze conditions and shifts in volatility through colored bars and dots displayed in the oscillator window. «Indicator Installation & User Guide» MT5 Indicator Installati
FREE
Classic Cypher Harmonic Pattern Indicator for MT5 The Classic Cypher Harmonic Pattern Indicator is a technical analysis tool based on harmonic structures and designed with asymmetrical Fibonacci ratios. This indicator accurately identifies key points—X, A, B, C, and D—and marks significant potential reversal zones on the chart using red and gray lines for clear visual guidance. «Indicator Installation & User Guide» MT5 Indicator Installation  |  Classic Cypher Harmonic Pattern Indicator MT4  | A
FREE
Buyers of this product also purchase
Divergence Bomber
Ihor Otkydach
4.98 (65)
Each buyer of this indicator also receives the following for free: The custom utility "Bomber Utility", which automatically manages every trade, sets Stop Loss and Take Profit levels, and closes trades according to the rules of this strategy Set files for configuring the indicator for various assets Set files for configuring Bomber Utility in the following modes: "Minimum Risk", "Balanced Risk", and "Wait-and-See Strategy" A step-by-step video manual to help you quickly install, configure, and s
Trend Screener Pro MT5
STE S.S.COMPANY
4.87 (91)
Unlock the Power of Trends Trading with the Trend Screener Indicator: Your Ultimate Trend Trading Solution powered by Fuzzy Logic and Multi-Currencies System! Elevate your trading game with the Trend Screener, the revolutionary trend indicator designed to transform your Metatrader into a powerful Trend Analyzer. This comprehensive tool leverages fuzzy logic and integrates over 13 premium features and three trading strategies, offering unmatched precision and versatility. LIMITED TIME OFFER : Tre
Grabber System MT5
Ihor Otkydach
5 (15)
Let me introduce you to an excellent technical indicator – Grabber, which works as a ready-to-use "All-Inclusive" trading strategy. Within a single code, it integrates powerful tools for technical market analysis, trading signals (arrows), alert functions, and push notifications. Every buyer of this indicator also receives the following for free: Grabber Utility for automatic management of open orders Step-by-step video guide: how to install, configure, and trade with the indicator Custom set fi
Gold Stuff mt5
Vasiliy Strukov
4.92 (189)
Gold Stuff mt5 is a trend indicator designed specifically for gold and can also be used on any financial instrument. The indicator does not redraw and does not lag. Recommended time frame H1. Contact me immediately after the purchase to get   personal bonus!  You can get a free copy of our Strong Support and Trend Scanner indicator, please pm. me! Settings  and manual   here  Please note that I do not sell my EA's or special sets on telegram, it is only available on Mql5 and my set files are on
Trend indicator AI mt5
Ramil Minniakhmetov
5 (11)
Trend Ai indicator  mt5 is great tool that will enhance a trader’s market analysis by combining trend identification with actionable entry points and reversal alerts.  This indicator empowers users to navigate the complexities of the forex market with confidence and precision Beyond the primary signals, Trend Ai indicator identifies secondary entry points that arise during pullbacks or retracements, enabling traders to capitalize on price corrections within the established trend. Important Advan
How many times have you bought a trading indicator with great back-tests, live account performance proof with fantastic numbers and stats all over the place but after using it, you end up blowing your account? You shouldn't trust a signal by itself, you need to know why it appeared in the first place, and that's what RelicusRoad Pro does best! User Manual + Strategies + Training Videos + Private Group with VIP Access + Mobile Version Available A New Way To Look At The Market RelicusRoad is the
***  Entry In The Zone and SMC Multi Timeframe is a real-time market analysis tool developed based on the Smart Money Concepts (SMC) framework. It automatically analyzes reversal points and key zones across multiple timeframes, emphasizing No Repaint signals and highlighting Points of Interest (POI) .It also features an Auto Fibonacci Level System that automatically draws Fibonacci lines to help detect pullbacks and reversal points instantly. Most importantly, the signals help identify potentia
Algo Pumping
Ihor Otkydach
4.74 (19)
PUMPING STATION – Your Personal All-inclusive strategy Introducing PUMPING STATION — a revolutionary Forex indicator that will transform your trading into an exciting and effective activity! This indicator is not just an assistant but a full-fledged trading system with powerful algorithms that will help you start trading more stable! When you purchase this product, you also get FOR FREE: Exclusive Set Files: For automatic setup and maximum performance. Step-by-step video manual: Learn how to tr
TPSproTREND PrO MT5
Roman Podpora
4.72 (18)
Entry points at the bar close,  without redrawing .  Trend scanner  across all assets,  MTF - mode  and much more in one tool. We recommend using it together with   RFI LEVELS. ИНСТРУКЦИЯ RUS   /   INSTRUCTIONS  ENG         /         VERSION MT4   Main functions: Accurate entry signals WITHOUT REPAINTING! Once a signal appears, it remains valid! This is a significant distinction from repainting indicators that might provide a signal and then alter it, potentially leading to deposit losses. Now,
Matrix Arrow Indicator MT5
Juvenille Emperor Limited
5 (16)
Matrix Arrow Indicator MT5  is a unique 10 in 1 trend following   100% non-repainting  multi-timeframe indicator that can be used on all symbols/instruments:   forex,   commodities,   cryptocurrencies,   indices,   stocks .  Matrix Arrow Indicator MT5  will determine the current trend at its early stages, gathering information and data from up to 10 standard indicators, which are: Average Directional Movement Index (ADX) Commodity Channel Index (CCI) Classic Heiken Ashi candles Moving Average
Atbot
Zaha Feiz
4.67 (51)
ATbot : How It Works and How to Use It How It Works The "AtBot" indicator for the MT5 platform generates buy and sell signals using a combination of technical analysis tools. It integrates Simple Moving Average (SMA), Exponential Moving Average (EMA), and the Average True Range (ATR) index to identify trading opportunities. Additionally, it can utilize Heikin Ashi candles to enhance signal accuracy. MQL Channel    Leave a massage after purchase and receive a special bonus gift. Key Features: ⦁
FX Volume MT5
Daniel Stein
4.84 (19)
FX Volume: Experience Genuine Market Sentiment from a Broker’s Perspective Quick Overview Looking to elevate your trading approach? FX Volume provides real-time insights into how retail traders and brokers are positioned—long before delayed reports like the COT. Whether you’re aiming for consistent gains or simply want a deeper edge in the markets, FX Volume helps you spot major imbalances, confirm breakouts, and refine your risk management. Get started now and see how genuine volume data can
MetaForecast M5
Vahidreza Heidar Gholami
5 (3)
MetaForecast predicts and visualizes the future of any market using different powerful methods. While financial markets are not always predictable, if there are patterns in the past data, MetaForecast can learn and predict the future as accurately as possible. It features a complete implementation of neural networks embedded directly into the indicator, enabling traders to create and train AI models using data from multiple symbols to learn complex patterns. MetaForecast leverages your computer'
AriX
Temirlan Kdyrkhan
1 (2)
AriX Indicator for MT5 A powerful trend-following and signal-evaluation tool AriX is a custom MT5 indicator that combines Moving Averages and ATR-based risk/reward logic to generate clear buy/sell signals. It visualizes dynamic SL/TP levels, evaluates past trade outcomes, and displays win/loss statistics in a clean on-chart panel. Key features include: Buy/Sell signals based on MA crossovers ATR-based SL/TP1/TP2/TP3 levels with visual lines and labels Signal outcome tracking with real-time stat
Support And Resistance Screener Breakthrough unique Solution With All Important levels analyzer and Markets Structures Feature Built Inside One Tool ! Our indicator has been developed by traders for traders and with one Indicator you will find all Imporant market levels with one click. LIMITED TIME OFFER : Support and Resistance Screener Indicator is available for only 50 $ and lifetime. ( Original price 125$ ) (offer extended) The available tools ( Features ) in our Indicator are :  1. HH-LL S
First of all Its worth emphasizing here that this Trading System is Non-Repainting   , Non Redrawing and Non Lagging Indicator Which makes it ideal from both manual and robot trading .  Online course, manual and download presets. The Smart Trend Trading System MT5 is a comprehensive trading solution tailored for new and experienced traders . It combines over 10 premium indicators and features more than 7 robust trading strategies , making it a versatile choice for diverse market conditions . Tre
Quantum TrendPulse
Bogdan Ion Puscasu
5 (16)
Introducing Quantum TrendPulse , the ultimate trading tool that combines the power of SuperTrend , RSI , and Stochastic into one comprehensive indicator to maximize your trading potential. Designed for traders who seek precision and efficiency, this indicator helps you identify market trends, momentum shifts, and optimal entry and exit points with confidence. Key Features: SuperTrend Integration: Easily follow the prevailing market trend and ride the wave of profitability. RSI Precision: Detect
TPSpro RFI Levels MT5
Roman Podpora
4.53 (19)
Reversal zones - levels / Active zones of a major player INSTRUCTIONS RUS   /   INSTRUCTIONS   ENG   /   Version MT4 EVERY BUYER OF THIS INDICATOR       GET ADDITIONALLY   FOR FREE   : 3 months       access to trading signals from the service       RFI SIGNALS       — ready-made entry points according to the TPSproSYSTEM algorithm. 3 months       access to training materials with regular updates - immersion in strategy and professional growth. 24/5 support on weekdays and access to a closed tra
Gartley Hunter Multi
Siarhei Vashchylka
5 (12)
Gartley Hunter Multi - An indicator for searching for harmonic patterns simultaneously on dozens of trading instruments and on all possible timeframes. Manual (Be sure to read before purchasing) | Version for MT4 Advantages 1. Patterns: Gartley, Butterfly, Shark, Crab. Bat, Alternate Bat, Deep Crab, Cypher 2. Simultaneous search for patterns on dozens of trading instruments and on all possible timeframes 3. Search for patterns of all possible sizes. From the smallest to the largest 4. All fou
Berma Bands
Muhammad Elbermawi
5 (7)
The Berma Bands (BBs) indicator is a valuable tool for traders seeking to identify and capitalize on market trends. By analyzing the relationship between the price and the BBs, traders can discern whether a market is in a trending or ranging phase. Visit the [ Berma Home Blog ] to know more. Berma Bands are composed of three distinct lines: the Upper Berma Band, the Middle Berma Band, and the Lower Berma Band. These lines are plotted around the price, creating a visual representation of the pric
Introducing   Quantum Breakout PRO , the groundbreaking MQL5 Indicator that's transforming the way you trade Breakout Zones! Developed by a team of experienced traders with trading experience of over 13 years,   Quantum Breakout PRO   is designed to propel your trading journey to new heights with its innovative and dynamic breakout zone strategy. Quantum Breakout Indicator will give you signal arrows on breakout zones with 5 profit target zones and stop loss suggestion based on the breakout b
This dashboard shows the latest available   harmonic patterns   for the selected symbols, so you will save time and be more efficient /   MT4 version . Free Indicator:   Basic Harmonic Pattern Comparison of "Basic Harmonic Pattern" vs. "Basic Harmonic Patterns Dashboard" Indicators Feature Basic Harmonic Pattern Basic Harmonic Patterns Dashboard Functionality Detects and displays harmonic patterns on a single chart Searches multiple symbols and timeframes for harmonic patterns, displays res
First of all Its worth emphasizing here that this Trading Tool is Non Repainting , Non Redrawing and Non Lagging Indicator , Which makes it ideal for professional trading . Online course, user manual and demo. The Smart Price Action Concepts Indicator is a very powerful tool for both new and experienced traders . It packs more than 20 useful indicators into one , combining advanced trading ideas like Inner Circle Trader Analysis and Smart Money Concepts Trading Strategies . This indicator focus
MTF Supply Demand Zones MT5
Georgios Kalomoiropoulos
5 (1)
Next Generation Of Automated Supply And Demand Zones. New and Innovative Algorithm that Works At Any Chart. All Zones Are Being Created Dynamically According To Price Action Of The Market. AMAZING OFFER --> Activations from 5 to 20 for "MTF Supply Demand Zones" and "Automated Trendlines" TWO TYPES OF ALERTS -->  1) WHEN PRICE HITS A ZONE    2)WHEN A NEW ZONE IS FORMED  If you get the MTF Supply Demand Zones you can join the " Trade Like Me " Video Series. It contains 14 Live Sessions where 
The " Dynamic Scalper System MT5 " indicator is designed for the scalping method of trading within trend waves. Tested on major currency pairs and gold, compatibility with other trading instruments is possible. Provides signals for short-term opening of positions along the trend with additional price movement support. The principle of the indicator. Large arrows determine the trend direction. An algorithm for generating signals for scalping in the form of small arrows operates within trend wav
M1 Scalper Pro MT5
Elif Kaya
4.88 (8)
- Real price is 80$ - 45% Discount (It is 45$ now) Contact me for instruction, any questions! - Lifetime update free - Non-repaint - I just sell my products in Elif Kaya Profile, any other websites are stolen old versions, So no any new updates or support. Advantages of  M1 Scalper Pro  Profitability: M1 Scalper Pro is highly profitable with a strict exit strategy. Frequent Opportunities: M1 Scalper Pro  takes advantage of numerous small price changes. Minimal Market Risk: Limited exposure redu
ARICoins
Temirlan Kdyrkhan
ARICoin is a powerful trading companion designed to generate high-probability entry signals with dynamic TP/SL/DP levels based on volatility. Built-in performance tracking shows win/loss stats, PP1/PP2 hits, and success rates all updated live. Key Features: Buy/Sell signals with adaptive volatility bands Real-time TP/SL/DP levels based on ATR Built-in MA Filter with optional ATR/StdDev volatility Performance stats panel (Success, Profit/Loss, PP1/PP2) Alerts via popup, sound, push, or email Cust
Integrated Dashboard Scanner
Krzysztof Janusz Stankiewic
Integrated Dashboard Scanner – Your Market Command Center (v3.0) Short Description Stop wasting time manually switching between dozens of charts. The   Integrated Dashboard Scanner   is a powerful multi-symbol, multi-timeframe scanner that keeps an eye on every instrument you select from a single panel. Featuring   six distinct analysis modules , including an Economic News Calendar and a professional-grade Momentum Scanner, version 3.0 is the most powerful and reliable release yet. Following a
Gold Entry Sniper
Tahir Mehmood
5 (1)
Gold Entry Sniper – Professional Multi-Timeframe ATR Dashboard for Gold Scalping & Swing Trading Gold Entry Sniper is a cutting-edge MetaTrader 5 indicator designed to give traders precise buy/sell signals for XAUUSD and other symbols, powered by ATR Trailing Stop logic and a multi-timeframe analysis dashboard . Built for both scalpers and swing traders, it combines real-time market direction , dynamic stop levels , and professional visual dashboards to help you identify high-probability gold en
Was: $249  Now: $149   Market Profile defines a number of day types that can help the trader to determine market behaviour. A key feature is the Value Area, representing the range of price action where 70% of trading took place. Understanding the Value Area can give traders valuable insight into market direction and establish the higher odds trade. It is an excellent addition to any system you may be using. Inspired by Jim Dalton’s book “Mind Over Markets”, this indicator is designed to suit the
More from author
Daily Session Separators and HighsLows
Jacobus Nicolaas Van Staden
4.75 (4)
Overview The Daily Session Separator indicator is a powerful tool designed to enhance your trading experience by clearly marking daily trading sessions on your chart. It helps traders visualize daily boundaries, session highs and lows, and essential day-specific data to make informed decisions. With its seamless integration into any chart and dynamic adaptability, this indicator is a must-have for traders who rely on precision and clarity. Key Features Daily Session Separators Automatically adds
FREE
Positions Risk Analyzer
Jacobus Nicolaas Van Staden
Positions Risk Analyzer Utility The Trade Analyzer is a powerful tool designed for real-time monitoring of your trading performance directly on the chart. It provides insights into: Total Open Positions : Number of active trades. Potential Profit (TP) : Estimated profit if all Take Profits are hit. Potential Loss (SL) : Maximum potential loss if all Stop Losses are triggered. Floating Profit/Loss : Real-time net profit or loss of all open trades. This utility dynamically updates its calculation
FREE
Filter:
No reviews
Reply to review