Guarda i video tutorial del Market su YouTube
Come acquistare un Robot di Trading o un indicatore
Esegui il tuo EA
hosting virtuale
hosting virtuale
Prova un indicatore/robot di trading prima di acquistarlo
Vuoi guadagnare nel Market?
Come presentare un prodotto per venderlo con successo
Indicatori tecnici per MetaTrader 5 - 42

Catch major price movements, early in the trend. Alerts you to enter at the likely beginning of a trend, and if it's incorrect, quickly alerts you to exit to limit any loss. Designed to capture large, profitable price movements, with early entrance to maximize your returns. As shown in screenshots, typical behavior is several quick entrance/exists with small loss , and then capture of a large trend with high profits . The Instantaneous Trend indicator is a lag-reduced method to detect price t

Classical ADX revamped to provide faster and more solid trading signals. This indicator calculates ADX values using standard formulae, but excludes operation of taking the module of ADX values, which is forcedly added into ADX for some reason. In other words, the indicator preserves natural signs of ADX values, which makes it more consistent, easy to use, and gives signals earlier than standard ADX. Strictly speaking, any conversion to an absolute value destroys a part of information, and it mak
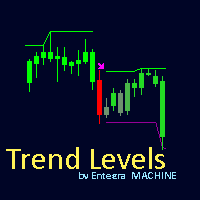
Trend Levels Indicator Elevate your trading strategy with the Trend Levels Indicator , a sophisticated tool designed to detect market trends and highlight critical price levels. This cutting-edge indicator is packed with features to simplify trend analysis and empower your decision-making process. Key Features: Dynamic Trend Levels : Accurately plots high, mid, and low levels based on market dynamics. Custom Alerts & Notifications : Get real-time alerts and notifications when trends change, ensu
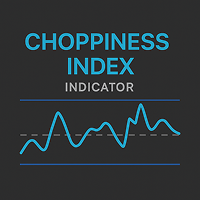
Choppiness Index — Trend or Range Market Indicator(MT5) Analyze market structure with the Choppiness Index. Adjustable settings and band visualization help distinguish between trend and consolidation phases. Overview The Choppiness Index is a volatility-based indicator for MetaTrader 5 that helps traders assess whether the market is currently trending or moving sideways . It does not predict direction but provides a measure of market consolidation or expansion, making it suitable for context-bas

• Please test the product in the Strategy Tester before purchasing to understand how it works.
• If you face any issues, contact me via private message—I’m always available to help.
• After purchase, send me a screenshot of your order to receive a FREE EA as a gift.
Dynamic Velocity Oscillator Pro: See the Market's True Momentum Unlock a new level of market insight with the Dynamic Velocity Oscillator Pro, an advanced momentum indicator designed for the discerning trader who demands more t

KT Auto Trendline draws the upper and lower trendlines automatically using the last two significant swing highs/lows. Trendline anchor points are found by plotting the ZigZag over X number of bars.
Features
No guesswork requires. It instantly draws the notable trendlines without any uncertainty. Each trendline is extended with its corresponding rays, which helps determine the area of breakout/reversal. It can draw two separate upper and lower trendlines simultaneously. It works on all timeframe

MACD 2 Scalper Indicator for Precision Trading The MACD 2 Scalper works seamlessly on a variety of assets, including Boom Crash 1000, Crash 500, VIX75, GBP/USD, and many more. What is the MACD 2 Scalper? The MACD 2 Scalper is based on the traditional Moving Average Convergence Divergence (MACD) indicator, with a key difference: it features two lines that form a cloud, offering more nuanced insights. The divergence between the MACD and the signal line is displayed as a color-coded histogram. Vers
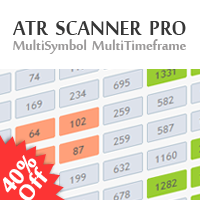
40% off. Original price: $50
ATR Scanner Pro is a multi symbol multi timeframe volatility scanner that monitors and analyzes Average True Range indicator value in up to 28 symbols and 9 timeframes in 3 modes : ATR value: As a volatility dashboard it shows the ATR indicator value in all pairs and timeframes and signals when the ATR value reaches a maximum or minimum in a given duration. Short term ATR/Long term ATR ratio: It shows ratio of 2 ATRs with different periods. It's useful in detect

Leave a review for this product, and receive another "Free" product that you choose. You can see my other products here: https://www.mql5.com/en/users/zakri/seller
Trend Detective is an advanced trend detection indicator which shows accurate entry points in direction of trend. It uses smart technology in order to detect entry points, trend changing points, and TP points. It also shows hit rate for current chart using selected parameters. Hit rate for this indicator on different charts can be 8

Sniper Delta Imbalance is a professional tool for deep delta analysis — the difference between buyer and seller volumes. It takes volume analysis to the next level, allowing traders to see in real time who controls the price — buyers or sellers — and to find precise entry points based on the actions of major market participants. This tool represents a unique style of analysis based on the ratio of demand and supply volumes and can be used to detect who holds control over price. At the core of

Category: Trend Indicator
Platform: MetaTrader 5
Type: Level Indicator
Timeframes: All
Trader Styles: Scalping, Day Trading, Swing Trading
Markets: All Description The Madrid Ribbon is a moving average–based trend visualization tool. It combines multiple exponential or simple moving averages into a ribbon structure that adapts to market changes. The indicator highlights trend direction, possible reentry zones, and areas where reversals may occur. Main features: Dynamic Trend Display – Multiple m

The indicator draws a normal chart by coloring it in colors based on prices calculated by the Heiken Ashi indicator algorithm.
That is, the shape of the candles does not change.
In fact, this is the same Heiken Ashi that does not distort the price chart.
Then there will be a drawing of a cat, because there is nothing more to write about the indicator. .
FREE
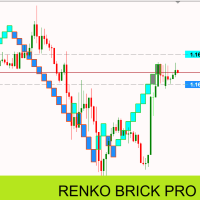
Renko Brick Pro - Advanced Renko Indicator for MT5 Professional Renko bricks with intelligent ATR sizing and ready-to-use EA integration buffers. Renko charts eliminate market noise by creating bricks only when price moves a specific amount. Unlike traditional price charts, each brick represents the same price movement, giving you cleaner trend identification and better entry points. This indicator brings true Renko analysis to MT5 with intelligent ATR-based brick calculations that automatically

Hello, This indicator is a unique high reliability 7-in-1 multicurrency indicator comprising these sub-indicator’s: A Trend Power Crossover Indicator. A Percent Change Crossover Indicator. A Currency Overbought/Oversold Indicator. A Currency Deviation Indicator. A Currency Impulse Signal Indicator. A Trend Power Indicator. A Currency Volatility Indicator. The main advantage of this indicator is that it's reasoning by currency and not by currency pair. The values of each sub-indicator are calcula
FREE

Trend Dot Indicator MT5
– Clean & Powerful Reversal System A fast-reacting Trend Step Regression (TSR) line with color-coded dots instantly shows the current trend. High-probability BUY/SELL signals appear only when a real reversal occurs, confirmed by minimum trend length and ADX strength. Description here: https://www.mql5.com/en/blogs/post/765867 Features: Clear visual TSR line + dots (blue = up, red = down) Filtered reversal signals with text labels Real-time volume pressure dashboard (B

It is an analogue of the indicator of levels at https://www.mql5.com/en/market/product/24273 for the MetaTrader 5 platform. The indicator shows the levels of the past month, week and day. In addition, it draws a level in percentage relative to the difference between the High and Low of the past month and week. For the daily levels of the past day, the Close levels are additionally displayed. All you need to do is to configure the display parameters of the levels to your liking. In some cases, af

MT5 trend indicator with a probability of reaching a profit of 70-90%! Works without redrawing and delays. Trend Master PRO shows good results on all trading instruments: currencies, metals, indices, stocks, cryptocurrencies. Recommended timeframe: H1-H4.
More information about the indicator is here : https://www.mql5.com/en/blogs/post/744748
Recommendations for use
Use automatic period detection The main feature of the indicator is the self-optimization function. Thank

You can avoid constant monitoring of computer screen waiting for the DeMarker signal while receiving push notifications to a mobile terminal or a sound alert on the screen about all required events, by using this indicator - DeMarker Alerts. In fact, it is the replacement of the standard indicator with which you will never miss the oscillator signals. If you don't know the benefits of DeMarker or how to use it, please read here . If you need signals of a more popular RSI indicator, use RSI Alert

Trade in the Footsteps of the Institutions The SMC Institutional Order Flow indicator brings the power of professional trading strategies directly to your MetaTrader 5 terminal. Based on the core principles of Smart Money Concepts (SMC) , this advanced tool automatically maps the key levels and structures used by banks and large institutions to move the market. Stop guessing and start seeing the market through the lens of order flow. This all-in-one suite identifies where institutions have

This is a general purpose indicator that displays colored lines at fixed and customizable price intervals, entered as parameters. It offers universal, constant, and familiar price ranges that allow quick and precise price analysis of a currency pair. With default parameters, this indicator implements The Quarters Theory , as described originally by Ilian Yotov . [ Installation Guide | Update Guide | Troubleshooting | FAQ | All Products ] Easy to use No optimization needed Customizable price inte
FREE
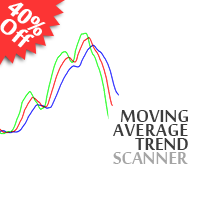
40% off. Original price: $50 Moving Average Trend Scanner is a multi symbol multi timeframe triple MA crossover dashboard that helps traders to monitor, and identify potential market trends from one chart. This panel scans 3 moving averages in up to 28 configurable instruments and 9 timeframes for triple moving average alignment and moving average crossover with a deep scan feature to scan all market watch symbols (up to 1000 instruments!).
Download Demo here (Scans only M1 and M6) Setti
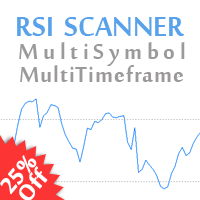
25% off. Original price: $40 RSI Scanner is a multi symbol multi timeframe RSI dashboard that monitors Relative Strength Index indicator for price entering and exiting overbought and oversold in up to 28 symbols and 9 timeframes.
Download Demo here (Scans only M1, M5 and M10) Settings description here MT4 version here
RSI Scanner features: Signals RSI entering and exiting the overbought and oversold zones. Monitors 28 customizable instruments and 9 timeframes at the same time. Supports a

This indicator scans for you up to 15 trading instruments and up to 21 time frames for occurrences of the high probability reversal patterns: Double Tops/Bottoms with fake breakouts . What this indicator detects: This indicator detects a special form of Double Tops and Bottoms, so called Double Tops/Bottoms with fake breakouts . For double tops with fake breakouts the highest price of the right shoulder must be higher than the left shoulder. For double bottoms with fake breakouts the lowest pric
FREE

MultiTF Trend Indicator for MetaTrader 5 MultiTF Trend is a technical indicator for MetaTrader 5 designed to display trend directions across multiple timeframes on a single chart. It uses Moving Average (MA) slope analysis combined with an ATR-based threshold to help identify periods of directional movement in the market. This tool presents trend information in a structured and easy-to-read format, allowing users to observe trend alignment across various timeframes without switching charts. Mai

Tick Speed Free povides a on-chart label of tick speed to allow you to see the ebb and flow of market activity. Observing rises and falls in tick speed may allow you to better time entries to reduce slippage and re-quotes.
Options include: - colores for low-mid-high tick speeds - placement and styling - prefix & suffix to customise the speed label
Troubleshooting: - Note, in the tester environment, tick timings are limited to what is supplied by the tester environment and it's speed
- If there
FREE

This indicator works by plotting fractals on the chart as arrows that can be used as buy or sell signals. It is a great tool for both new and experienced traders as it provides a clear visual representation of the market and helps traders identify fractals. Although it repaints, it can be used quite effectively in conjunction with other tools to filter trading strategies.
We use this indicator in this way in our Royal Fractals EA, which you can purchase on the MQL5 Market: https://www.mql5.com
FREE

For those Price Action traders who love to trade strong Price points, like today's Opening Price (or even yesterday's Price), here is an indicator to ease the identification of those values, drawn directly on your chart! Opening Price will automatically draw a line showing you this point for you, AND, if you like any OPENing price in the past, not just today's price. A must-have in your Price Action toolbox!
SETTINGS
How many past days do you want to be drawn? Do you want to draw the current da
FREE

This is the MT5 version. Get Dual Onset MT4 here
It is an algorithm to detect trend changes early. You should try multiple values for the Multiplier parameter (1 <value <10 recommended). At first glance you can see effective entries. This is, in fact, one of the rows that Geleg Faktor initially had. But it was removed because it was no longer needed. The other rows were sufficient for G.Faktor's effectiveness, but I still wanted to share this one.
Always test before using it on your live ac
FREE

ToolBot Probabilistic Analysis - FREE An effective indicator for your negotiations
The toolbot indicator brings the calculation of candles and a probabilistic analysis so that you have more security on your own.
Also test our FREE tops and bottoms indicator: : https://www.mql5.com/pt/market/product/52385#description Also test our FREE (RSI, ATR, ADX, OBV) indicator: https://www.mql5.com/pt/market/product/53448#description
Try our EA ToolBot for free: https://www.mql5.com/market/prod
FREE
Gold Signal Quality Selector Stop Guessing. Start Trading Gold with Institutional-Grade Clarity. Are you tired of the chaotic nature of the Gold (XAUUSD) market? Frustrated with generic indicators that generate endless false signals and drain your capital? The truth is, Gold doesn't move like other assets. It demands a specialized tool built for its unique volatility and personality. It's time to stop using one-size-fits-all tools and start trading with an intelligent edge. Introducing Gold Sign

Machine Learning Adaptive SuperTrend - Take Your Trading to the Next Level!
Introducing the Machine Learning Adaptive SuperTrend , an advanced trading indicator designed to adapt to market volatility dynamically using machine learning techniques. This indicator employs k-means clustering to categorize market volatility into high, medium, and low levels, enhancing the traditional SuperTrend strategy. Perfect for traders who want an edge in identifying trend shifts and market conditio
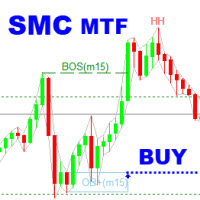
SMC Analyzer Multi-Timeframe is a powerful tool designed to help traders apply Smart Money Concepts (SMC) across multiple timeframes. This indicator identifies key structural points such as market structure shifts (Break of Structure and Change of Character), order blocks, fair value gaps (FVG), and liquidity zones from higher timeframes and overlays them onto the current chart. By aligning these critical SMC signals across multiple timeframes, traders gain a more comprehensive view of instituti

Colors generated according to trading volume and market direction.
The analysis is carried out following the direction of the price and volume traded if the traded value exceeds the calculation base the system changes the color to green, informing you that the price direction is strong to buy, if the traded value is less than the calculation base the system changes to red, indicating that the price is strong for sale.
FREE

Transform your financial chart analysis with our innovative Candle Coloring Indicator. This powerful tool allows you to instantly visualize market trends based on closing prices relative to a customized average. Customized Coloring: Choose colors that best suit your analysis style. Highlight candles above the average in a vibrant color of your choice and candles below the average in another distinctive color. Adjustable Average: Tailor the indicator to your trading strategies by setting the aver
FREE

The underlying strategy of this indicator is based on identifying momentum in the market and attempting to capture the direction of the trend through transitions between bullish and bearish moments. Utilizing bands around the RWMA allows for identifying potential overbought and oversold situations in the market.
1. Calculation of the Range Momentum Index (RMI): The RMI is based on a combination of the Relative Strength Index (RSI) and the Money Flow Index (MFI), both of which are momentum indi

Weis Wave Volume Indicator for MetaTrader 5 (MT5) Check all of our products here: All Products Specifications Platform: MetaTrader 5 (MT5)
Type: Custom Technical Trading Indicator
Level: Intermediate
Timeframes: All Timeframes (Multi-Timeframe Support)
Trading Styles: Scalping, Day Trading, Swing Trading, Position Trading
Markets: Forex, Stocks, Commodities, Indices, and Cryptocurrencies What Does This Indicator Do? The Weis Wave Volume Indicator for MT5 is a powerful Price Action + V

"Wouldn't we all love to reliably know when a stock is starting to trend, and when it is in flat territory? An indicator that would somehow tell you to ignore the head fakes and shakeouts, and focus only on the move that counts?" The Choppiness Index is a non-directional indicator designed to determine if the market is choppy (trading sideways) or not choppy (trading within a trend in either direction). It is an oscillating indicator between -50 (very trendy) and +50 (very choppy). There are man

The UTS Trading Stat indicator, developed by Ultron Trading Solutions, is a customizable tool designed to track and display trading statistics for the current chart's symbol. It presents a visual dashboard on the chart, offering real-time insights into trading performance with a toggleable panel (STAT SHOW/STAT HIDE) for user convenience. Below is a detailed description of its features and functionality: Trading Statistics Displayed : Current Positions : Number of open profit/loss trades and tot

BreakEven Finder è un indicatore gratuito e leggero per MetaTrader 5, progettato per scalper e trader intraday. Analizza le posizioni aperte e mostra chiaramente il punto di pareggio sul grafico. Caratteristiche principali: Mostra il livello di pareggio per ogni posizione Calcolo automatico della media su più operazioni Interfaccia semplice e intuitiva Funziona su qualsiasi strumento e timeframe Grafica pulita e minimale Ideale per: Scalper Trader intraday Trader con PnL fluttuante Vanta
FREE

# SamuraiFX Combined Pro V14 **Master Market Turns with Real-Time Volume & Structure**
Stop guessing where the market will turn. The **SamuraiFX Combined Pro** is a comprehensive trading system that combines **Daily Structure**, **Volume Flow**, and **Price Action** into a single, non-repainting dashboard. It helps you identify high-probability Reversals and powerful Breakouts without the lag of traditional indicators.
### **Key Advantages**
* **No Lag, No Repaint:** Signals are generated in

Heikin Ashi candlesticks are a powerful tool for traders, offering a clear and smooth visualization of market trends. Unlike traditional candlesticks, they filter out market noise, providing a cleaner view of the market's direction and strength, which helps traders make more informed decisions. The Hull Heikin Ashi Smoothed indicator from Minions Labs takes this a step further by integrating the Hull Moving Average for enhanced smoothing and precision. This indicator not only simplifies trend id

Trendlines with Breaks Overview The Trendlines with Breaks indicator automatically detects and plots pivot-based trendlines, dynamically adjusting their slope and steepness to highlight significant breakout events. Designed for traders who rely on price action and market structure , this tool provides an automated, real-time way to track evolving momentum and breakout confirmations . How It Works The indicator identifies swing highs and swing lows , connecting them to form adaptive trendlines ba

This indicator combines RSI(14) and ADX(14) to find out the signal that price moves strongly. When it appears signal (represent by the yellow dot), and price is going down, let consider to open a SELL order. Otherwise, let consider to open a BUY order. In this case, the strength of moving is strong (normally after sideway period), so we can set TP by 3 times of SL .
FREE

Structure Levels (Highs & Lows) Indicator for MetaTrader 5
Decode Market DNA — Trade with Institutional Precision Description:
The Structure Levels (Highs & Lows) Indicator is your secret weapon to map the market’s hidden roadmap. Designed for traders who think in terms of price action and market structure, this tool automatically identifies critical swing highs and swing lows, transforming chaotic charts into a clear blueprint of support/resistance zones, breakout opportunities, and trend rev

Apex Swing VWAP MT5 Apex Swing VWAP is an advanced indicator for MetaTrader 5 that combines VWAP (Volume Weighted Average Price) analysis with automatic detection of significant swing points. This combination provides accurate market sentiment insight and potential reversal points. Key Features Integrated Technical Analysis - Dynamic VWAP from relevant swing points - Historical VWAP for long-term trend analysis - Multiple configurable VWAP periods
Recommended Trading Types - Swing Trading for

Risk5Percent is a custom indicator for MetaTrader 5 designed to help you manage your risk exposure precisely. By entering the desired risk percentage and the number of lots used, it calculates and displays the corresponding price level on the chart that represents your maximum anticipated loss (e.g., 5%), automatically considering contract and tick size for the selected instrument. Key Features:
Custom settings for trade direction (long/short), risk percentage, and lot size.
Automatic adjus
FREE

The VIX Index, or CBOE Volatility Index, is an indicator designed for MetaTrader 5 that transforms historical volatility into an easy-to-interpret oscillator, placing the volatility range between 0 (minimum) and 100 (maximum) based on a configurable normalization period.
Unlike a simple ATR, this oscillator shows you on the chart when volatility is abnormally low or high compared to its recent behavior. Additionally, the indicator provides context and information about the famous VIX Volatility
FREE
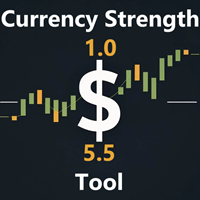
" Currency Strength Tool " is a straightforward and user-friendly indicator designed for analyzing the strength of eight major currencies based on daily price changes of currency pairs. It displays information compactly on the chart in three rows, providing traders with insights into current market dynamics. The indicator serves as an analytical tool, aiding in making informed trading decisions.
It appears as follows: -7.3% 0.5% 0.2% 6.4% 1.2% 3.2% 4.1% 0.4% (daily change) USD E
FREE

This indicator identifies short-term, medium-term and long-term highs and lows of the market according to the method described by Larry Williams in the book "Long-term secrets to short-term trading".
Brief description of the principle of identifying the market highs and lows A short-term high is a high of a bar with lower highs on either side of it, and, conversely, a short-term low of a bar is a low with higher lows on either side of it. Medium-term highs and lows are determined similarly: a
FREE

ATR Candles (Average True Range as OHLC candles) ATR Candles visualizes Average True Range (ATR) in a separate subwindow using candlestick-style OHLC bars . Each candle represents the change in ATR from the previous bar, making it easy to see volatility expansion and contraction over time. Key features: ATR shown as OHLC candles (open = previous ATR, close = current ATR) Input: ATR period Two color modes : Match price candle direction (bull/bear) Independent: green/red based on current ATR close
FREE

The Luta Volatility Meter is an essential technical indicator for traders in MetaTrader 5 (MT5). It was developed by Eng. Lutandula to clearly measure and visualize market movement, helping you easily identify high and low volatility periods. By calculating the average daily trading range, this tool offers a simple yet powerful way to gauge market activity and potential movement for better trade timing Key Advantages Optimal Trade Timing: Helps you identify whether the market is slow (low vol
FREE

Calendar Dashboard – a compact, real‑time economic calendar that sits directly on your MT5 charts and never gets in the way . Why traders love Calendar Dashboard See upcoming and past news at a glance, with clear time, currency, and impact so you know exactly when markets may move . Instantly spot high‑impact events thanks to color‑coding and a simple legend; past events are marked with a small asterisk for quick reference . Stay aligned across brokers with Broker Time and GMT Time displayed si
FREE

Many traders use Price Action as entry and exit signal. Since the beginning of chart analysis, traders have found several candlestick patterns that can indicate possible "behaviors" of the market. Candlestick Pattern indicator is an indicator for MetaTrader platform that can detect many of these patterns and show them on screen or to alert traders about them. though they detect slightly different sets of candle patterns. Candlestick Pattern indicator also has a more modern look compared
FREE

Highly configurable Fisher Transform indicator.
Features: Highly customizable alert functions (at levels, crosses, direction changes via email, push, sound, popup) Multi timeframe ability Color customization (at levels, crosses, direction changes) Linear interpolation and histogram mode options Works on strategy tester in multi timeframe mode (at weekend without ticks also) Adjustable Levels Parameters:
Fisher Transform Timeframe: You can set the lower/higher timeframes for Fisher Transform .
FREE
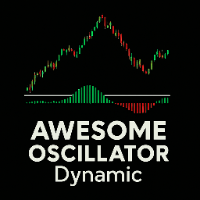
Awesome Oscillator Dynamic Indicatore tecnico che mostra, tramite un istogramma, la differenza tra due medie mobili semplici (SMA 5 e SMA 34) applicate al prezzo mediano. Il colore delle barre cambia automaticamente: verde per momentum rialzista, rosso per momentum ribassista. Lettura rapida: Verde sopra lo zero → momentum rialzista Rosso sotto lo zero → momentum ribassista Incrocio dello zero → possibile inversione di tendenza Compatibile con qualsiasi asset e timeframe, senza necessità di con
FREE

Momentum Maxwell V1 PRO: The Sniper Hybrid Energy Momentum Maxwell V1 PRO no es un oscilador convencional; es una herramienta de precisión balística diseñada para el trader que opera como un francotirador . Mientras que los indicadores estándar se pierden en el ruido del mercado, el Maxwell V1 PRO utiliza un motor de triple filtrado de energía para detectar el agotamiento del precio con una nitidez quirúrgica. A diferencia del RSI o el Estocástico, que confinan sus datos en una escala artificial
FREE

Tape Reading, flow monitoring.
FabFlowInPrice is a powerful indicator for those who like Tape Reading (Times & Trades). It presents the volumes traded at each price level, considering the purchase, sale and direct aggressions for each level. Excellent tool for market flow analysis. Thought of flow so monitor who is attacking the most, buyers, sellers or direct exchanges, thought FabFlowInPrice. The indicator displays information in 4 distinct and fixed periods, on any timeframe: @Day - All t
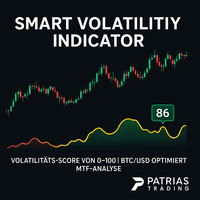
Smart Volatility Indicator – Precise Volatility Detection for MetaTrader 5 The Smart Volatility Indicator is an innovative tool for accurately measuring market volatility – specifically developed for MetaTrader 5. It combines candle range, wick ratios, and smart filtering logic into a clear, scalable volatility score from 0 to 100 . Perfect for traders who want to respond to breakouts, trend dynamics, or consolidating markets – manually or via Expert Advisors (EAs). Key Features Smart Volatility
FREE

Indicatore di segnali per opzioni binarie, che può essere applicato in modo efficace anche sul Forex e su altri mercati. È adatto al trading a griglia di breve periodo su M1–M5 e include segnali per l’aumento graduale delle posizioni. L’indicatore utilizza un’adattività a due livelli: un profilo di velocità di base (impostazione “veloce/morbido” fin dall’inizio) e un’auto-adattamento basato sui risultati delle operazioni, che regola i filtri in base al mercato corrente tenendo conto delle serie

If you have difficulty determining the trend as well as entry points, stop loss points, and take profit points, "Ladder Heaven" will help you with that. The "Ladder Heaven" algorithm is operated on price depending on the parameters you input and will provide you with signals, trends, entry points, stop loss points, take profit points, support and resistance in the trend That direction.
Helps you easily identify trends, stop losses and take profits in your strategy! MT4 Version: Click here Fea
FREE

The indicator makes calculations based on data obtained from one of seven (7) moving averages and colors the chart.
Simple moving averages are those that have only one important calculation parameter - the period.
The shift in the indicator is not used.
There is a shift trick setting, it is used to smooth the result of calculations. You can see the changes if you reduce this parameter to 1 (minimum value).
shift trick must always be less than the period value.
Available averages:
MA Simpl
FREE
SMC Trend Momentum SMC Trend Momentum is a momentum oscillator displayed in a separate window. It combines Donchian position bias with ZigZag leg normalization into one adaptively smoothed signal. A color‑coded histogram with prewarn and warn states supports visual assessment of direction and momentum changes. Optional higher‑timeframe alignment (H1/H4) can be used as a filter. Features Combined bias oscillator (Donchian + ZigZag) Donchian position bias (distance from channel equilibrium) ZigZ

Highly configurable Demarker indicator.
Features: Highly customizable alert functions (at levels, crosses, direction changes via email, push, sound, popup) Multi timeframe ability Color customization (at levels, crosses, direction changes) Linear interpolation and histogram mode options Works on strategy tester in multi timeframe mode (at weekend without ticks also) Adjustable Levels Parameters:
Demarker Timeframe: You can set the lower/higher timeframes for Demarker. Demarker Bar Shift: Y ou
FREE
This is a custom MACD (Moving Average Convergence Divergence) indicator designed for MetaTrader 5 (MT5) . It replicates the TradingView MACD version , ensuring consistency for traders familiar with that platform. The default MACD in MT5 has differences in its calculation and visualization compared to TradingView. This indicator provides an identical structure, allowing for accurate technical analysis across different platforms. Features TradingView-Style MACD – Matches the histogram, signal lin
FREE

Analisi della Volatilità Quantistica e Rilevamento dei Regimi di Mercato Schrödinger Market Wells (SMW) offre un approccio alternativo all'analisi tecnica tradizionale. A differenza delle bande di volatilità standard basate esclusivamente su semplici deviazioni statistiche, l'SMW modella l'azione dei prezzi utilizzando i principi della Meccanica Quantistica Finanziaria . Questo indicatore interpreta il prezzo come una particella che interagisce all'interno di una "Buca di Potenziale" (Potential

This indicator is a basic RSI but comes up with a useful feature.
You can set zones within the RSI and these zones can be displayed with different background colours. (You can see on the pictures below) You need to set the zone ranges and their colours at the input parameters. Six different zones can be set.
Should you have any questions or comments, feel free to contact me.
FREE

Basing Candles indicator is an automatic indicator that detects and marks basing candles on the chart. A basing candle is a candle with body length less than 50% of its high-low range. A basing candle or basing candlestick is a trading indicator whose body length is less than half of its range between the highs and lows. That's less than 50% of its range.
The indicator highlights the basing candles using custom candles directly in the main chart of the platform. The percentage criterion can be
FREE

Wikirobo | Smart Entry Zone Indicator for All Timeframes Wikirobo is a powerful indicator that automatically highlights potential entry zones as Buy Limit and Sell Limit orders across all timeframes. Highlights Suggested entry zones for every timeframe ️ Clear, timeframe-specific Stop Loss levels shown on the chart for better risk management and position sizing Suitable for scalpers, day traders, and swing traders —flexible for any trading style How to Use Instea
FREE

This indicator will show you the average entry price for positions, pending orders and both, every side and every type has an different color; It will also show you actual risk, pending risk, both sum and for both sides and the sum of both; you can configure Day, Week, Month and Year Financial Risk to show you if you are close to it; it shows the risk return of each side and both sides too, based on risk and profit for actual position and pending orders
FREE

InsideBarStop Indicator for MT5
This indicator can be used to show and evaluate the trailing stop algorithm "Trailing Stop with Inside Bars" that was proposed by the famous German trader and author Michael Voigt ("Das grosse Buch der Markttechnik") to capture robust gains when trading strong price moves. The trailing stop price is shown as a red line. You can start the trailing stop anywhere on your chart (bars or candles) by setting the "initialBarDateTime" input parameter to the open time of
FREE
Il MetaTrader Market è l'unico negozio online dove è possibile scaricare la versione demo gratuita di un robot di trading che consente di effettuare test e ottimizzazioni utilizzando dati statistici.
Leggi la descrizione dell'applicazione e le recensioni di altri clienti, scaricala direttamente sul tuo terminale e prova un robot di trading prima di acquistarlo. Solo sul MetaTrader Market è possibile testare un'applicazione in modo assolutamente gratuito.
Ti stai perdendo delle opportunità di trading:
- App di trading gratuite
- Oltre 8.000 segnali per il copy trading
- Notizie economiche per esplorare i mercati finanziari
Registrazione
Accedi
Se non hai un account, registrati
Consenti l'uso dei cookie per accedere al sito MQL5.com.
Abilita le impostazioni necessarie nel browser, altrimenti non sarà possibile accedere.