Conheça o Mercado MQL5 no YouTube, assista aos vídeos tutoriais
Como comprar um robô de negociação ou indicador?
Execute seu EA na
hospedagem virtual
hospedagem virtual
Teste indicadores/robôs de negociação antes de comprá-los
Quer ganhar dinheiro no Mercado?
Como apresentar um produto para o consumidor final?
Indicadores Técnicos para MetaTrader 5 - 42
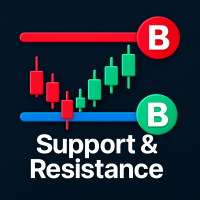
Support and Resistance Levels Indicator for MT5 The Support and Resistance Levels Indicator for MetaTrader 5 is one of the most advanced and reliable tools for identifying key price zones in the market. Unlike traditional indicators, it not only detects support and resistance levels but also combines them with volume analysis to generate accurate and high-probability trading signals. Type: Indicator Level: Intermediate Concepts: SMC (Smart Money Concepts), Price Action, Volume Analysis Timefram
The KT Risk Management Indicator provides a comprehensive overview of the profit/loss and risk management characteristics of your Metatrader account, offering valuable insights and information. It efficiently categorizes the displayed information at account and symbol levels, ensuring a clear and organized presentation of crucial data. Risk is inherent when trading the Forex market - a reality that seasoned traders acknowledge and beginners quickly realize. To succeed in this volatile market, t

Atenção: Nova atualização - 4 grandes melhorias de praticidade!
1) Alarme 2) Valor em texto na Midas 3) Painel de cliques 4) Pode ser ligado em um EA para operar no modo semiautomático
Atenção - Este indicador não funciona perfeitamente em backteste por particularidades do MT5 (Leitura de teclas de atalho ou cliques no painel). Minhas sugestão é que você teste o Automatic Vwap Midas que tem o funcionamento automático para analisar o cálculo e depois comprar o Start se achar que o indicador vai
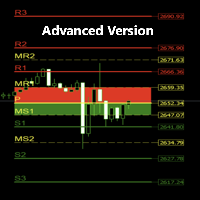
Detailed Description: The Pivot Points Buy Zone Advanced Indicator takes the concept of pivot points to a whole new level, providing traders with enhanced functionality, customizations, and in-depth visualizations. Unlike the free basic version, this advanced indicator allows users to customize more settings, analyze current and historical pivot points, enable potential buy (green) and sell (red) set-ups on the chart, use alerts and pop-up messages, ... etc. Extra Key Advanced Features: Fully C

Overview The Breakout and Retest indicator is designed to identify potential trading opportunities by detecting price breakouts from significant support and resistance levels followed by a retest of the broken level. How it Works The indicator analyzes price data to determine key support and resistance areas. When the price decisively breaks through one of these levels and then retest it, then a potential breakout is signaled when it breakout again. To increase the probability of a successful t

Volume Delta Candles: A Comprehensive Tool for In-Depth Trading Analysis Unlock a seamless way to interpret trading experience within each candle. With Volume Delta Candles, there's no need for additional volume indicators—everything you need is built in. This advanced tool utilizes lower timeframes or live market data to present the percentage of buying versus selling volume within each candle as an intuitive color-coded bar. Before diving in, ensure you’re familiar with Volume and Volume Delta

IceFX VelocityMeter Mini is a very unique indicator on MetaTrader 4 platform which measures the speed of the Forex market . It is not a normal volume or other measurement indicator because IceFX VelocityMeter Mini is capable to understand market speed movements which are hidden in ticks and those valuable information cannot be read in an ordinary way from the candles. The software monitors the received ticks (frequency, magnitude of change) within a specified time range, analyzes these info and

Catch major price movements, early in the trend. Alerts you to enter at the likely beginning of a trend, and if it's incorrect, quickly alerts you to exit to limit any loss. Designed to capture large, profitable price movements, with early entrance to maximize your returns. As shown in screenshots, typical behavior is several quick entrance/exists with small loss , and then capture of a large trend with high profits . The Instantaneous Trend indicator is a lag-reduced method to detect price t

Indicador Multiple Regression Indicador faz o plot da Curva de Retorno e dos canais superior e inferior de uma regressão para os preços de fechamento do ativo do gráfico. A Curva de Retorno é a linha central do indicador e representa a região de equilíbrio do preço entre vendedores e compradores. Nesse indicador o usuário escolhe o tipo da regressão podendo ser de 3 tipos: primeiro grau, segundo grau ou terceiro grau. Os plots do indicador são: Linha central – cor padrão preta; Linha superi
FREE
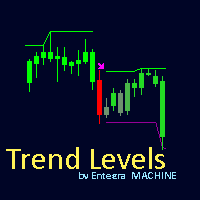
Trend Levels Indicator Elevate your trading strategy with the Trend Levels Indicator , a sophisticated tool designed to detect market trends and highlight critical price levels. This cutting-edge indicator is packed with features to simplify trend analysis and empower your decision-making process. Key Features: Dynamic Trend Levels : Accurately plots high, mid, and low levels based on market dynamics. Custom Alerts & Notifications : Get real-time alerts and notifications when trends change, ensu
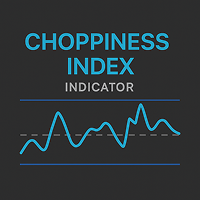
Choppiness Index — Trend or Range Market Indicator(MT5) Analyze market structure with the Choppiness Index. Adjustable settings and band visualization help distinguish between trend and consolidation phases. Overview The Choppiness Index is a volatility-based indicator for MetaTrader 5 that helps traders assess whether the market is currently trending or moving sideways . It does not predict direction but provides a measure of market consolidation or expansion, making it suitable for context-bas

• Please test the product in the Strategy Tester before purchasing to understand how it works.
• If you face any issues, contact me via private message—I’m always available to help.
• After purchase, send me a screenshot of your order to receive a FREE EA as a gift.
Dynamic Velocity Oscillator Pro: See the Market's True Momentum Unlock a new level of market insight with the Dynamic Velocity Oscillator Pro, an advanced momentum indicator designed for the discerning trader who demands more t

KT Forex Super Scalper is created to identify market trends and plot trade signals based on the direction of the predetermined trend. It functions very similarly to moving averages but reacts quickly to changes in price actions and can signal right away once a valid trend is confirmed. The quick reactionary feature makes it a valuable tool for scalpers. However, anyone familiar with moving averages can use it for actual trading because of its signaling process and chart demonstration simplicity

MACD 2 Scalper Indicator for Precision Trading The MACD 2 Scalper works seamlessly on a variety of assets, including Boom Crash 1000, Crash 500, VIX75, GBP/USD, and many more. What is the MACD 2 Scalper? The MACD 2 Scalper is based on the traditional Moving Average Convergence Divergence (MACD) indicator, with a key difference: it features two lines that form a cloud, offering more nuanced insights. The divergence between the MACD and the signal line is displayed as a color-coded histogram. Vers
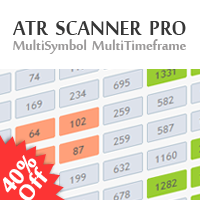
40% off. Original price: $50
ATR Scanner Pro is a multi symbol multi timeframe volatility scanner that monitors and analyzes Average True Range indicator value in up to 28 symbols and 9 timeframes in 3 modes : ATR value: As a volatility dashboard it shows the ATR indicator value in all pairs and timeframes and signals when the ATR value reaches a maximum or minimum in a given duration. Short term ATR/Long term ATR ratio: It shows ratio of 2 ATRs with different periods. It's useful in detect

Leave a review for this product, and receive another "Free" product that you choose. You can see my other products here: https://www.mql5.com/en/users/zakri/seller
Trend Detective is an advanced trend detection indicator which shows accurate entry points in direction of trend. It uses smart technology in order to detect entry points, trend changing points, and TP points. It also shows hit rate for current chart using selected parameters. Hit rate for this indicator on different charts can be 8
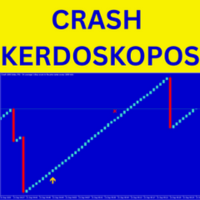
Crash Kerdoskopos Indicator – Buy Without Fear The Crash Kerdoskopos Indicator is the ultimate tool for scalping Crash markets on the M1 timeframe . Designed with precision entry and exit rules, it allows you to buy with confidence and capture 8–10 safe candles without being caught by spikes. With yellow up arrows for entry and a red cross for exit , the indicator removes all guesswork. You’ll also receive audible alerts, push notifications, and email signals so you never miss a profitable op

Sniper Delta Imbalance is a professional tool for deep delta analysis — the difference between buyer and seller volumes. It takes volume analysis to the next level, allowing traders to see in real time who controls the price — buyers or sellers — and to find precise entry points based on the actions of major market participants. This tool represents a unique style of analysis based on the ratio of demand and supply volumes and can be used to detect who holds control over price. At the core of

NeuraVault Pro v1.0 - Professional RSI Reversal Trading System Overview NeuraVault Pro is a professional automated trading system based on RSI (Relative Strength Index) reversals. It is designed to capture reversal opportunities in overbought and oversold zones, equipped with advanced filters and comprehensive risk management features. Trading Logic Core Strategy: RSI Reversal The EA captures reversal opportunities when the market reaches overbought or oversold zones: BUY Signal: RSI value drops
FREE

Fibonacci Trend Indicator for MT5 Unlock the power of Fibonacci analysis on your MetaTrader 5 charts!
Our Fibonacci Trend Indicator automatically plots dynamic support and resistance levels so you can spot trends, reversals, and breakout opportunities at a glance. Features & Advantages Automatic Fibonacci Levels
Instantly displays seven key Fibonacci retracement levels based on the highest and lowest prices from your chosen lookback period — no manual work required. Dynamic Trend Adaptatio
FREE

Category: Trend Indicator
Platform: MetaTrader 5
Type: Level Indicator
Timeframes: All
Trader Styles: Scalping, Day Trading, Swing Trading
Markets: All Description The Madrid Ribbon is a moving average–based trend visualization tool. It combines multiple exponential or simple moving averages into a ribbon structure that adapts to market changes. The indicator highlights trend direction, possible reentry zones, and areas where reversals may occur. Main features: Dynamic Trend Display – Multiple m

Supports displaying up to 4 trading sessions with fully adjustable start and end times. Each session can be customized individually with unique colors and visual styles. Users can choose between drawing rectangles or filling areas, while the indicator clearly displays each session’s price range for better market insight.
Free to use until the end of 2025. The paid version will be available starting from 2026.
FREE
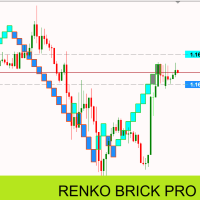
Renko Brick Pro - Advanced Renko Indicator for MT5 Professional Renko bricks with intelligent ATR sizing and ready-to-use EA integration buffers. Renko charts eliminate market noise by creating bricks only when price moves a specific amount. Unlike traditional price charts, each brick represents the same price movement, giving you cleaner trend identification and better entry points. This indicator brings true Renko analysis to MT5 with intelligent ATR-based brick calculations that automatically

This is an ordinary MACD indicator displayed in the main window according to the selected chart style, i.e. Bars, Candlesticks or Line. When you switch the chart type, the indicator display also changes. Unfortunately I could not improve the chart type switching speed. After switching, there are delays before the arrival of a new tick.
The indicator parameters Fast EMA period Slow EMA period Signal SMA period Applied price
FREE

Description: The Custom Moving Averages indicator displays three different moving averages on the chart: a 10-period Simple Moving Average (SMA10) in lime, a 21-period Simple Moving Average (SMA21) in red, and a 200-period Exponential Moving Average (EMA200) in thicker white. This indicator helps traders identify trends and potential entry/exit points based on the behavior of these moving averages. Features: Three moving averages in different periods: SMA10, SMA21, and EMA200. Customizable color
FREE

Trend Dot Indicator MT5
– Clean & Powerful Reversal System A fast-reacting Trend Step Regression (TSR) line with color-coded dots instantly shows the current trend. High-probability BUY/SELL signals appear only when a real reversal occurs, confirmed by minimum trend length and ADX strength. Description here: https://www.mql5.com/en/blogs/post/765867 Features: Clear visual TSR line + dots (blue = up, red = down) Filtered reversal signals with text labels Real-time volume pressure dashboard (B

It is an analogue of the indicator of levels at https://www.mql5.com/en/market/product/24273 for the MetaTrader 5 platform. The indicator shows the levels of the past month, week and day. In addition, it draws a level in percentage relative to the difference between the High and Low of the past month and week. For the daily levels of the past day, the Close levels are additionally displayed. All you need to do is to configure the display parameters of the levels to your liking. In some cases, af

MT5 trend indicator with a probability of reaching a profit of 70-90%! Works without redrawing and delays. Trend Master PRO shows good results on all trading instruments: currencies, metals, indices, stocks, cryptocurrencies. Recommended timeframe: H1-H4.
More information about the indicator is here : https://www.mql5.com/en/blogs/post/744748
Recommendations for use
Use automatic period detection The main feature of the indicator is the self-optimization function. Thank
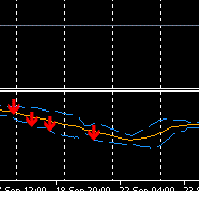
How the Sell Signal Works 1. Bollinger Band condition The current candle must close at or above the Upper Bollinger Band . This signals potential overbought conditions. 2. OBV confirmation (On Balance Volume) OBV must be falling → OBV_now < OBV_prev . Stronger confirmation: OBV decreasing for 2–3 consecutive bars. This shows that buying pressure is weakening . 3. ATR filter (Average True Range) Current ATR must be below its moving average (e.g., ATR_now < ATR_SMA(14) * 1.2 ). Purpose: avoid ente
FREE

You can avoid constant monitoring of computer screen waiting for the DeMarker signal while receiving push notifications to a mobile terminal or a sound alert on the screen about all required events, by using this indicator - DeMarker Alerts. In fact, it is the replacement of the standard indicator with which you will never miss the oscillator signals. If you don't know the benefits of DeMarker or how to use it, please read here . If you need signals of a more popular RSI indicator, use RSI Alert

FREE

Trade in the Footsteps of the Institutions The SMC Institutional Order Flow indicator brings the power of professional trading strategies directly to your MetaTrader 5 terminal. Based on the core principles of Smart Money Concepts (SMC) , this advanced tool automatically maps the key levels and structures used by banks and large institutions to move the market. Stop guessing and start seeing the market through the lens of order flow. This all-in-one suite identifies where institutions have
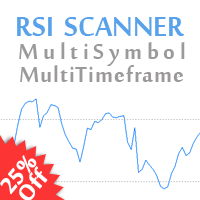
25% off. Original price: $40 RSI Scanner is a multi symbol multi timeframe RSI dashboard that monitors Relative Strength Index indicator for price entering and exiting overbought and oversold in up to 28 symbols and 9 timeframes.
Download Demo here (Scans only M1, M5 and M10) Settings description here MT4 version here
RSI Scanner features: Signals RSI entering and exiting the overbought and oversold zones. Monitors 28 customizable instruments and 9 timeframes at the same time. Supports a

MultiTF Trend Indicator for MetaTrader 5 MultiTF Trend is a technical indicator for MetaTrader 5 designed to display trend directions across multiple timeframes on a single chart. It uses Moving Average (MA) slope analysis combined with an ATR-based threshold to help identify periods of directional movement in the market. This tool presents trend information in a structured and easy-to-read format, allowing users to observe trend alignment across various timeframes without switching charts. Mai

KAB: A Better Baseline. Retail traders tend to "experiment" with tweaking lookback periods manually, repeatedly, until they curve-fit. Instead of cycling EMA(20), EMA(21), EMA(22), we can use KAB. Unlike moving averages (SMA, EMA, WMA, etc.) that are static, and more complex ones (Hull, T3) that are parameter driven, KAB is volatility-aware. The ratio of ATRs (the volatility of volatility) drives the adaptive smoothing gain. Result: stable during chaos, responsive during drift. Most adaptive ind
FREE

Free version. Only works on EURUSD Do you want to always know in a quick glance where price is going? Are you tired of looking back and forth between different timeframes to understand that? This indicator might just be what you were looking for. Trend Signal Multitimeframe shows you if the current price is higher or lower than N. candles ago, on the various timeframes. It also displays how many pips higher or lower current price is compared to N. candles ago. Number N. is customizable The data
FREE

This indicator can help you clearly identify trend changes in both bullish and bearish markets. The indicator compares the closing price of the last candle with the closing price of the candle "X" periods ago (input parameter). In an uptrend, an initial number '1' is plotted if a candle closes higher than the closing of a candle "X" periods ago. In a downtrend, an initial number '1' is plotted if a candle closes below the closing of a candle "X" periods ago. Subsequent numbers are plotted when e
FREE

Introducing the Accelerator Divergence Indicator, a powerful tool designed to enhance your Forex trading experience. This innovative indicator is specifically crafted to identify market divergence, providing traders with valuable insights for more informed decision-making. The Accelerator Divergence Indicator utilizes advanced algorithms to detect divergence in the market, visually guiding traders with precision-drawn lines that highlight key points of interest. Divergence occurs when the price
FREE

This indicator is a basic RSI but comes up with a useful feature.
You can set zones within the RSI and these zones can be displayed with different background colours. (You can see on the pictures below) You need to set the zone ranges and their colours at the input parameters. Six different zones can be set.
Should you have any questions or comments, feel free to contact me.
FREE
Gold Signal Quality Selector Stop Guessing. Start Trading Gold with Institutional-Grade Clarity. Are you tired of the chaotic nature of the Gold (XAUUSD) market? Frustrated with generic indicators that generate endless false signals and drain your capital? The truth is, Gold doesn't move like other assets. It demands a specialized tool built for its unique volatility and personality. It's time to stop using one-size-fits-all tools and start trading with an intelligent edge. Introducing Gold Sign

Chaikin Money Indicator (CMF) – Free Trading Indicator
The Chaikin Flow Indicator (CMF) is a technical analysis tool based on the original Chaikin Money Flow (CMF) indicator, developed by Marc Chaikin in the 1980s. It is designed to track capital flows into an asset and helps identify buying and selling pressure. This indicator is useful for both intraday trading and medium-term analysis .
How CMF Works CMF analyzes price action and volume over a given period by calculating the Money Flow Mult
FREE

Machine Learning Adaptive SuperTrend - Take Your Trading to the Next Level!
Introducing the Machine Learning Adaptive SuperTrend , an advanced trading indicator designed to adapt to market volatility dynamically using machine learning techniques. This indicator employs k-means clustering to categorize market volatility into high, medium, and low levels, enhancing the traditional SuperTrend strategy. Perfect for traders who want an edge in identifying trend shifts and market conditio
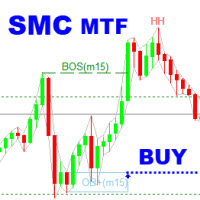
SMC Analyzer Multi-Timeframe is a powerful tool designed to help traders apply Smart Money Concepts (SMC) across multiple timeframes. This indicator identifies key structural points such as market structure shifts (Break of Structure and Change of Character), order blocks, fair value gaps (FVG), and liquidity zones from higher timeframes and overlays them onto the current chart. By aligning these critical SMC signals across multiple timeframes, traders gain a more comprehensive view of instituti
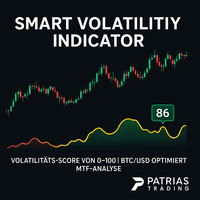
Smart Volatility Indicator – Precise Volatility Detection for MetaTrader 5 The Smart Volatility Indicator is an innovative tool for accurately measuring market volatility – specifically developed for MetaTrader 5. It combines candle range, wick ratios, and smart filtering logic into a clear, scalable volatility score from 0 to 100 . Perfect for traders who want to respond to breakouts, trend dynamics, or consolidating markets – manually or via Expert Advisors (EAs). Key Features Smart Volatility
FREE

QuantumAlert RSI Navigator is a free indicator available for MT4/MT5 platforms, its work is to provide "alerts" when the market is inside "overbought and oversold" regions in the form of "buy or sell" signals. This indicator comes with many customization options mentioned in the parameter section below, user can customise these parameters as needful. Join our MQL5 group , where we share important news and updates. You are also welcome to join our private channel as well, contact me for the priva
FREE

O RFOC Mini Chart Simple foi criado para projetar uma visão macro do mercado, que além de ter a opção de selecionar o timeframe de interesse diferente do gráfico principal.
Na versão completa é possível incluir 2 indicadores:
1 - Canal de média móvel No mini gráfico será criado a média móvel baseada nos preços do time frame selecionado para o RFOC Mini Chart. O período da média móvel deve ser selecionado no painel de configurações do indicador.
2 - Banda de Boillinger No mini gráfico será cri
FREE

MT5 Enveloping Pattern Detector: Your competitive advantage in trading Are you looking for a tool to help you accurately identify the best trading opportunities in the forex market? Our Engulfing Pattern Detector provides you with a highly reliable buy or sell signal, based on one of the most recognized and effective Japanese candlestick patterns: the engulfing pattern. With an average success rate of 70%, this indicator will allow you to make safer and more profitable investment decisions. Don'
FREE

Sentimento de Mercado é um indicador que usa os dados do nosso principal indicador: Market Strength Radar.: https://www.mql5.com/pt/market/product/114568?source=Site +Profile+Seller Ele imprime um gráfico de linhas que deve ser comparado com o gráfico de preço para entendermos o sentimento do mercado. As divergencias são pontos importantes de inflexão. As convergências mostram força da tendência atual.
FREE

This indicator will help you track performance of your trades, even scalping trades. You can use it with the Arab, and many other traders.
This indicator displays essential trading account information directly on your chart. It positions itself in one of the four corners of the screen and showcases details such as: Symbol: The symbol of the asset currently displayed on the chart. Profit/Loss: The total profit or loss in dollars for the current symbol. Pips: The total number of pips gained or
FREE

Matrix Currency - Ferramenta de Análise Multi-Timeframe O Matrix Currency é um indicador avançado para análise de força das moedas no mercado Forex, projetado para oferecer monitoramento eficiente e suporte estratégico nas suas operações de trading. Características Principais: Análise Multi-Timeframe : Monitora múltiplos períodos simultaneamente (M1 a MN1) com atualização em tempo real em uma matriz intuitiva. Sistema de Alertas : Notificações configuráveis, via pop-up, email e dispositivos móv
FREE

The underlying strategy of this indicator is based on identifying momentum in the market and attempting to capture the direction of the trend through transitions between bullish and bearish moments. Utilizing bands around the RWMA allows for identifying potential overbought and oversold situations in the market.
1. Calculation of the Range Momentum Index (RMI): The RMI is based on a combination of the Relative Strength Index (RSI) and the Money Flow Index (MFI), both of which are momentum indi

The UTS Trading Stat indicator, developed by Ultron Trading Solutions, is a customizable tool designed to track and display trading statistics for the current chart's symbol. It presents a visual dashboard on the chart, offering real-time insights into trading performance with a toggleable panel (STAT SHOW/STAT HIDE) for user convenience. Below is a detailed description of its features and functionality: Trading Statistics Displayed : Current Positions : Number of open profit/loss trades and tot

The index makes it easy for traders to know the opening and closing times of global markets :
- Sidney - Tokyo - London - New York
Where it misleads each time zone and enables us to know the times of overlapping the markets when the liquidity is high.
To get more indicators and signals, follow us on the Telegram channel link
https://t.me/tuq98
Or our YouTube channel, which has explanations in Arabic and a technical analysis course
https://www.youtube.com/@SSFX1
FREE

Introduction to GARCH Indicator GARCH is the short initial for Generalized Autoregressive Conditional Heteroskedasticity and it is the volatility prediction model commonly used in financial industry. GARCH model was first appeared in the work by Danish Economist, Tim Peter Bollerslev in 1986. The 2003 Nobel Prize winner, Robert F Engle also added much contribution for the refinement of GARCH model with Tim’s work. Our GARCH INM predictor took the original method of Nelder Mead for GARCH model bu
FREE

Os candles do tipo Heikin Ashi são uma ferramenta poderosa para os traders, oferecendo uma visualização clara e suave das tendências do mercado. Diferente dos candles tradicionais, eles filtram o ruído do mercado, proporcionando uma visão mais limpa da direção e força do mercado, ajudando os traders a tomar decisões mais informadas. O indicador Hull Heikin Ashi Smoothed da Minions Labs leva isso um passo além, integrando a Hull Moving Average para maior suavização e precisão. Este indicador não

Trendlines with Breaks Overview The Trendlines with Breaks indicator automatically detects and plots pivot-based trendlines, dynamically adjusting their slope and steepness to highlight significant breakout events. Designed for traders who rely on price action and market structure , this tool provides an automated, real-time way to track evolving momentum and breakout confirmations . How It Works The indicator identifies swing highs and swing lows , connecting them to form adaptive trendlines ba

Bollinger Bands Technical Indicator (BB) is similar to envelopes. The only difference is that the bands of Envelopes are plotted a fixed distance (%) away from the moving average, while the Bollinger Bands are plotted a certain number of standard deviations away from it. Standard deviation is a measure of volatility, therefore Bollinger Bands adjust themselves to the market conditions. When the markets become more volatile, the bands widen and they contract during less volatile periods. This ada
FREE

Highly configurable Accumulation and Distribution (AD) indicator. Features: Highly customizable alert functions (at levels, crosses, direction changes via email, push, sound, popup) Multi timeframe ability Color customization (at levels, crosses, direction changes) Linear interpolation and histogram mode options Works on strategy tester in multi timeframe mode (at weekend without ticks also) Adjustable Levels Parameters:
Ad Timeframe: You can set the lower/higher timeframes for Ad. Ad Bar Shif
FREE

Structure Levels (Highs & Lows) Indicator for MetaTrader 5
Decode Market DNA — Trade with Institutional Precision Description:
The Structure Levels (Highs & Lows) Indicator is your secret weapon to map the market’s hidden roadmap. Designed for traders who think in terms of price action and market structure, this tool automatically identifies critical swing highs and swing lows, transforming chaotic charts into a clear blueprint of support/resistance zones, breakout opportunities, and trend rev

Pivot eXtreme Pivot adalah level referensi penting yang digunakan trader untuk memetakan potensi support & resistance intraday maupun jangka lebih panjang.
Dalam sistem ini, level pivot dikembangkan menjadi P (Pivot Point utama) , R1–R13 (Resistance) , serta S1–S13 (Support) . Pivot Point (P) Titik pusat utama, dihitung dari rata-rata harga (High + Low + Close) / 3 . Berfungsi sebagai acuan keseimbangan harga : Jika harga di atas P → tren cenderung bullish. Jika harga di bawah P → tren cenderung
FREE

As Expansões M são variações da Proporção Áurea (Sequência de Fibonacci). É a primeira técnica de projeção, no mercado mundial, desenvolvida para ancoragem em Candle.
Vantagens:
Fácil Plotagem, pode ser ancorada em apenas um Candle; Alto grau de precisão como suportes / resistências; Excelente relação de Risco x Retorno; Funciona em qualquer tempo gráfico; Funciona em qualquer ativo. As regiões das Expansões M são classificadas em:
M0: Ponto 0 (candle inicial)
LC: Linha de suporte inicial
FREE

If you like this product, please give it a 5 star rating as a token of appreciation.
This indicator plots horizontal trend lines at the opening price of each quarter (Q1–Q4) on the chart. These lines visually represent quarterly open levels of the current year, which traders often use as support/resistance or reference points. Automatically plots Q1–Q4 opening levels as trend lines on the chart. Lines are dashed, colored, and labeled. Handles both current and historical quarters. Cleans up line
FREE
Overview
MAM Forecast is an indicator designed to replace guesswork with probabilities. It generates two adaptive levels—UP and DN—along with probabilities that always sum to 100%, giving you a clear idea of which level price is more likely to reach within the chosen horizon. Key Features Displays UP (upper) and DN (lower) adaptive levels calibrated to market volatility. Shows touch probabilities (e.g., 62% vs 38%) for likelihood within the defined horizon. Clean, informative HUD indicates sym
FREE
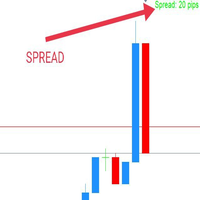
WaSpread MT5 Indicator shows the current spread in pips with color.
* Set the Spread Threshold and the color to identify when the current spread is below or above the Spread Threshold.
* Set X axis and Y axis and chose the Corner and the Anchor to position the Spread Label on the chart.
* Write the font and the font size for more confort.
* Activate alert if the current spread is above the spread threshold.
* For more precision, the user can choose to show the decimal numbers.
* The user
FREE
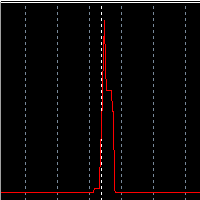
Olá! me chamo Saullo e sou programador MQL5/4 especializado em serviços personalizados para Metatrader. Este é um Indicador bem simples que mostra no grafico o historico do spread de cada candle do ativo do gráfico. Me siga no instagram: @saullo_algotrader Se precisar de serviços de desenvolvimento personalizados para metatrader entre em contato comigo pelo instagram. Muito obrigado!
FREE

The " Pure View " indicator is designed to quickly display and hide indicators on the chart. Description
1. Currently Pure View works with Stochastic, MACD, RSI indicators 2. Displaying and hiding indicators occurs using hot keys 3. The key combination Shift + C will display or hide the "Stochastic" indicator on the chart 4. The key combination Shift + V will display or hide the "RSI" indicator on the chart 5. The key combination Shift + B will display or hide the "MACD" indicator on the chart
A
FREE

Normal Parabolic SAR with label of long or short state. Tells also "Parabolic long" and "short". Can be used in multitimeframe layouts together with Swiss HolyGrail indicator or in different timeframes. So, if all the indicators show "long" or "short" you can be sure that the risk of a wrong direction is small. The standard values for Parabolic SAR are 0.02 for step and 0.2 for maximum. You may experiment with changing the maximum to get smother curves. Note that changes in parabolic SAR are la
FREE

Este indicador permite que você transforme a aparência do seu gráfico aplicando uma transição suave entre duas cores personalizáveis para o fundo. Esse efeito de gradiente chamativo dá ao seu gráfico uma aparência nova e moderna, tornando-o mais visualmente atraente. O gradiente é aplicado a todas as janelas de indicadores atualmente no seu gráfico quando o indicador é anexado e também afetará quaisquer novas janelas de indicadores adicionadas posteriormente. Experimente e dê um novo visual aos
FREE
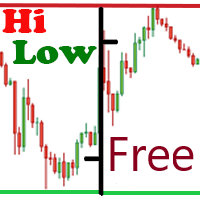
The free version of the Hi Low Last Day indicator . The Hi Low Levels Last Day indicator shows the high and low of the last trading day . The ability to change the color of the lines is available . Try the full version of the Hi Low Last Day indicator , in which additional indicator features are available : Displaying the minimum and maximum of the second last day Displaying the minimum and maximum of the previous week Sound alert when crossing max . and min . levels Selecting an arbitrary audio
FREE

Product Description Clean, Smart Sessions is a professional trading sessions indicator designed to provide traders with a clear, accurate, and clutter-free view of the active market sessions directly on the chart. The indicator dynamically detects and displays the active trading session (Asian, London, and New York) in real time, drawing a clean session box that continuously updates to reflect the session’s true high and low. When sessions overlap, each active session is handled independently
FREE
O mercado MetaTrader é um espaço, sem precedentes, para negociar robôs e indicadores técnicos.
Leia o artigo Manual do usuário da MQL5.community para saber mais sobre os serviços exclusivos que oferecemos aos traders: cópia de sinais de negociação, aplicativos personalizados desenvolvidos por freelances, pagamentos automáticos através de sistema de pagamento e a rede em nuvem MQL5.
Você está perdendo oportunidades de negociação:
- Aplicativos de negociação gratuitos
- 8 000+ sinais para cópia
- Notícias econômicas para análise dos mercados financeiros
Registro
Login
Se você não tem uma conta, por favor registre-se
Para login e uso do site MQL5.com, você deve ativar o uso de cookies.
Ative esta opção no seu navegador, caso contrário você não poderá fazer login.