Something Interesting - page 13
You are missing trading opportunities:
- Free trading apps
- Over 8,000 signals for copying
- Economic news for exploring financial markets
Registration
Log in
You agree to website policy and terms of use
If you do not have an account, please register
This is very interesting EA coded by Farhad Farshad: FarhadCrab1 - expert for MetaTrader 4
This is interesting but very dangerous one - why? Just attach this EA to GBP/JPY chart, M1 timeframe, change lot size from 0.1 to 0.01 (other settings keep to be default ones) - and you will see ...
I traded by this EA on demo for two and half hours and I understand about the following:
It may be good to look at very improved version of this EA for example ...
This is very interesting EA coded by Farhad Farshad: FarhadCrab1 - expert for MetaTrader 4
This is interesting but very dangerous one - why? Just attach this EA to GBP/JPY chart, M1 timeframe, change lot size from 0.1 to 0.01 (other settings keep to be default ones) - and you will see ...
...
I traded by this EA on demo for two and half hours and I understand about the following:
...
It may be good to look at very improved version of this EA for example ...
Updated statement:
Forum on trading, automated trading systems and testing trading strategies
Gold is Reaching at 1270
Sergey Golubev, 2013.07.01 21:04
How can we know: correction, or bullish etc (in case of using indicator for example)?
well ... let's take AbsoluteStrength indicator from MT5 CodeBase.
bullish (Bull market) :
bearish (Bear market) :
ranging (choppy market - means: buy and sell on the same time) :
flat (sideways market - means: no buy and no sell) :
correction :
correction in a bear market (Bear Market Rally) :
Dots/arrows on the charts above are PriceChannel Signal indicator from CodeBase here.
Forum on trading, automated trading systems and testing trading strategies
How to Start with Metatrader 5
Sergey Golubev, 2013.08.04 18:27
If you are totally new to this website and
there are some pages which will help you to start :
Forum on trading, automated trading systems and testing trading strategies
How to Start with Metatrader 5
Sergey Golubev, 2016.04.27 07:21
You can :
Renko - indicator for MetaTrader 5
============
Renko (extraction from Achelis - Technical Analysis from A to Z)
============
Overview
The Renko charting method is thought to have acquired its name from "renga" which is the Japanese word for bricks. Renko charts are similar to Three Line Break charts except that in a Renko chart, a line (or "brick" as they're called) is drawn in the direction of the prior move only if prices move by a minimum amount (i.e., the box size). The bricks are always equal in size. For example, in a 5-unit Renko chart, a 20-point rally is displayed as four, 5-unit tall Renko bricks.
Kagi charts were first brought to the United States by Steven Nison when he published the book, Beyond Candlesticks.
Interpretation
Basic trend reversals are signaled with the emergence of a new white or black brick. A new white brick indicates the beginning of a new up-trend. A new black brick indicates the beginning of a new down-trend. Since the Renko chart is a trend following technique, there are times when Renko charts produce whipsaws, giving signals near the end of short-lived trends. However, the expectation with a trend following technique is that it allows you to ride the major portion of significant trends.
Since a Renko chart isolates the underlying price trend by filtering out the minor price changes, Renko charts can also be very helpful when determining support and resistance levels.
Calculation
Renko charts are always based on closing prices. You specify a "box size" which determines the minimum price change to display.
To draw Renko bricks, today's close is compared with the high and low of the previous brick (white or black):
If the closing price rises above the top of the previous brick by at least the box size, one or more white bricks are drawn in new columns. The height of the bricks is always equal to the box size.
If the closing price falls below the bottom of the previous brick by at least the box size, one or more black bricks are drawn in new columns. Again, the height of the bricks is always equal to the box size.
If prices move more than the box size, but not enough to create two bricks, only one brick is drawn. For example, in a two-unit Renko chart, if the prices move from 100 to 103, only one white brick is drawn from 100 to 102. The rest of the move, from 102 to 103, is not shown on the Renko chart.
Renko_v1 - indicator for MetaTrader 5
====
How to Use Renko Bricks and Moving Averages to Find Trades
Talking Points
- Renko bars help filter the noise
- Renko bars reveal clearer entries and exits
- Moving Averages can be used with Renko bars with some minor setting changes to pinpoint entries
Seeing the trend without Forex market noise is the goal of every trader. Too many times, traders get head-faked by the twists and turns of price action.In addition moving averages can be used to signal entries and exits as well. A couple of settings have to be changed in order to get the moving averages which are usually tied to time, to work with a chart system that is based on price.
To add a 13-period exponential moving average to the Renko chart, choose EMA from the Add Indicator menu then change “Number of periods” to 13.
Notice the chart above which displays both Renko bars and a 13-period exponential moving average. A simple system can be built around the Renko bars and the moving average. When Renko price bars cross below the moving average and turns red, traders can enter short and stay with the trend until the Renko bars cross back above the moving average.
An initial stop could be placed just above the last blue Renko brick. Keep in mind that in the above example, each brick is equal to five pips. In the above example, the red circles mark where the Renko bars crossed below the moving average. A trader can see that a number of pips could have been gathered as the bars stayed below the moving average.
On the other hand, when the Renko bars change color and cross above the moving average, traders can enter long placing stop just below the last red Renko brick. The above chart shows in the green circles, points were the Renko price bars moved above the moving average generating a clear buy signal.
Renko charts, without the dimension of time, may take a little getting a little used to. But once you get the hang of them, you may find it difficult to go back to the candles. Adding a moving average gives excellent signals for entry and exit. Marrying them up with other indicators can magnify the benefits of trading without noise and scary wicks!
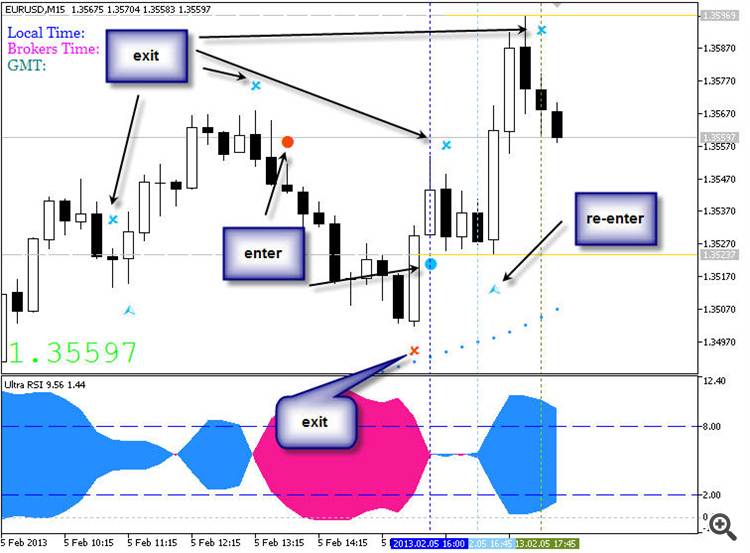
Something interesting during the weekend: the video about exit
The Importance of Exit Strategy, part 1
The Importance of Exit Strategy, part 2
The Importance of Exit Strategy, part 3
The Importance of Exit Strategy, part 4 - guidance of great traders
Scalping
Forum on trading, automated trading systems and testing trading strategies
Press review
Sergey Golubev, 2014.03.07 09:08
Who Can Trade a Scalping Strategy? (based on dailyfx article)
The term scalping elicits different preconceived connotations to different traders. Despite what you may already think, scalping can be a viable short term trading methodology for anyone. So today we will look at what exactly is scalping, and who can be successful with a scalping based strategy.
What is a Scalper?
So you’re interested in scalping? A Forex scalper is considered anyone that takes one or more positions throughout a trading day. Normally these positions are based around short term market fluctuations as price gathers momentum during a particular trading session. Scalpers look to enter the market, and preferably exit positions prior to the market close.
Normally scalpers employ technical trading strategies utilizing short term support and resistance levels for entries. While normally fundamentals don’t factor into a scalpers trading plan, it is important to keep an eye on the economic calendar to see when news may increase the market’s volatility.
High Frequency Trading
There is a strong misconception that all scalpers are high frequency traders. So how many trades a day does it take to be considered a scalper? Even though high frequency traders ARE scalpers, in order for you to qualify as a scalper you only need to take 1 position a day! That is one of the benefits of scalping. You can trade as much or as little as you like within a giving trading period.
This also falls in line with one of the benefits of the Forex market. Due to the 24Hr trading structure of Forex, you can scalp the market at your convenience. Take advantage of the quiet Asia trading session, or the volatile New York – London overlap. Trade as much or as little as you like. As a scalper the choice is ultimately yours to make!
Risks
There are always risks associated with trading. Whether you are a short term, long term, or any kind of trader in between any time you open a position you should work on managing your risk. This is especially true for scalpers. If the market moves against you suddenly due to news or another factor, you need to have a plan of action for limiting your losses.
There are other misconceptions that scalpers are very aggressive traders prone to large losses. One way to help combat this is to make scalping a mechanical process. This means that all of your decisions regarding entries, exits, trade size, leverage and other factors should be written down and finalized before approaching the charts. Most scalpers look to risk 1% or even less of their account balance on any one position taken!
Who can Scalp?
So this brings us to the final question. Who can be a scalper? The answer is anyone with the dedication to develop a trading strategy and the time to implement that strategy on any given trading day.
=================
Trading examples
Metaquotes demo
GoMarkets broker, initial deposit is 1,000
Alpari UK broker initial deposit is 1,000
RoboForex broker initial deposit is 1,000
Forum on trading, automated trading systems and testing trading strategies
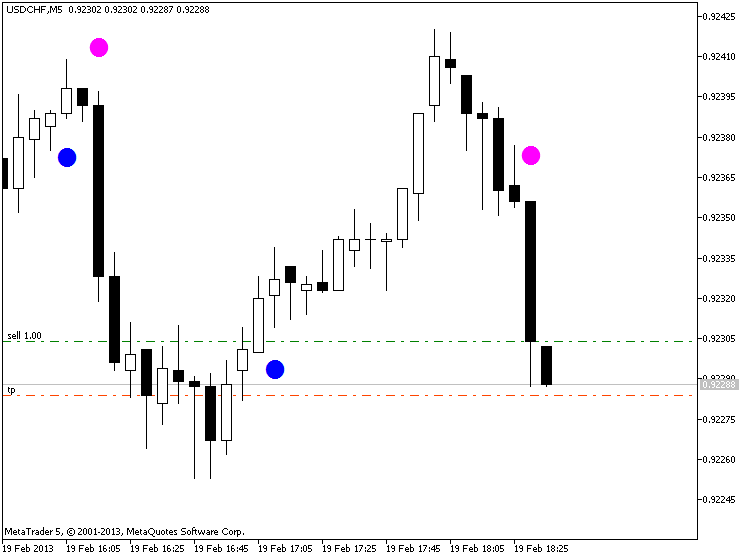
PriceChannel Parabolic system
Sergey Golubev, 2013.02.14 14:45
I remember some talking between very experience trader and newbie:
:)
Forum on trading, automated trading systems and testing trading strategies
PriceChannel Parabolic system
Sergey Golubev, 2013.03.22 14:04
PriceChannel Parabolic system
PriceChannel Parabolic system basic edition
Latest version of the system with latest EAs to download
How to trade
The settingas for EAs: optimization and backtesting
Trading examples
Metaquotes demo
GoMarkets broker, initial deposit is 1,000
Alpari UK broker initial deposit is 1,000
RoboForex broker initial deposit is 1,000
Scalping
Forum on trading, automated trading systems and testing trading strategies
Indicators: Moving Average of Oscillator (OsMA)
Sergey Golubev, 2014.03.21 07:04
Scalping with MACD (based on dailyfx article)
When a scalper begins their day, there are usually quite a few questions that need to be answered before ever placing a trade.
What’s moving the market this morning?
Which markets are most active?
What drivers (or news) might come out to push the market further?
Is my coffee ready yet?
These are just a few examples… but suffice it to say that those who are day-trading in markets have quite a bit on their mind every single trading day.
The Setup
Before a scalper ever triggers a position they need to first find the appropriate market environment.
For fundamental-based traders, Multiple Time Frame Analysis can be helpful; but more important is their outlook or opinion and the fact that that outlook or opinion should mesh with the ‘bigger picture’ view of what’s going on at the moment.
For scalpers, the hourly and 4-hour charts carry special importance, as those are the ideal timeframes for seeing the bigger picture.
After that, traders should look to diagnose the trend (or lack thereof).
A great indicator for investigating trend strength is the Average Directional Index (ADX). Also popular for investigating trends is the Moving Average Indicator.
The Entry
After the day-trader has found a promising setup, they then need to decide how to trigger into positions, and MACD can be a very relevant option for such situations.
Because the trader already knows the direction they want to trade in, they merely need to wait for a corresponding signal via MACD to initiate the position.
When MACD crosses up and over the signal line, the trader can look to go long.
After a long position is triggered, the trader can look to close the position when MACD moves down and under the signal line (which is usually looked at as a sell signal, but because you did the ‘bigger picture analysis’ with the longer-term chart, this is merely a ‘close the long signal.’)
Scalpers can trigger positions when MACD Signal takes place in direction of their bias
On the other side of this equation: If the trader had determined the trend to be down on the longer-term chart or if their fundamental bias is pointing lower, they can look for MACD to cross down and under the signal line to trigger their short position.
And once MACD crosses up and over the signal line, the trader can look to cover their short position.
Scalpers can close positions when opposing MACD Signal takes place
The Context
The aforementioned approach can work phenomenally in a day-trading/scalping approach. But the fact-of-the-matter is that scalping profitably entails a lot more than just a trading plan, and an entry strategy.
Risk management is the undoing of most new traders; and day-traders and scalpers fall victim to this susceptibility even more so than most.