Join our fan page
- Views:
- 75375
- Rating:
- Published:
- Updated:
-
Need a robot or indicator based on this code? Order it on Freelance Go to Freelance
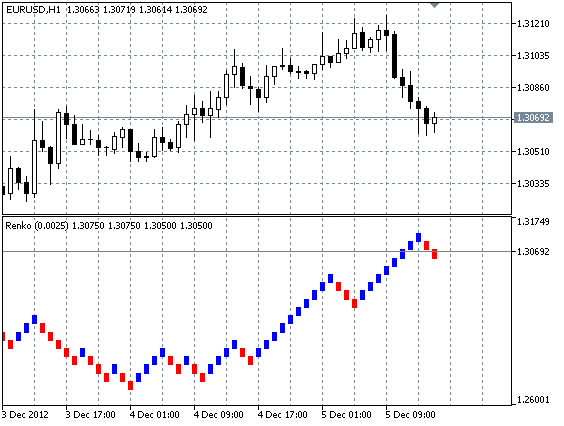
The renko charts outwardly resemble three-linear breakthrough charts, but in case of the renko all boxes are of the same size. During drawing the indicator, only those movements which value is more or equal to a set threshold are considered. The renko is good to use in markets with a significant trend movements as far as a trader gets lion's share of any significant trend. And, vice versa in periods of flat the renko signals are unreliable.
Considering review of the indicator, i.e. the fact that the drawing of the renko chart on close prices of large timeframes, the indicator "missed" rollbacks and trend changes inside bars, the given version of the indicator always draws on close prices of the minute timeframe. In other words, no matter on what chart timeframe the indicator will be attached, with the same parameter of the box size the renko charts will always look the same as the charts will consider "all happening" (on М1 timeframe).

Recommendations:
- The main signal is the appearance of a bullish color box after bearish color box and vice versa.
- The signal will be more reliable after a series of false reversals (i.e. after the sideways trend).
- The renko is also useful to define support and resistance levels.
Translated from Russian by MetaQuotes Ltd.
Original code: https://www.mql5.com/ru/code/1299
 Exp_ColorMomentum_AMA
The Expert Advisor drawn on the basis of the change of direction of the ColorMomentum_AMA indicator.
 i-BandsPrice
The trend indicator drawn on the basis of the Bollinger Bands.
 i-KlPrice
A trend indicator drawn on the basis of the advanced Keltner channel.
 Disparity Index
Disparity Index (difference index) displays the difference between the close price and chosen Moving Averages in percentage. It is recommended to use in combination with the other candlestick models