Writing an effective advisor
With the help of one of the topics in the MT5 section of this forum, the idea of creating an effectively working Expert Advisor that generates real profit was born. The idea is this: I start, give reasons why, then I make a start code, explain all the nuances you need to know, you test it, see how the robot works and, if you find flaws, you call it out. We fix it, test it again, search... And so on until we get a "non-clearance".
Good evening and good mood everyone!
The idea of a "non-slivator" is interesting in itself, but there are a lot of "But!"
Anyway, get started, I'll try to help.
Regards, Vladimir.
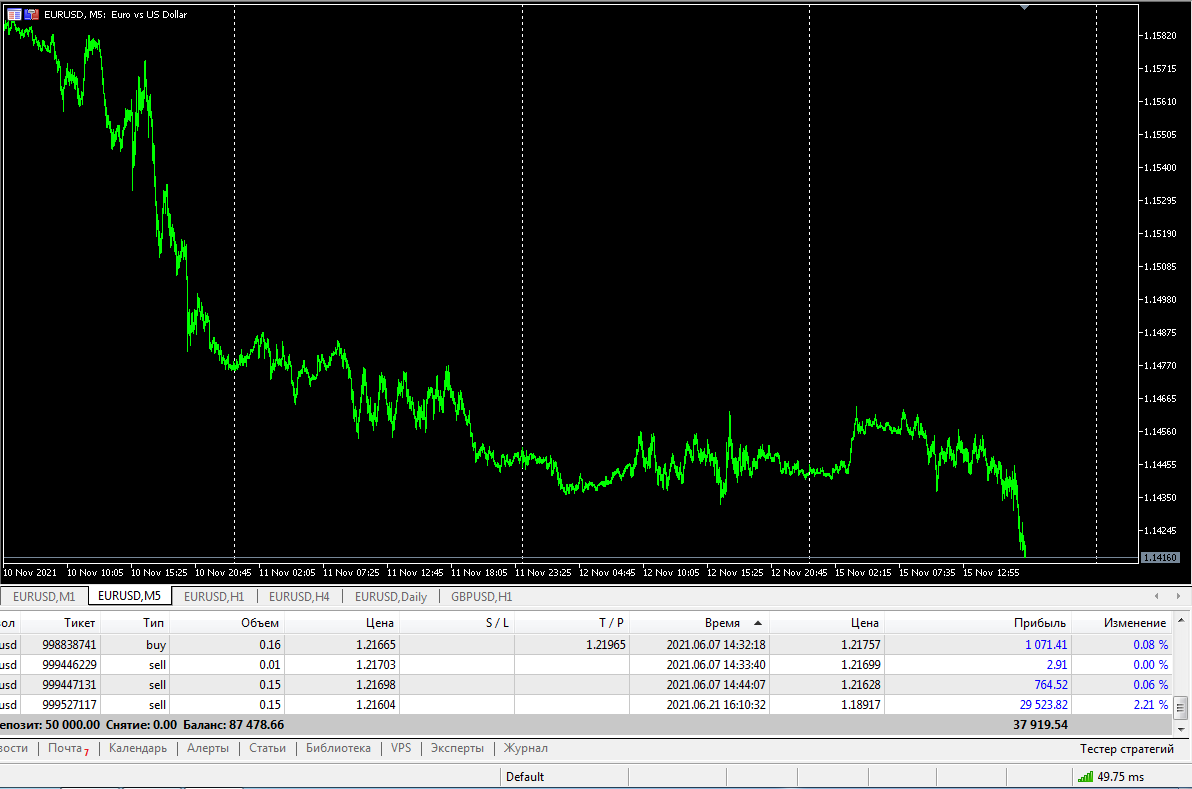
We gather the base material on the basis of which we will make the Expert Advisor code. Here's a screenshot of another mistake of my binary options trading:

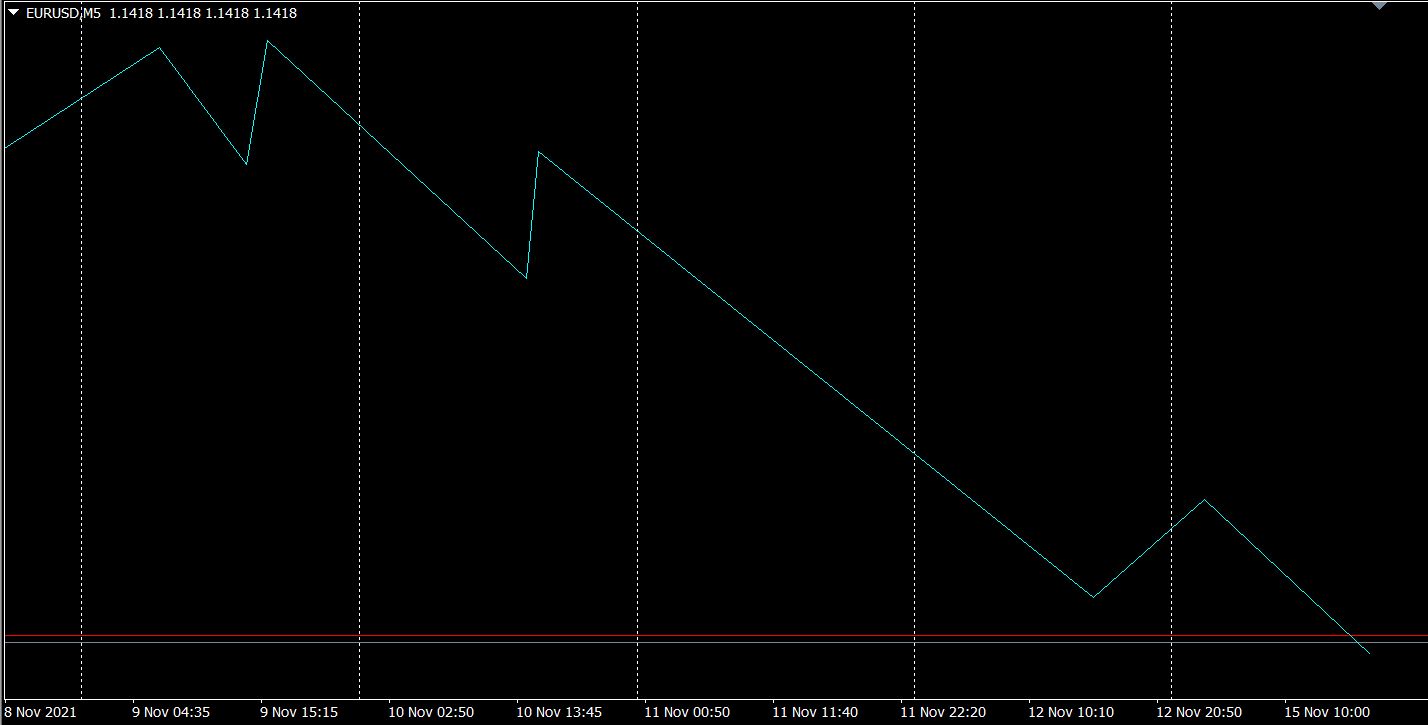
Note this downtrend. How many red candles are in it? I counted 12. Let's call them "trend candles" and the green ones are "counter-trend candles". How many counter-trend candles are there? 2? 3? 4?
This gives us the idea to trade as follows: we draw a trend line on the chart (it can slope downwards or upwards only - we will not trade in a horizontal channel yet). We open a starting (minimum) lot on each candle. Once the trend line is broken (the close price of the first candle will be behind the trend line), we automatically close all orders, and stop trading.
Let us define the terms breakout and penetration. For example, a breakout upwards and a pierce upwards.
If the close price of the first candle is higher than the level we need, we will say that this level is broken through. If the shadow of the first candle is above the level needed but the close price is below it, the breakout failed and we have a puncture.

In this screenshot, the next green candle closed above the blue level of the local high. This level it has broken through. Now the puncture:

In this screenshot, the high of the green candle is above the blue level, but the closing price of the candle is lower. It turns out that the shadow of the candle, like the needle of a syringe, just pierced the level, but the body of the candle could not break the level - the body of the candle is below the level.
We gather the base material on the basis of which we will make the Expert Advisor code. Here's a screenshot of another error in my binary options trading:
...
Is it multicurrency? If so, it should be written for mt5, so it can be tested and further developed. There is no point in starting something for mt4, tester's capabilities are extremely limited there.
We gather the base material on the basis of which we will make the Expert Advisor code. Here's a screenshot of another mistake of my binary options trading:
Pay attention to this low falling trend. How many red candles are in it? I counted 12. Let's call them "trend candles" and the green ones are "counter-trend candles". How many counter-trend candles are there? 2? 3? 4?
This gives us the idea to trade as follows: we draw a trend line on the chart (it can slope downwards or upwards only - we will not trade in a horizontal channel yet). We open a starting (minimum) lot on each candle. Once the trend line is broken (the close price of the first candle will be behind the trend line), we automatically close all the orders and stop the trading.
Vitaly, these observations may well be taken as the basis for the "start-up" code.
Best regards, Vladimir.
My practice shows that anything can happen in terms of statistics on the chart. That is why in this trading system (let's call it "Trading Along the Trend Line"), we will intentionally choose such charts for each specific case and on such timeframes where the trend is clearly seen, and the amount of trend candles is higher than the amount of counter-trend candles. For example, I have seen many times the charts (they are usually cross pairs) that show the following trend: one more trend candle (relatively long), then three or five counter-trend (short) candles, then 1-2 long trend candles again, and then another bounce in 5 counter-trend candles. As a result, there are 3-5 counter-trend candles per one trend candle. On such a currency pair this tendency tends to repeat itself and such a chart is not suitable for trading for the time being. However, the ratio of trend/ counter-trend candlesticks may be different in a higher/lower timeframe. Therefore, before drawing the trend line on the chart, we should carefully analyze the trading instrument that we are going to use in trading.
Try looking at the charts from a different angle, such as the one I have. The chart below is on a five minute timeframe and it looks completely different when squeezed to its fullest. It is much easier to see the trend and to draw the trend line.
Regards, Vladimir.
By the way, Vitaly, I want to emphasise that creating an EA based on indicators is a waste of time. This is my personal opinion and it may not coincide with other opinions at all. However, there is a simple truth - an indicator reflects the price movement but the price moves after the indicator.
Regards, Vladimir.
Try looking at the charts from a different angle, such as the one I have. The chart below is on a five minute timeframe and it looks completely different when squeezed to its fullest. It is much easier to see the trend and to draw the trend line.
Sincerely, Vladimir.
We can remove the excessive noise (no offence to the pipers) and obtain the chart with the wave structure clearly visible.
- Free trading apps
- Over 8,000 signals for copying
- Economic news for exploring financial markets
You agree to website policy and terms of use
With the help of one of the topics in the MT5 section of this forum, the idea of creating an effectively working Expert Advisor that generates real profit was born. The idea is as follows: I start, give reasons why, then I make a starting code, explain all the nuances you need to know, you test it, watch how the robot works and, if you find flaws, you tell me. We fix it, test it again, search... And so on, until we find a "non-clearer".
I will name my Expert Advisor "Binarnic". The file name will look as follows: Binarnic_1.0.
I want to stress this point and tell you why: since no one is allowed to make changes in the code of my EA, I want my code versions not to be mixed up with versions of other forum users. For example, a user named Ivan wants to change my code. He makes changes, but calls his file Binarnic_Ivan_1.1. With this approach, it becomes clear that he took my file Binarnic_1.0, made changes to it and the result is the next version of the file - " Binarnic_Ivan_1.1".
I think everyone would agree with these simple rules, for they are reasonable.