Master Candle's Trendlines until it's broken

 
Hello all,
i am writing a "Master Candle" indicator (on H1).

Master candles are highlighted, but now, i need to draw high and low trend lines until the price break these high or low.
Then the trendline are stopped to be drawn on the (H1) candle breakout.
How can i do that  please ?

Here is my code :
for(int i_H1=0;i_H1<MC_H1_Range_To_Process;i_H1++)
            {
              string tname=NULL;

              datetime t_Start=0;
              datetime t_End=0;
              datetime t_Master_Start=0;
              datetime t_Master_End=0;

              double high=0;
              double low=0;
              double master_high=0;
              double master_low=0;

              if(TLR_Button_MC_H1_Range_State==true)
                {
                  // --- HL rectangles
                    tname=TimeToString(iTime(NULL,PERIOD_H1,i_H1+1));

                    t_Start=iTime(NULL,PERIOD_H1,i_H1+1);
                    t_End=iTime(NULL,PERIOD_H1,i_H1+0);
                    t_Master_Start=iTime(NULL,PERIOD_H1,i_H1+2);
                    t_Master_End=iTime(NULL,PERIOD_H1,i_H1+1);

                    high=iHigh(NULL,PERIOD_H1,i_H1+1);
                    low=iLow(NULL,PERIOD_H1,i_H1+1);

                    master_high=iHigh(NULL,PERIOD_H1,i_H1+2);
                    master_low=iLow(NULL,PERIOD_H1,i_H1+2);

                    RectangleCreate(0,                             // chart's ID
                                    "TLR_MC_H1_Range_H1_HL"+tname, // rectangle name
                                    0,                             // subwindow index 
                                    t_Start,                       // first point time
                                    high,                          // first point price
                                    t_End,                         // second point time
                                    low,                           // second point price
                                    Levels_H1_Dark_clr,            // rectangle color
                                    0,                             // style of rectangle lines
                                    0,                             // width of rectangle lines
                                    false,                         // filling rectangle with color
                                    false,                         // in the background
                                    false,                         // highlight to move
                                    true,                          // hidden in the object list
                                    0);
                  
                  // --- HL master candles
                    if(master_high>=high && master_low<=low)
                      {
                        RectangleCreate(0,                             // chart's ID
                                        "TLR_MC_H1_Master_H1_HL"+tname,// rectangle name
                                        0,                             // subwindow index 
                                        t_Master_Start,                // first point time
                                        master_high,                   // first point price
                                        t_Master_End,                  // second point time
                                        master_low,                    // second point price
                                        Levels_H1_Dark_clr,            // rectangle color
                                        0,                             // style of rectangle lines
                                        0,                             // width of rectangle lines
                                        true,                          // filling rectangle with color
                                        false,                         // in the background
                                        false,                         // highlight to move
                                        true,                          // hidden in the object list
                                        0);
                      }
                }

              if(TLR_Button_MC_H1_Range_State==false)
                {
                  tname=NULL;
                  t_Start=0;
                  t_End=0;

                  high=0;
                  low=0;
                  // ...etc
                }
            }
Regards.
 

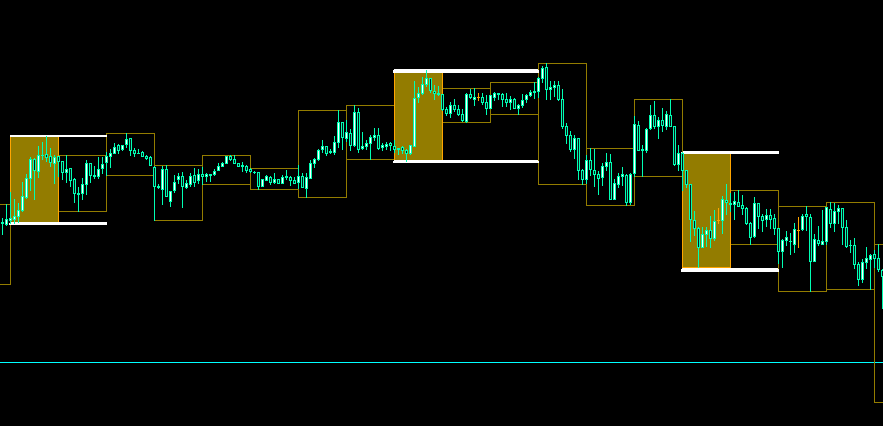
here is a picture of what I have now :
- (H1) ranges and master ranges are already calculated.
- the white trend lines are made by hand.

How can i draw the trend lines and stop drawing it when the price have broken the high OR the low ?

regards.


Reason: