//--- description
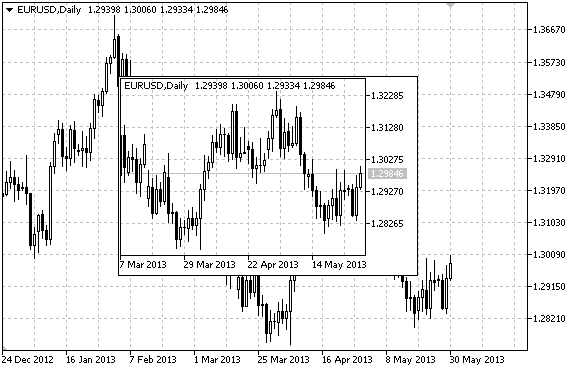
#property description "Script creates \"Chart\" object."
//--- display window of the input parameters during the script's launch
#property script_show_inputs
//--- input parameters of the script
input string InpName="Chart"; // Object name
input string InpSymbol="EURUSD"; // Symbol
input ENUM_TIMEFRAMES InpPeriod=PERIOD_H1; // Period
input ENUM_BASE_CORNER InpCorner=CORNER_LEFT_UPPER; // Anchoring corner
input int InpScale=2; // Scale
input bool InpDateScale=true; // Time scale display
input bool InpPriceScale=true; // Price scale display
input color InpColor=clrRed; // Border color when highlighted
input ENUM_LINE_STYLE InpStyle=STYLE_DASHDOTDOT; // Line style when highlighted
input int InpPointWidth=1; // Point size to move
input bool InpBack=false; // Background object
input bool InpSelection=true; // Highlight to move
input bool InpHidden=true; // Hidden in the object list
input long InpZOrder=0; // Priority for mouse click
//+------------------------------------------------------------------+
//| Creating Chart object |
//+------------------------------------------------------------------+
bool ObjectChartCreate(const long chart_ID=0, // chart's ID
const string name="Chart", // object name
const int sub_window=0, // subwindow index
const string symbol="EURUSD", // symbol
const ENUM_TIMEFRAMES period=PERIOD_H1, // period
const int x=0, // X coordinate
const int y=0, // Y coordinate
const int width=300, // width
const int height=200, // height
const ENUM_BASE_CORNER corner=CORNER_LEFT_UPPER, // anchoring corner
const int scale=2, // scale
const bool date_scale=true, // time scale display
const bool price_scale=true, // price scale display
const color clr=clrRed, // border color when highlighted
const ENUM_LINE_STYLE style=STYLE_SOLID, // line style when highlighted
const int point_width=1, // move point size
const bool back=false, // in the background
const bool selection=false, // highlight to move
const bool hidden=true, // hidden in the object list
const long z_order=0) // priority for mouse click
{
//--- reset the error value
ResetLastError();
//--- create Chart object
if(!ObjectCreate(chart_ID,name,OBJ_CHART,sub_window,0,0))
{
Print(__FUNCTION__,
": failed to create \"Chart\" object! Error code = ",GetLastError());
return(false);
}
//--- set object coordinates
ObjectSetInteger(chart_ID,name,OBJPROP_XDISTANCE,x);
ObjectSetInteger(chart_ID,name,OBJPROP_YDISTANCE,y);
//--- set object size
ObjectSetInteger(chart_ID,name,OBJPROP_XSIZE,width);
ObjectSetInteger(chart_ID,name,OBJPROP_YSIZE,height);
//--- set the chart's corner, relative to which point coordinates are defined
ObjectSetInteger(chart_ID,name,OBJPROP_CORNER,corner);
//--- set the symbol
ObjectSetString(chart_ID,name,OBJPROP_SYMBOL,symbol);
//--- set the period
ObjectSetInteger(chart_ID,name,OBJPROP_PERIOD,period);
//--- set the scale
ObjectSetInteger(chart_ID,name,OBJPROP_CHART_SCALE,scale);
//--- display (true) or hide (false) the time scale
ObjectSetInteger(chart_ID,name,OBJPROP_DATE_SCALE,date_scale);
//--- display (true) or hide (false) the price scale
ObjectSetInteger(chart_ID,name,OBJPROP_PRICE_SCALE,price_scale);
//--- set the border color when object highlighting mode is enabled
ObjectSetInteger(chart_ID,name,OBJPROP_COLOR,clr);
//--- set the border line style when object highlighting mode is enabled
ObjectSetInteger(chart_ID,name,OBJPROP_STYLE,style);
//--- set a size of the anchor point for moving an object
ObjectSetInteger(chart_ID,name,OBJPROP_WIDTH,point_width);
//--- display in the foreground (false) or background (true)
ObjectSetInteger(chart_ID,name,OBJPROP_BACK,back);
//--- enable (true) or disable (false) the mode of moving the label by mouse
ObjectSetInteger(chart_ID,name,OBJPROP_SELECTABLE,selection);
ObjectSetInteger(chart_ID,name,OBJPROP_SELECTED,selection);
//--- hide (true) or display (false) graphical object name in the object list
ObjectSetInteger(chart_ID,name,OBJPROP_HIDDEN,hidden);
//--- set the priority for receiving the event of a mouse click in the chart
ObjectSetInteger(chart_ID,name,OBJPROP_ZORDER,z_order);
//--- successful execution
return(true);
}
//+------------------------------------------------------------------+
//| Sets the symbol and time frame of the Chart object |
//+------------------------------------------------------------------+
bool ObjectChartSetSymbolAndPeriod(const long chart_ID=0, // chart's ID (not Chart object's one)
const string name="Chart", // object name
const string symbol="EURUSD", // symbol
const ENUM_TIMEFRAMES period=PERIOD_H1) // time frame
{
//--- reset the error value
ResetLastError();
//--- set Chart object's symbol and time frame
if(!ObjectSetString(chart_ID,name,OBJPROP_SYMBOL,symbol))
{
Print(__FUNCTION__,
": failed to set a symbol for \"Chart\" object! Error code = ",GetLastError());
return(false);
}
if(!ObjectSetInteger(chart_ID,name,OBJPROP_PERIOD,period))
{
Print(__FUNCTION__,
": failed to set a period for \"Chart\" object! Error code = ",GetLastError());
return(false);
}
//--- successful execution
return(true);
}
//+------------------------------------------------------------------+
//| Move Chart object |
//+------------------------------------------------------------------+
bool ObjectChartMove(const long chart_ID=0, // chart's ID (not Chart object's one)
const string name="Chart", // object name
const int x=0, // X coordinate
const int y=0) // Y coordinate
{
//--- reset the error value
ResetLastError();
//--- move the object
if(!ObjectSetInteger(chart_ID,name,OBJPROP_XDISTANCE,x))
{
Print(__FUNCTION__,
": failed to move X coordinate of \"Chart\" object! Error code = ",GetLastError());
return(false);
}
if(!ObjectSetInteger(chart_ID,name,OBJPROP_YDISTANCE,y))
{
Print(__FUNCTION__,
": failed to move Y coordinate of \"Chart\" object! Error code = ",GetLastError());
return(false);
}
//--- successful execution
return(true);
}
//+------------------------------------------------------------------+
//| Change Chart object size |
//+------------------------------------------------------------------+
bool ObjectChartChangeSize(const long chart_ID=0, // chart's ID (not Chart object's one)
const string name="Chart", // object name
const int width=300, // width
const int height=200) // height
{
//--- reset the error value
ResetLastError();
//--- change the object size
if(!ObjectSetInteger(chart_ID,name,OBJPROP_XSIZE,width))
{
Print(__FUNCTION__,
": failed to change the width of \"Chart\" object! Error code = ",GetLastError());
return(false);
}
if(!ObjectSetInteger(chart_ID,name,OBJPROP_YSIZE,height))
{
Print(__FUNCTION__,
": failed to change the height of \"Chart\" object! Error code = ",GetLastError());
return(false);
}
//--- successful execution
return(true);
}
//+------------------------------------------------------------------+
//| Return Chart object's ID |
//+------------------------------------------------------------------+
long ObjectChartGetID(const long chart_ID=0, // chart's ID (not Chart object's one)
const string name="Chart") // object name
{
//--- prepare the variable to get Chart object's ID
long id=-1;
//--- reset the error value
ResetLastError();
//--- get ID
if(!ObjectGetInteger(chart_ID,name,OBJPROP_CHART_ID,0,id))
{
Print(__FUNCTION__,
": failed to get \"Chart\" object's ID! Error code = ",GetLastError());
}
//--- return the result
return(id);
}
//+------------------------------------------------------------------+
//| Delete Chart object |
//+------------------------------------------------------------------+
bool ObjectChartDelete(const long chart_ID=0, // chart's ID (not Chart object's one)
const string name="Chart") // object name
{
//--- reset the error value
ResetLastError();
//--- delete the button
if(!ObjectDelete(chart_ID,name))
{
Print(__FUNCTION__,
": failed to delete \"Chart\" object! Error code = ",GetLastError());
return(false);
}
//--- successful execution
return(true);
}
//+------------------------------------------------------------------+
//| Script program start function |
//+------------------------------------------------------------------+
void OnStart()
{
//--- get the number of symbols in Market Watch
int symbols=SymbolsTotal(true);
//--- check if the symbol with a specified name is present in the symbol list
bool exist=false;
for(int i=0;i<symbols;i++)
if(InpSymbol==SymbolName(i,true))
{
exist=true;
break;
}
if(!exist)
{
Print("Error! ",InpSymbol," symbol is not present in \"Market Watch\"!");
return;
}
//--- check validity of input parameters
if(InpScale<0 || InpScale>5)
{
Print("Error! Incorrect values of input parameters!");
return;
}
//--- chart window size
long x_distance;
long y_distance;
//--- set window size
if(!ChartGetInteger(0,CHART_WIDTH_IN_PIXELS,0,x_distance))
{
Print("Failed to get the chart width! Error code = ",GetLastError());
return;
}
if(!ChartGetInteger(0,CHART_HEIGHT_IN_PIXELS,0,y_distance))
{
Print("Failed to get the chart height! Error code = ",GetLastError());
return;
}
//--- set Chart object coordinates and its size
int x=(int)x_distance/16;
int y=(int)y_distance/16;
int x_size=(int)x_distance*7/16;
int y_size=(int)y_distance*7/16;
//--- create Chart object
if(!ObjectChartCreate(0,InpName,0,InpSymbol,InpPeriod,x,y,x_size,y_size,InpCorner,InpScale,InpDateScale,
InpPriceScale,InpColor,InpStyle,InpPointWidth,InpBack,InpSelection,InpHidden,InpZOrder))
{
return;
}
//--- redraw the chart and wait for 1 second
ChartRedraw();
Sleep(1000);
//--- stretch Chart object
int steps=(int)MathMin(x_distance*7/16,y_distance*7/16);
for(int i=0;i<steps;i++)
{
//--- resize
x_size+=1;
y_size+=1;
if(!ObjectChartChangeSize(0,InpName,x_size,y_size))
return;
//--- check if the script's operation has been forcefully disabled
if(IsStopped())
return;
//--- redraw the chart and wait for 0.01 seconds
ChartRedraw();
Sleep(10);
}
//--- half a second of delay
Sleep(500);
//--- change chart's time frame
if(!ObjectChartSetSymbolAndPeriod(0,InpName,InpSymbol,PERIOD_M1))
return;
ChartRedraw();
//--- three seconds of delay
Sleep(3000);
//--- delete the object
ObjectChartDelete(0,InpName);
ChartRedraw();
//--- wait for 1 second
Sleep(1000);
//---
}
|