
Elevate Your Trading Accuracy with RSI Zone Master: A "Noise-Free" MT5 Indicator!

Do you frequently use the Relative Strength Index (RSI) indicator in your trading strategy? If so, you already know that the RSI is one of the most powerful momentum indicators in the trading world. However, the classic RSI has one major flaw: it often produces false signals (noise) due to erratic price movements.
These false signals often trap traders in the wrong positions. But don't worry, there is now a smart solution to this problem: RSI Zone Master.
What is RSI Zone Master?
RSI Zone Master is a revolutionary indicator for MetaTrader 5 (MT5) designed to take your RSI analysis to the professional level. This indicator combines the sharpness of the classic RSI with an advanced Moving Average Smoothing algorithm, producing a highly smooth and accurate momentum curve.
Not only that, this indicator transforms your RSI window into an intuitive visual canvas with its Dynamic Transparent Background Zones feature, allowing you to read market conditions in the blink of an eye. And the best part? You can download this indicator for FREE!
Key Features of RSI Zone Master
Why should you add this indicator to your trading toolkit? Here are some of its main features:
- Advanced Noise Reduction Equipped with built-in customizable smoothing options (SMA, EMA, SMMA, LWMA). This feature is highly effective at filtering out market "noise" and minimizing false signals.
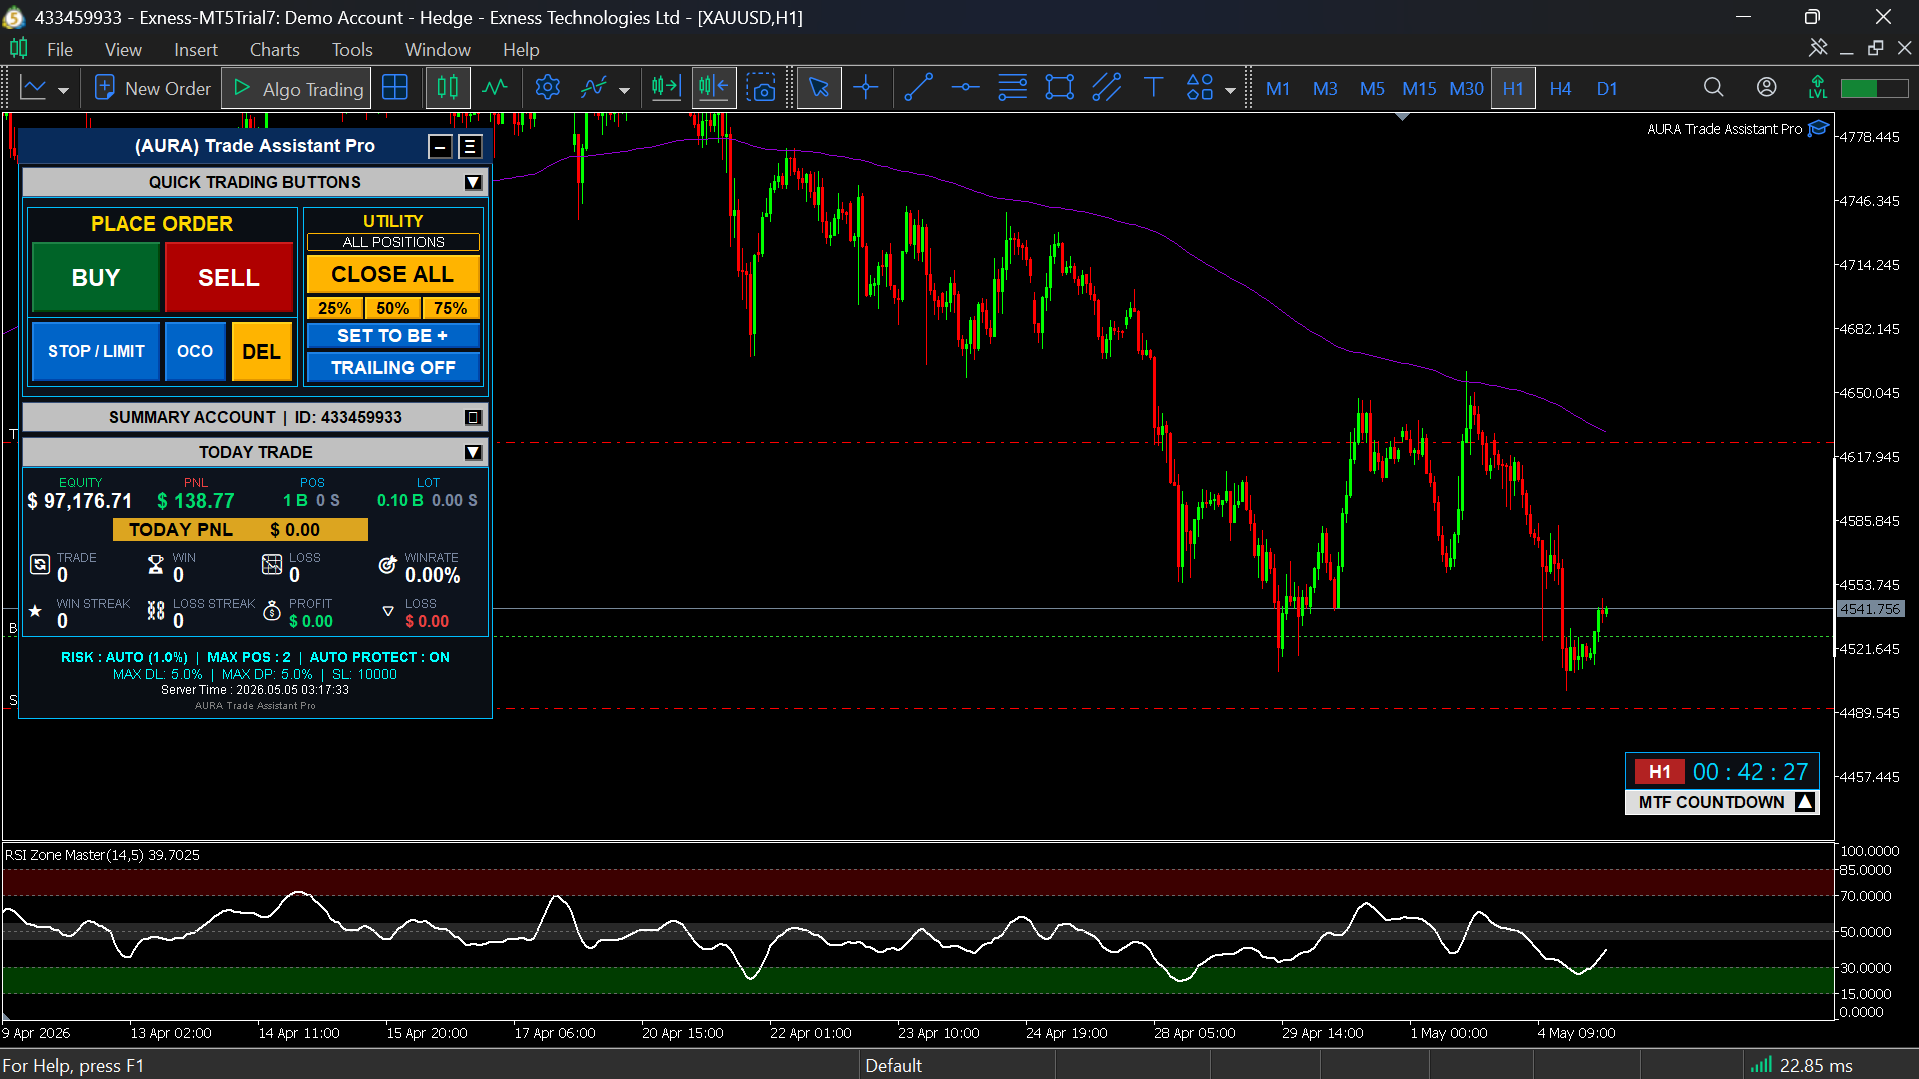
- Dynamic Visual Zones Displays 3 transparent color zones (Overbought, Neutral/Sideways, Oversold) rendered directly on the indicator's background. Reading market conditions can now be done in seconds.
- 100% Fully Customizable You are in full control. Adjust the RSI period, smoothing method, zone boundary levels, background colors, and opacity directly from the Input menu.
- Auto-Level Mapping The dotted horizontal lines (H-Lines) automatically synchronize with your custom zone inputs, keeping your chart display neat and highly precise.
- Highly Optimized & Lightweight Written with clean code and strict optimization standards. Zero memory leaks, prevents chart lagging, and is extremely CPU-friendly for your computer or VPS.
How to Trade Using RSI Zone Master
The color visualization on the RSI Zone Master makes decision-making much easier:
- 🔴 Red Zone (Overbought): When the RSI line enters the top zone, it indicates that bullish momentum is becoming exhausted. Get ready to look for a SELL setup confirmation.
- 🟢 Green Zone (Oversold): When the RSI line enters the bottom zone, bearish pressure is easing. This is the right time to get ready to look for a BUY setup confirmation.
- ⚪ White Zone (Neutral/Sideways): If the line is traversing the middle area, the market is consolidating or lacks a clear trend. The best strategy in this area is to WAIT & SEE.
Conclusion: Upgrade Your Momentum Visualization Today!
Stop second-guessing your chart directions. With clean, clear, and professional momentum visualization from RSI Zone Master, you can significantly improve your trading accuracy.
This indicator is the perfect addition to price action strategies as well as other indicator-based trading systems.
👉 Click Here to Download RSI Zone Master for FREE on MQL5!
Looking to further increase your trading efficiency? Don't forget to visit Roby Hidayat's profile on MQL5 to discover various other high-quality free indicators, as well as an EA Trading Assistant ready to help automate your risk and lot management!
Don't stop at just momentum analysis. Complete your daily trading arsenal with our other premium-grade tools:
- AURA Trading Panel Dashboard : Manage your trades like a pro! This all-in-one execution and risk management tool allows you to calculate lots automatically, execute trades seamlessly, and manage open positions with a single click.
- MTF Countdown : Never miss a crucial market moment. Stay perfectly timed with this highly accurate Multiple Time Frame indicator that tracks candle closing times across your favorite chart periods simultaneously.


 & AMD Framework")
")