
Break Tracer Indicator: Non-Repainting EMA Cross and Trend Channel System for MetaTrader 4 and 5

Introduction
Trend systems built on moving-average crossovers fail in the same way again and again -- they fire entries during sideways grind, give them back on the next bar, and produce visual noise that no trader can confidently act on. The fix is not to abandon EMA crossovers; it is to constrain them with structural context. Where is price relative to a slower trend reference? Is the market consolidating inside a volatility envelope, or has it broken out? Is the EMA stack rising or falling on a higher timeframe? Each of these questions adds a filter that converts a raw crossover into a genuine signal.
Break Tracer Indicator combines three of the most reliable trend tools into a single non-repainting system: a fast EMA pair (26 / 50), a long-period trend MA (200) with optional higher-timeframe support, and an ATR-based channel that acts as a regime gate. A signal fires only when all three components agree, and every signal that prints on the chart is permanent -- the indicator evaluates state on closed bars and never modifies historical markers.
The indicator is available for both MetaTrader 4 and MetaTrader 5 with mechanically identical logic and visual output. It includes a 4-channel alert package (popup, email, push, sound), an optional stop-loss tracker that draws a level on the chart and detects when price hits it, an optional Golden Cross / Death Cross overlay, and a date-range period filter for traders who only want signals during specific market sessions.
Download the indicator:
- MetaTrader 5: Break Tracer MT5
- MetaTrader 4: Break Tracer MT4
This article walks through each component of the indicator, explains the non-repainting architecture, documents every input parameter, and shows the indicator running across multiple instruments and timeframes.
The Three-Layer Architecture
A trend signal carries weight in proportion to the number of independent confirmations it satisfies. Break Tracer Indicator stacks three layers, each measuring a different aspect of market structure:
Layer 1 -- EMA Cross (fast). Two exponential moving averages on the close: a fast EMA of period 26 and a medium EMA of period 50. The relationship between them defines the short-term momentum direction. When the fast EMA is above the medium EMA, momentum is bullish; when below, momentum is bearish. The cross alone is too noisy to trade, but it provides the immediate entry trigger inside a properly filtered system.
Layer 2 -- MA Trend (slow). A 200-period moving average that defines the dominant trend. The user selects between EMA and SMA modes (default: SMA), and can optionally pull the trend MA from a higher timeframe to anchor signals to the daily or 4-hour view while trading on a lower chart. This reference is what every entry is measured against -- a buy signal is only accepted when the close sits above the trend MA, and a sell signal requires price below it.
Layer 3 -- ATR Channel. A volatility envelope drawn at the trend MA plus and minus an ATR multiple (default: ATR(200) x 0.618). When the bar overlaps this envelope, the market is considered to be ranging -- no trend signal can fire. This is the quiet zone that filters out the false breakouts that destroy MA-cross systems during consolidation. The bar must close outside the channel, on the correct side relative to the trend MA, before a directional signal becomes possible.
A breakout from the channel that aligns with both the EMA stack and the trend MA generates a directional regime: bull (trend = +1), bear (trend = -1), or range (trend = 0). The state machine then converts this regime into entry, exit, and stop-loss events, which are drawn on the chart and pushed through the alert system.
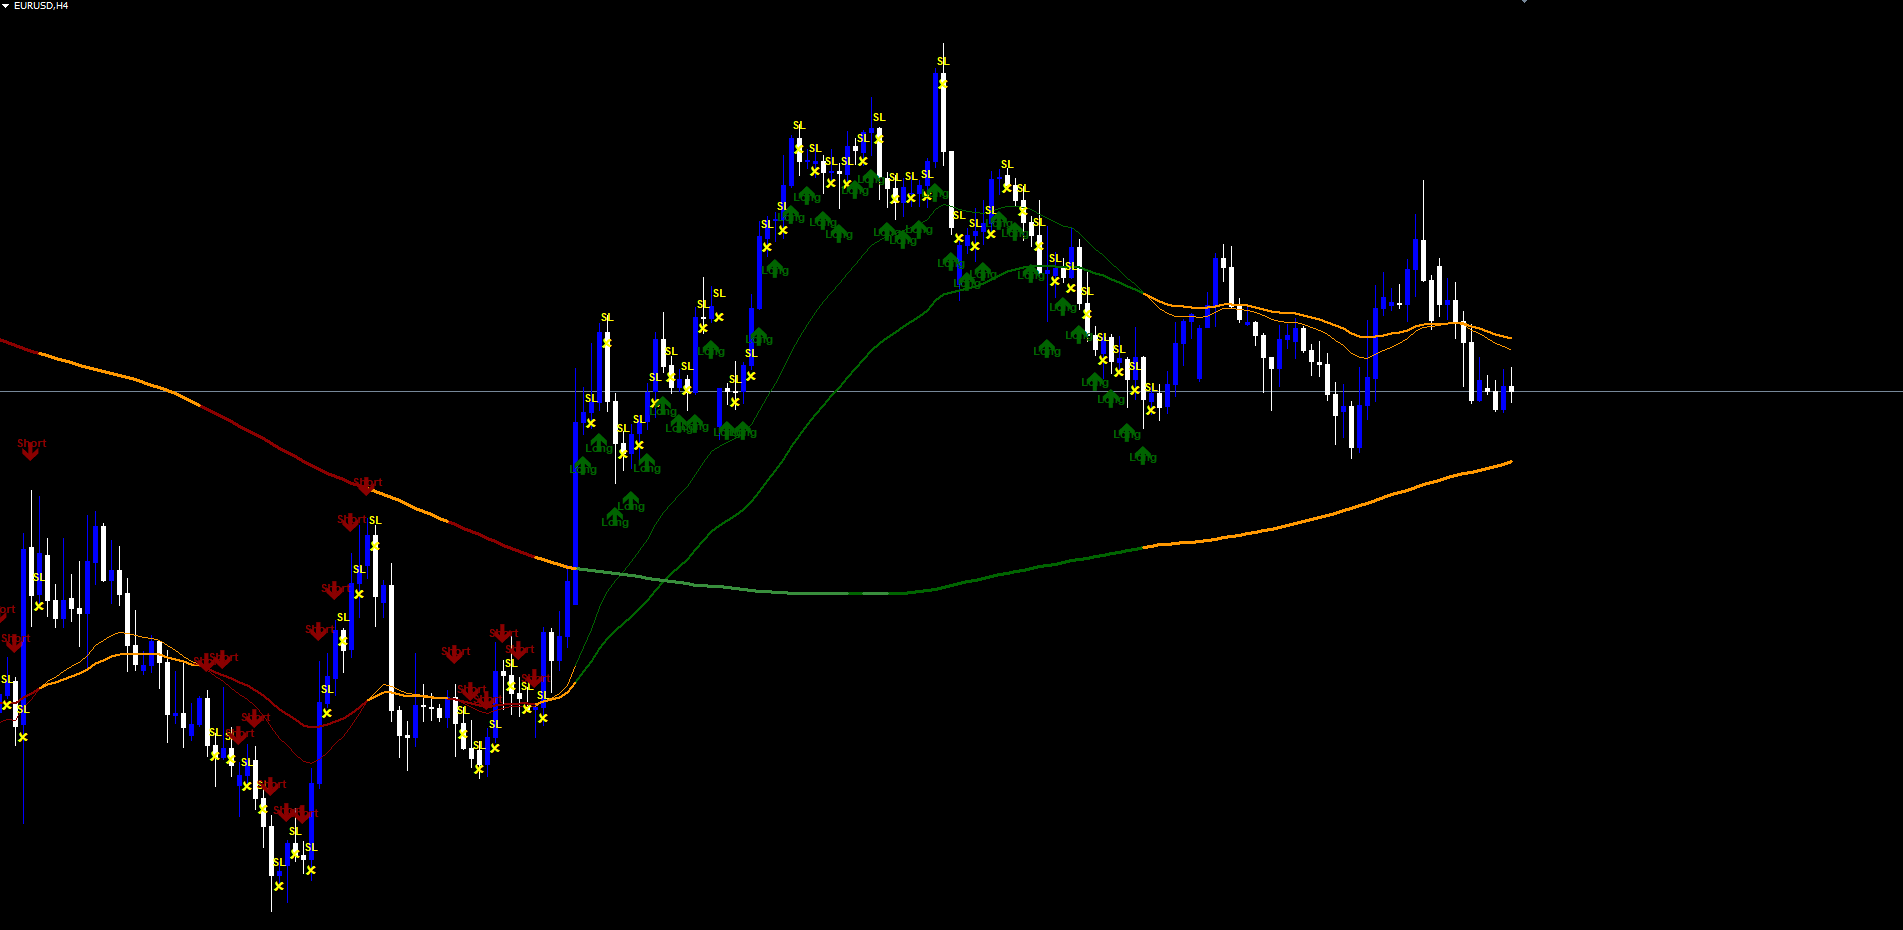
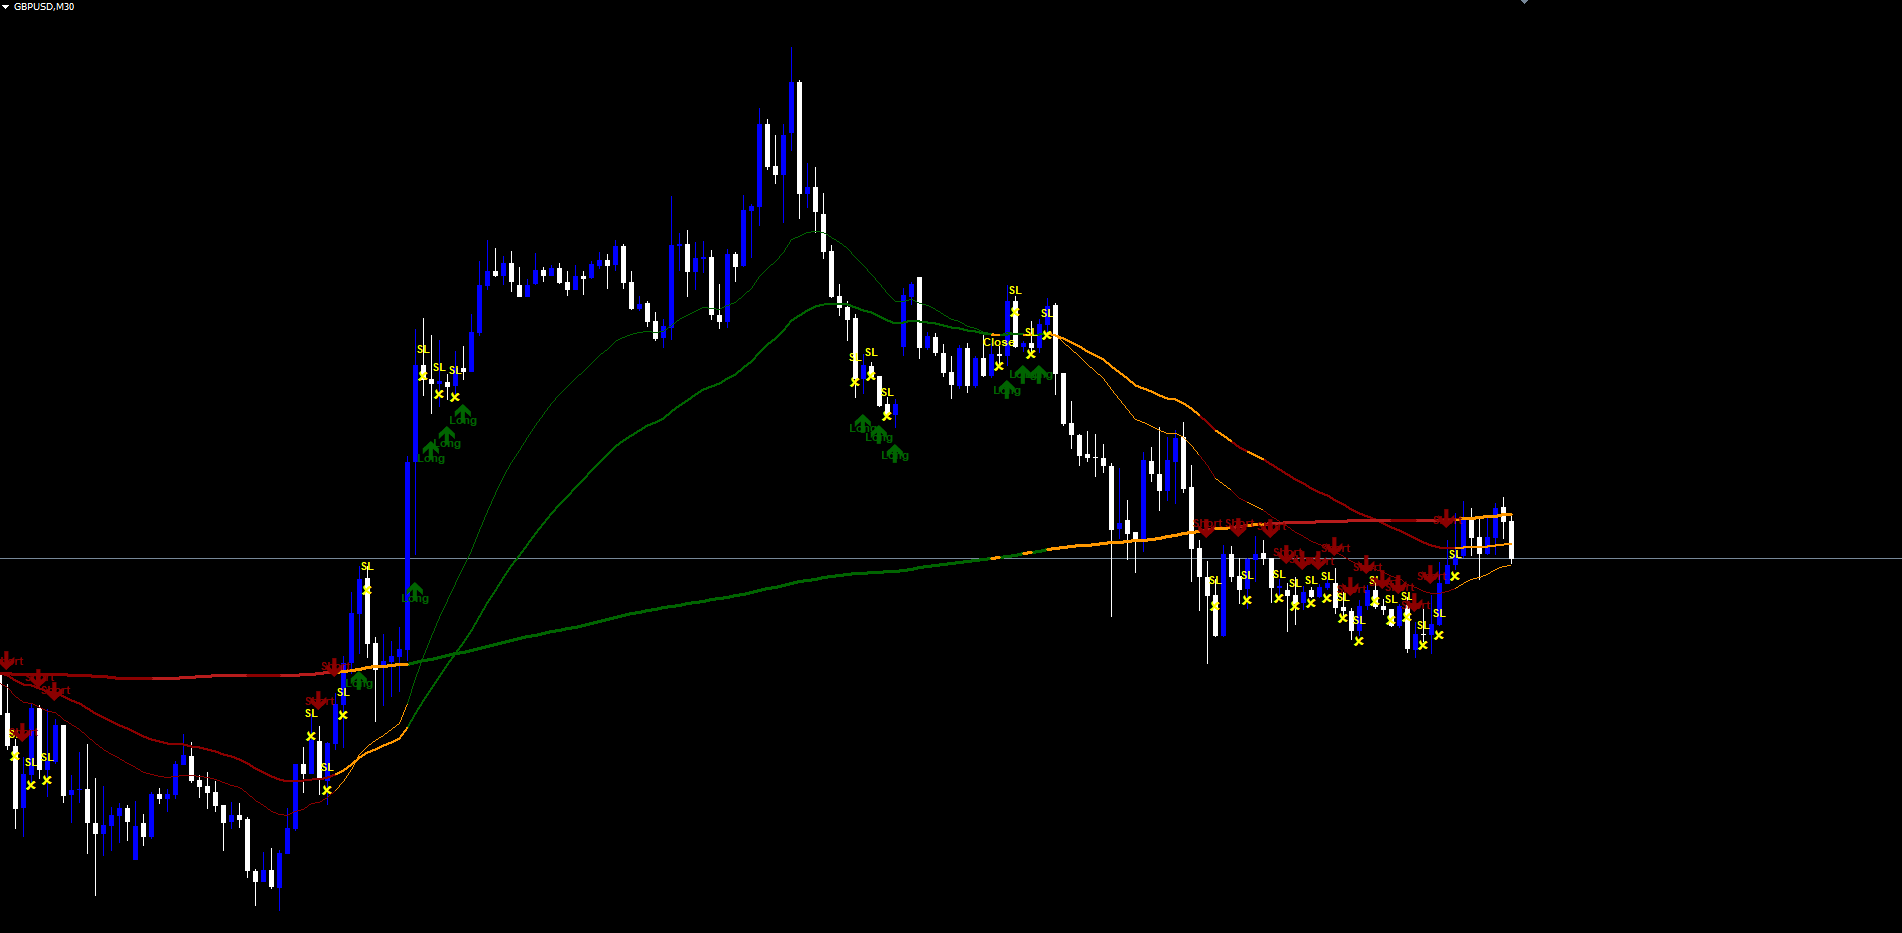
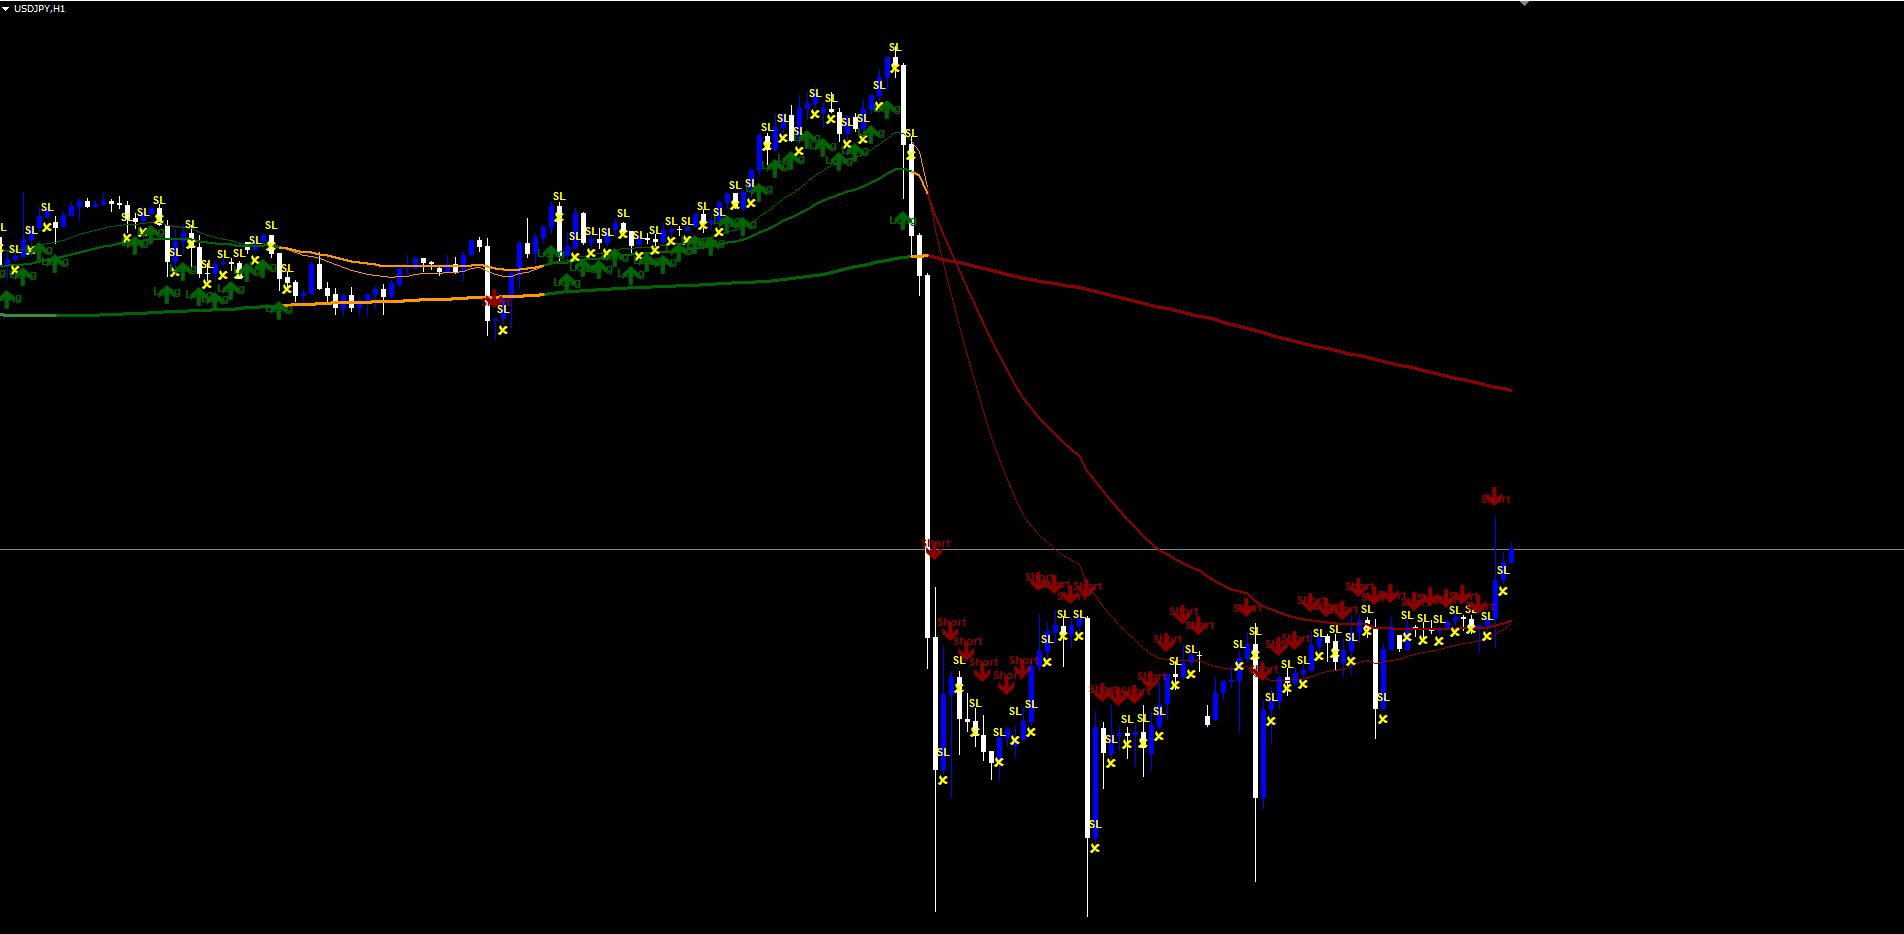
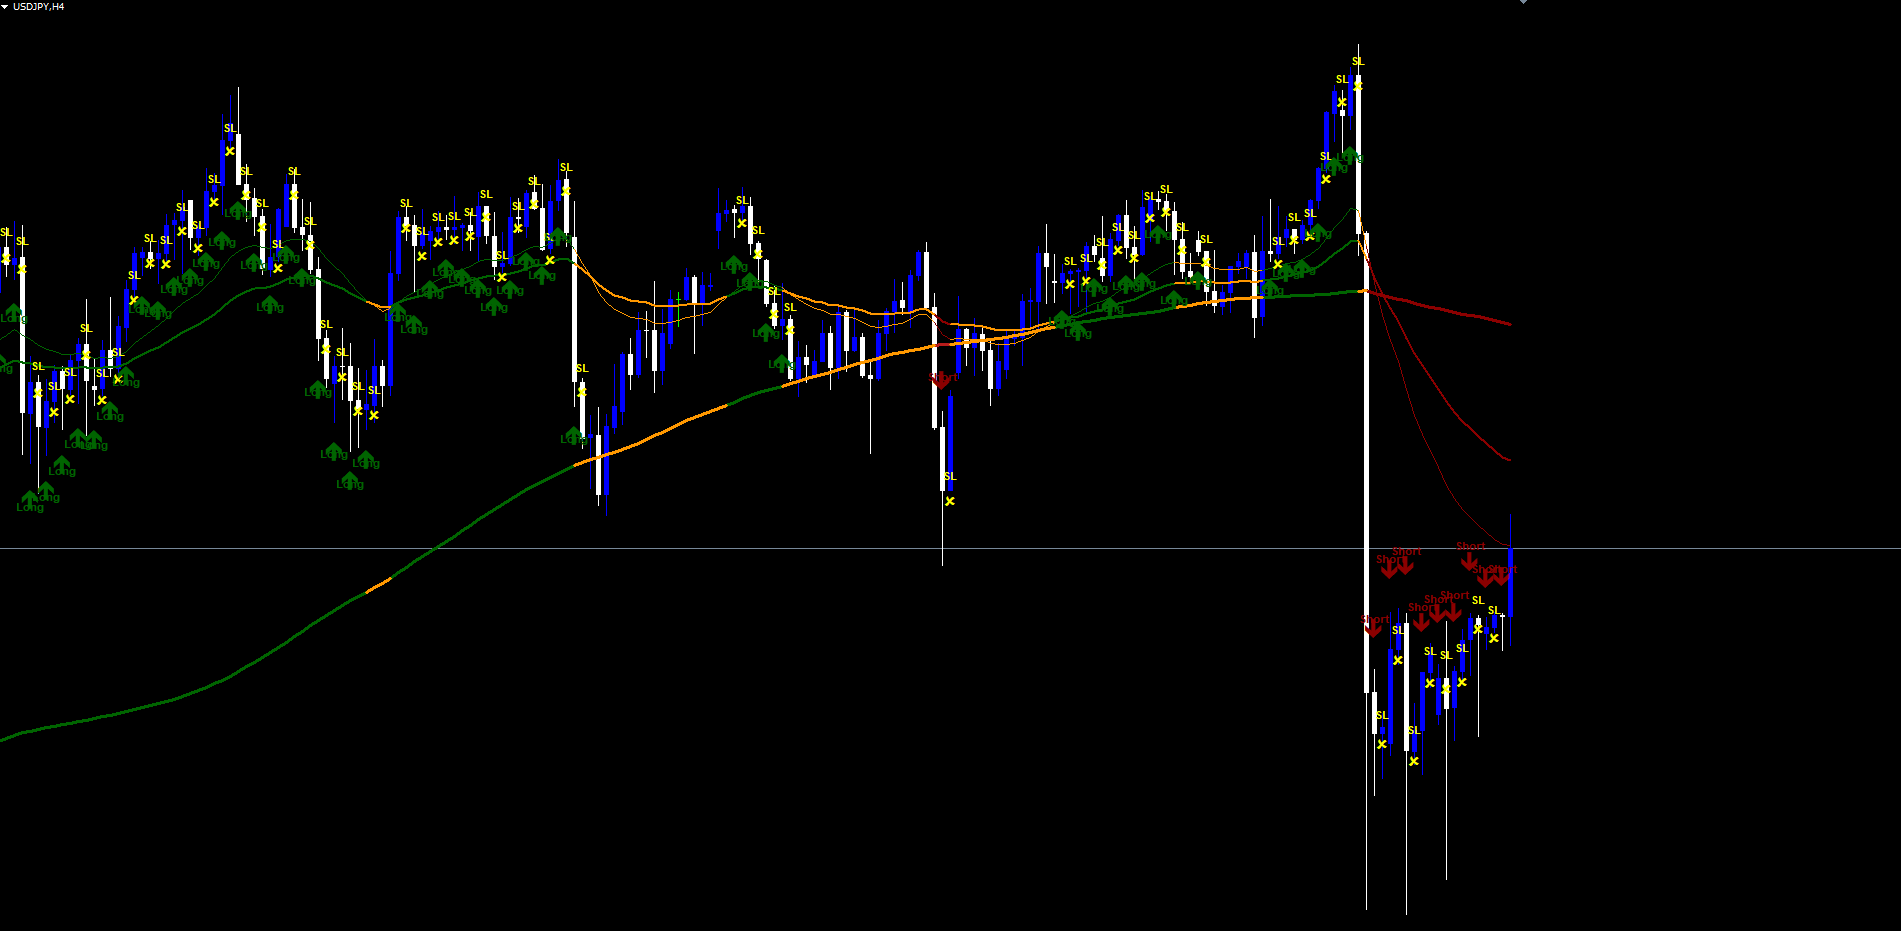
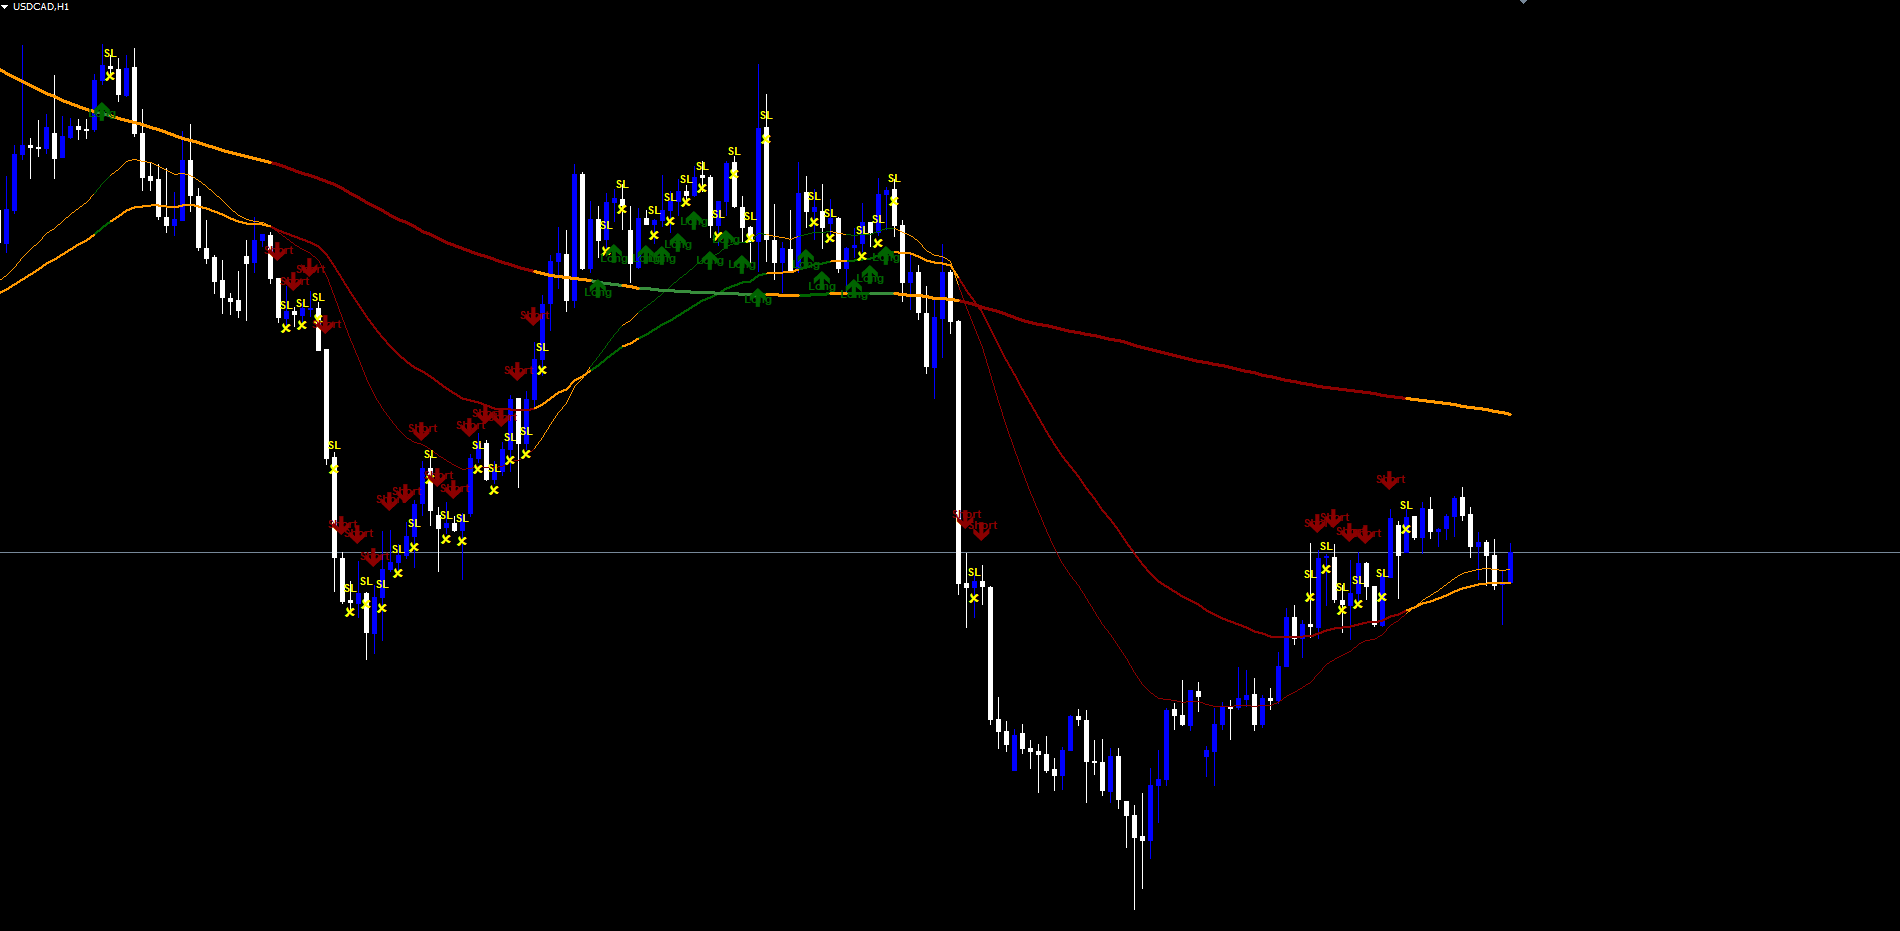
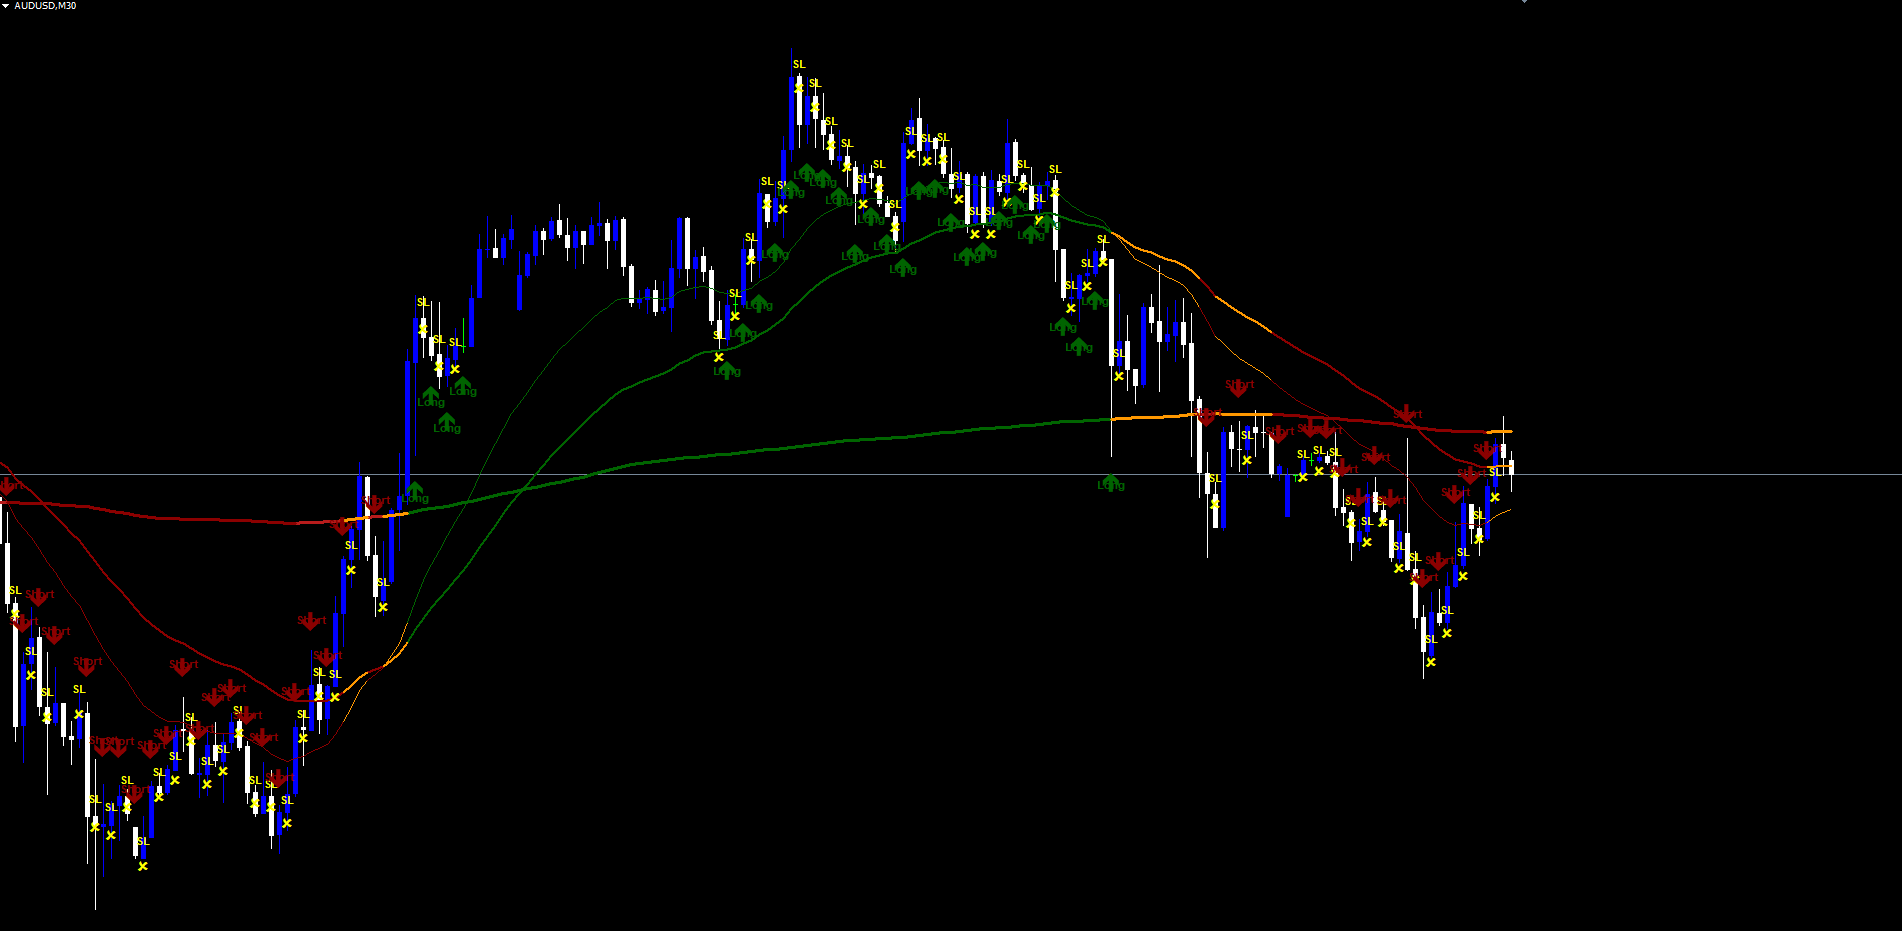
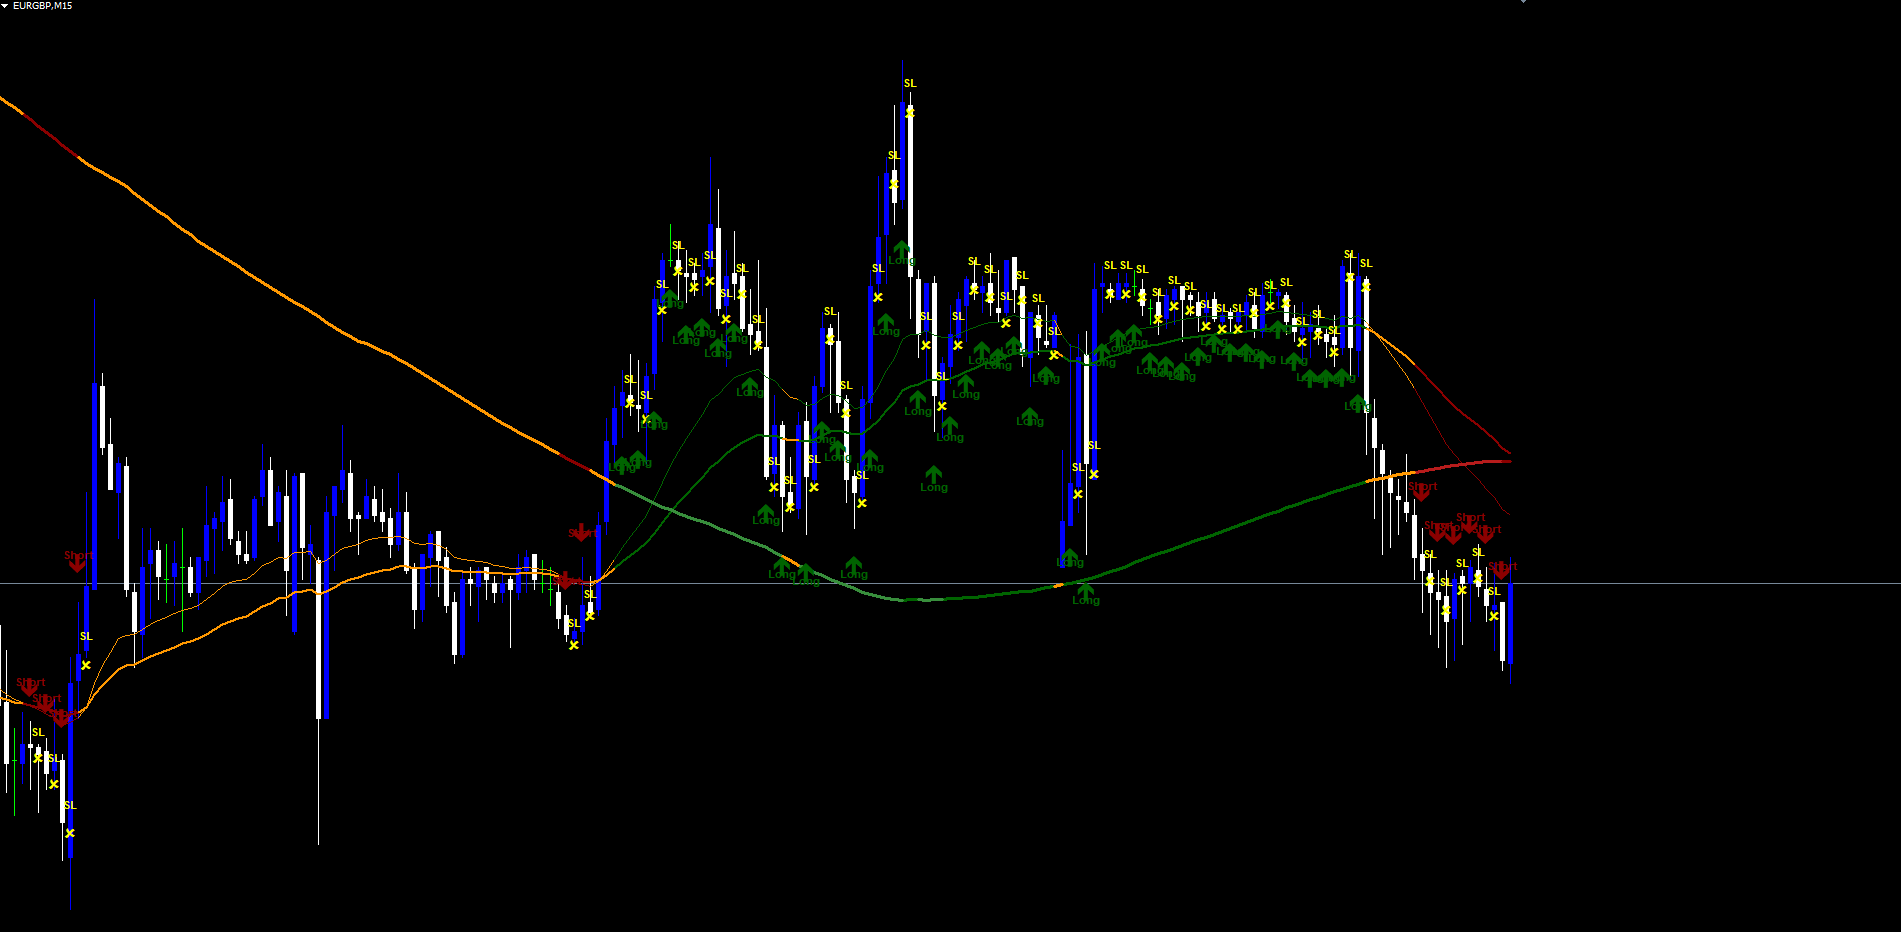
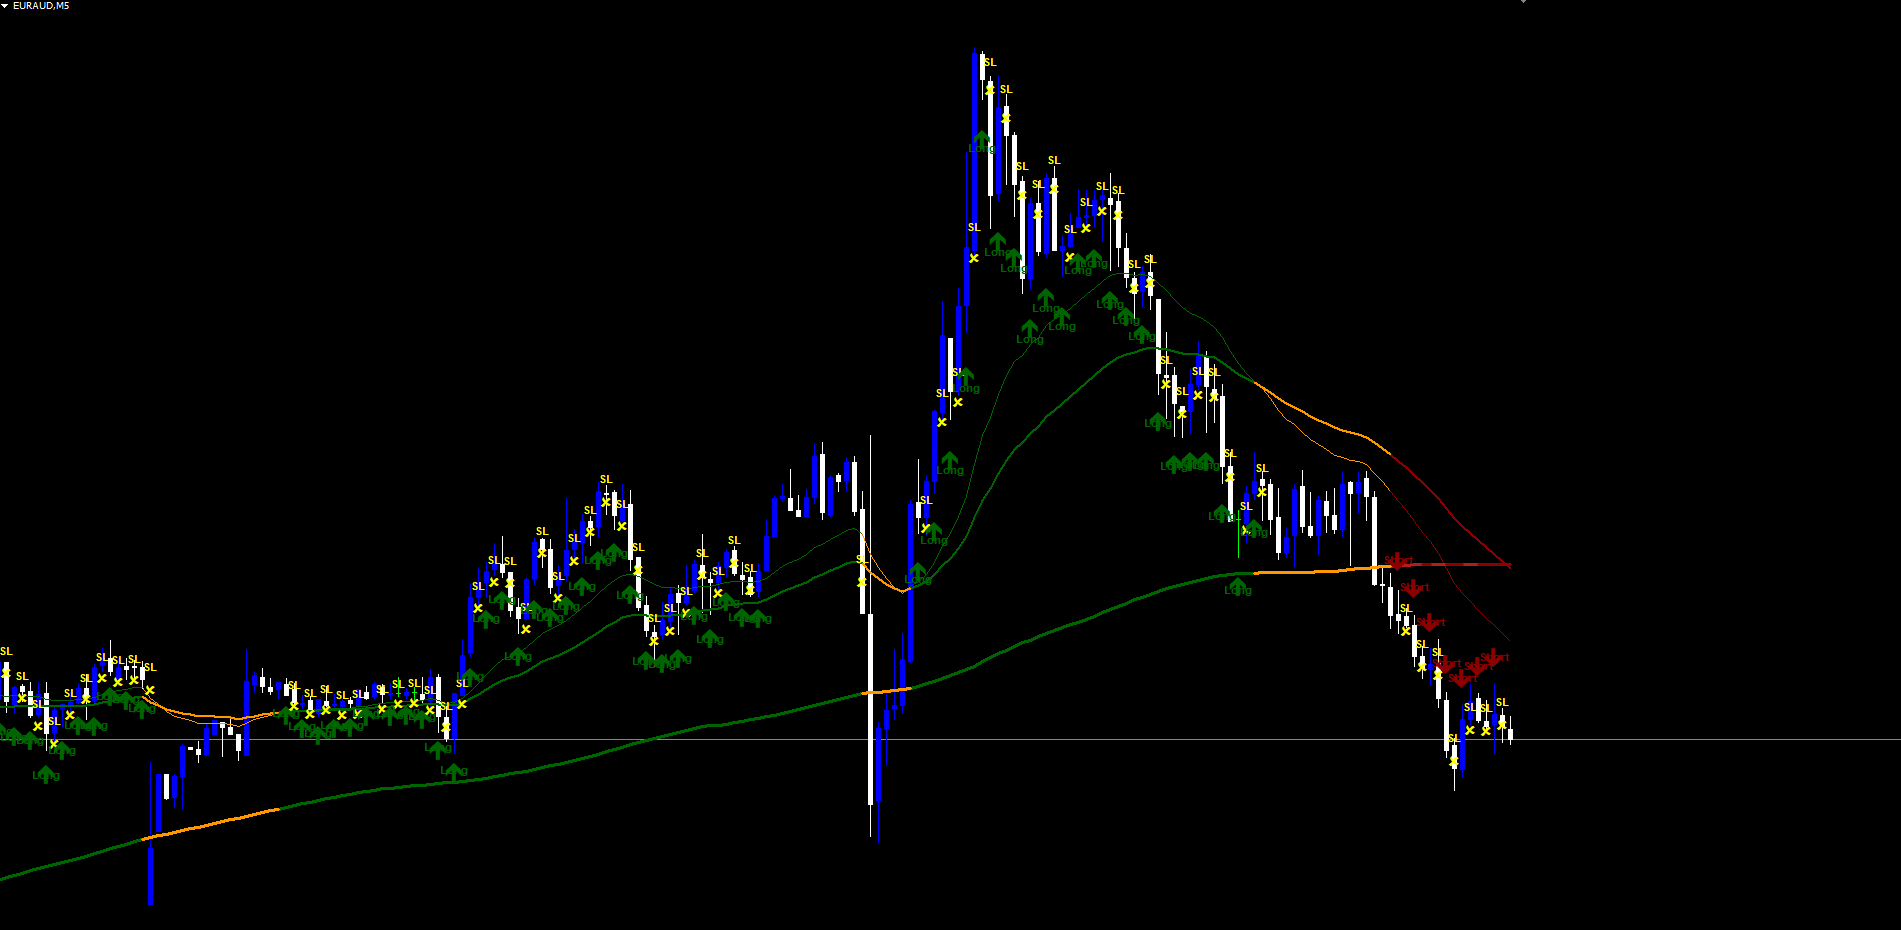
The visual ribbon on the chart encodes the trend state in five colour bands: dark green (rising bull trend), light green (flat or pulling back inside bull), orange (range / consolidation), light red (flat or pulling back inside bear), dark red (falling bear trend). The user can read the regime at a glance from the colour of the trend MA without reading numerical values.
Non-Repainting Architecture
Repainting is the silent killer of indicator credibility. An indicator that evaluates conditions on the live forming bar can show a signal, then erase it when the bar closes at a different price. Backtest charts look perfect because every "wrong" signal was silently removed before the historical screenshot was taken. In real-time trading, signals appear and disappear during the bar's formation, leaving the trader with nothing actionable.
Break Tracer Indicator eliminates repainting by enforcing two strict rules:
Rule 1 -- Closed-bar evaluation. The state machine that decides entries, exits, and stop-loss hits operates on closed bars only. The current forming bar is computed for completeness, but no signal label or alert is emitted for it. A "Long" arrow appears only after the bar that triggered it has closed.
Rule 2 -- Non-leaking higher timeframe. When the trend MA is pulled from a higher timeframe, the indicator references the value of that MA from one HTF bar back. This guarantees the value is from a fully closed HTF bar at the moment of evaluation, rather than the live HTF bar which would change as that bar evolves. Pine Script users will recognise this as the equivalent of request.security(..., expr[1], lookahead = barmerge.lookahead_on) -- the standard non-repaint pattern. No future information leaks into past bars.
These rules together mean that the indicator's historical chart is exactly what a trader would have seen in real time. There are no hidden lookaheads, no signals that disappear, no "hindsight perfect" entries.
The cost of non-repainting integrity is a one-bar entry delay. The bar that triggers a signal must close before the signal appears, so the trader enters at the open of the bar that follows the trigger. This is the trade-off serious traders universally prefer over a chart that lies about its own history.
Strategy 1 vs Strategy 2
The indicator offers two modes that differ in how strict the entry filter is:
Strategy 2 (default) -- Direction. A long signal requires three conditions: (1) the bar closes outside the channel on the upper side, (2) the close is above the trend MA, and (3) the fast EMA is above the medium EMA. Symmetrically for short. This is the cleaner mode and produces the trend regimes most traders will recognise from the chart.
Strategy 1 -- Cross. Adds a constraint: the medium EMA must be on the same side of the trend MA as the closing bar. In a bull setup, this means the trend MA must already be below the medium EMA before the long signal can fire. The effect is to delay entries until the EMA structure has fully aligned with the trend MA. Fewer signals, later entries, but each one occurs in a more developed trend. Useful for traders who want to avoid the early phase of a regime change.
Most users start with Strategy 2 and stay there. Strategy 1 is provided as an alternative for those who prefer slower, more structurally complete entries.
The Stop-Loss State Machine
A trend system is only as useful as its exit rules. Break Tracer Indicator includes an optional stop-loss line that is calculated at the moment of entry and tracked across the life of the trade.
When a long entry fires, the stop-loss price is set to Close - (Close x SL%) where SL% is the user-configured percentage (default: 2.618%). The level appears as a red line that extends forward across subsequent bars. The same logic applies in reverse for shorts: Close + (Close x SL%) .
The state machine then watches for two stop-out conditions:
- Cross-under (long) / cross-over (short). Price closes through the stop-loss line on the wrong side. For a long, this means the close drops below the line; for a short, the close rises above.
- Bar engulf. The stop-loss line is contained between the bar's high and low (the bar's range fully encloses the level). This catches stop-outs that occur during the bar without requiring a closing cross.
When either condition triggers, the indicator marks the bar with a yellow "SL" label, fires the appropriate stop-loss alert, and resets the trade state to neutral. The next signal can then enter a fresh long or short. If neither condition triggers and the trend regime simply changes (for example, the channel reasserts itself or the EMA stack flips), the indicator marks the bar with a yellow "Close" X and exits the trade without taking the stop loss.
The stop-loss display is off by default to keep charts uncluttered, but enabling it ( Stop Loss Plot On = true ) is recommended for traders who want explicit risk management on every trade.
Higher-Timeframe Anchor
Many traders prefer to take signals on a lower timeframe but only when those signals align with the daily or 4-hour trend. Break Tracer Indicator supports this with an optional higher-timeframe input for the trend MA.
Setting Higher Timeframe to current (default) means the trend MA uses the chart's own period -- a 200-period MA on a 1-hour chart spans approximately 8 trading days. Setting it to H4 while trading on M15 means the same chart will display M15 bars and EMA crosses, but the trend MA and channel are calculated from H4 closes. The non-repaint mechanism uses the previous closed H4 bar's MA, so the trend reference updates only when an H4 bar closes -- not on every M15 tick.
This pattern is widely used in multi-timeframe trend systems: trade the entry timeframe, but accept entries only in the direction of the higher-timeframe trend. The indicator handles the timeframe synchronisation transparently. From the trader's perspective, only the input parameter changes; the chart still updates on every M15 bar, but trend changes happen at H4 cadence.
Choose the HTF based on the signal-to-noise ratio you want. A 4x to 6x ratio between entry and trend timeframes is a common starting point: M15 entry with H1 trend, M30 entry with H4 trend, H1 entry with H4 trend, or H4 entry with D1 trend. Higher ratios produce fewer but more aligned signals.
The Channel Range Filter
The ATR channel is what makes the indicator selective. Drawn as a band of plus and minus ATR(200) x 0.618 around the trend MA, the channel defines the volatility envelope the market is currently respecting. A bar that overlaps this envelope -- where either the open or close lands inside the band -- is treated as ranging, and no directional signal can fire.
The 0.618 multiplier is the Fibonacci ratio that has been observed empirically to capture roughly two-thirds of normal trading-range bars while excluding most of the breakout bars. Increasing the multiplier to 1.0 or higher widens the channel and makes the indicator more selective (fewer signals, larger expected moves). Decreasing it to 0.5 or 0.382 narrows the channel and produces more signals at the cost of more in-range entries.
The channel can be displayed on the chart by setting Show Channel = true . By default the channel is hidden, since the trend-MA ribbon and EMA fill already convey the regime information visually. Traders who want to see the explicit volatility envelope can turn it on; the channel is drawn as a coloured fill that takes the trend colour (green when bull, red when bear, orange when range) and matches the trend MA's tint.
Signal Lifecycle on the Chart
Each trade produces up to three visible markers across its lifecycle:
Long entry. A green up-arrow (Wingdings 233) appears below the bar that triggered the signal, with a "Long" text label below the arrow. The arrow is anchored to the low minus a small ATR-based offset so it stays close to price without obscuring the bar.
Short entry. A red down-arrow (Wingdings 234) appears above the bar with a "Short" text label above the arrow. Anchored to the high plus the same ATR-based offset.
Exit by signal change. When the trend regime flips or the EMA stack reverses while a trade is open, the indicator places a yellow X (Wingdings 251) at the close of the exit bar with a "Close" text label. This represents an orderly exit driven by the trend system itself, not by a stop-loss hit.
Exit by stop loss. When the stop-loss line is touched or crossed, the indicator places a yellow X at the stop-loss price level with an "SL" text label. The stop-loss line itself stops being drawn from that bar forward, since the trade is now closed.
Optional Golden / Death Cross. Independent of the main trend system, the indicator can display the classic 50-vs-200 cross: a Golden Cross when the medium EMA crosses above the trend MA, and a Death Cross when it crosses below. These are drawn as orange labelled markers and serve as a slow secondary signal that some traders use for swing or position trades. Disabled by default.
All chart objects use the prefix BTI_ and are removed automatically when the indicator is detached from the chart.
The Period Filter
For traders who only want signals during specific date ranges -- for example, to backtest a window of historical data, or to avoid signals during known low-liquidity periods -- the indicator includes a period filter.
Setting Period Filter On = true activates two date inputs: Start and End . The state machine then evaluates entries only on bars whose timestamp falls inside this range. Bars outside the range are skipped: no entry signals fire, and any trade that was open at the start of an excluded bar simply waits for the next in-range bar.
This is most commonly used during walk-forward analysis or for traders with strict session rules. For everyday trading, leave the period filter off (the default) so signals are evaluated continuously.
The Alert Package
Six distinct events can fire alerts:
| Event | Trigger condition |
|---|---|
| BUY | A new long entry fires |
| SELL | A new short entry fires |
| BUY-CLOSE | An open long is closed by a signal change (orderly exit) |
| SELL-CLOSE | An open short is closed by a signal change |
| STOP-LOSS-LONG | An open long is stopped out |
| STOP-LOSS-SHORT | An open short is stopped out |
| GOLDEN-CROSS | EMA medium crosses above trend MA (if enabled) |
| DEATH-CROSS | EMA medium crosses below trend MA (if enabled) |
Each alert is built into a single message that includes the symbol, timeframe, and event identifier, for example: Break Tracer - EURGBP M15: SELL . When multiple events occur on the same bar (rare but possible), they are concatenated into one alert.
Four delivery channels are independently togglable:
| Channel | Default | Parameter |
|---|---|---|
| Popup dialog | Enabled | Popup Alerts |
| Disabled | Email Alerts | |
| Push notification | Disabled | Push Notifications |
| Sound (alert.wav) | Disabled | Sound Alert |
Email and push notifications require the trader to configure SMTP and MetaQuotes ID in MetaTrader's Options dialog (Tools > Options > Email / Notifications). Once configured, enabling the corresponding indicator input is sufficient.
Alerts fire only on bar close and only once per bar. The bar that triggered the signal will not produce duplicate alerts even if multiple ticks arrive after close. This prevents the alert spam that plagues less carefully designed indicators.
Practical Workflow
A repeatable process produces consistent results regardless of which instrument or timeframe is being traded.
Step 1 -- Attach the indicator. Drag Break Tracer Indicator onto any chart. The defaults are designed to work on most pairs without modification. Start with a 1-hour or 4-hour chart for clearly defined trend regimes.
Step 2 -- Verify the regime. Look at the trend-MA ribbon. Is it dark green (rising bull), light green (flat bull), orange (range), light red (flat bear), or dark red (falling bear)? The two trend states (bull / bear) are tradable; the range state is not. If the chart is in range mode, no entry signal will fire until price breaks out of the channel.
Step 3 -- Wait for the entry signal. Do not anticipate. Wait for a bar to close with a green up-arrow + "Long" label or red down-arrow + "Short" label. This is the moment the trend system has confirmed all three layers (channel breakout + trend MA alignment + EMA stack alignment).
Step 4 -- Enter on the next bar's open. The signal applies to the bar that just closed. The trade is taken at the open of the next bar. This one-bar lag is the cost of non-repainting integrity.
Step 5 -- Manage with the stop-loss line. If the stop-loss display is enabled, the red line shows where the trade will be stopped out. If the line is touched, the indicator marks the bar with a yellow SL and fires the stop-loss alert. If the trend regime changes before the stop is hit, the indicator marks an exit-by-signal-change with a yellow Close X.
Step 6 -- Wait for the next signal. After an exit (whether SL or Close), the trade state resets. The next directional signal in either direction can produce a new entry.
For traders managing multiple charts, the alert package allows monitoring without watching each chart continuously. Push notifications to mobile are particularly useful for swing traders; email is preferred for end-of-day review.
Timeframe Selection
The indicator runs on any timeframe but produces different signal characteristics across the timeframe spectrum.
M5 - M15 (scalping). Pivots and crosses occur frequently, producing many signals per session. The 200-period trend MA on M5 covers approximately 16 hours -- short by daily-trader standards but long enough to identify intraday trend bias. Best used with HTF set to H1 or H4 to anchor signals to a slower reference.
M30 - H1 (swing). The most balanced range. Trend regimes span days, and signals are spaced enough to allow proper trade management without producing whipsaw clusters. Default settings work well; the HTF input can be left on current or pushed to H4 for a higher-timeframe anchor.
H4 - D1 (position). Each signal carries significant weight. Trend regimes span weeks. Signals are infrequent. Stop-loss percentage may need to be increased (try 4% or 5%) to accommodate the larger swings on these timeframes.
The indicator's defaults are tuned for the M30-H1 swing range. For other timeframes, the main parameters to adjust are MA Trend Length (consider 100 instead of 200 for faster trend reference on lower timeframes), Channel Range Length (0.5 - 1.0 range, depending on instrument volatility), and SL % (2-3% on H1, 4-5% on H4 and higher).
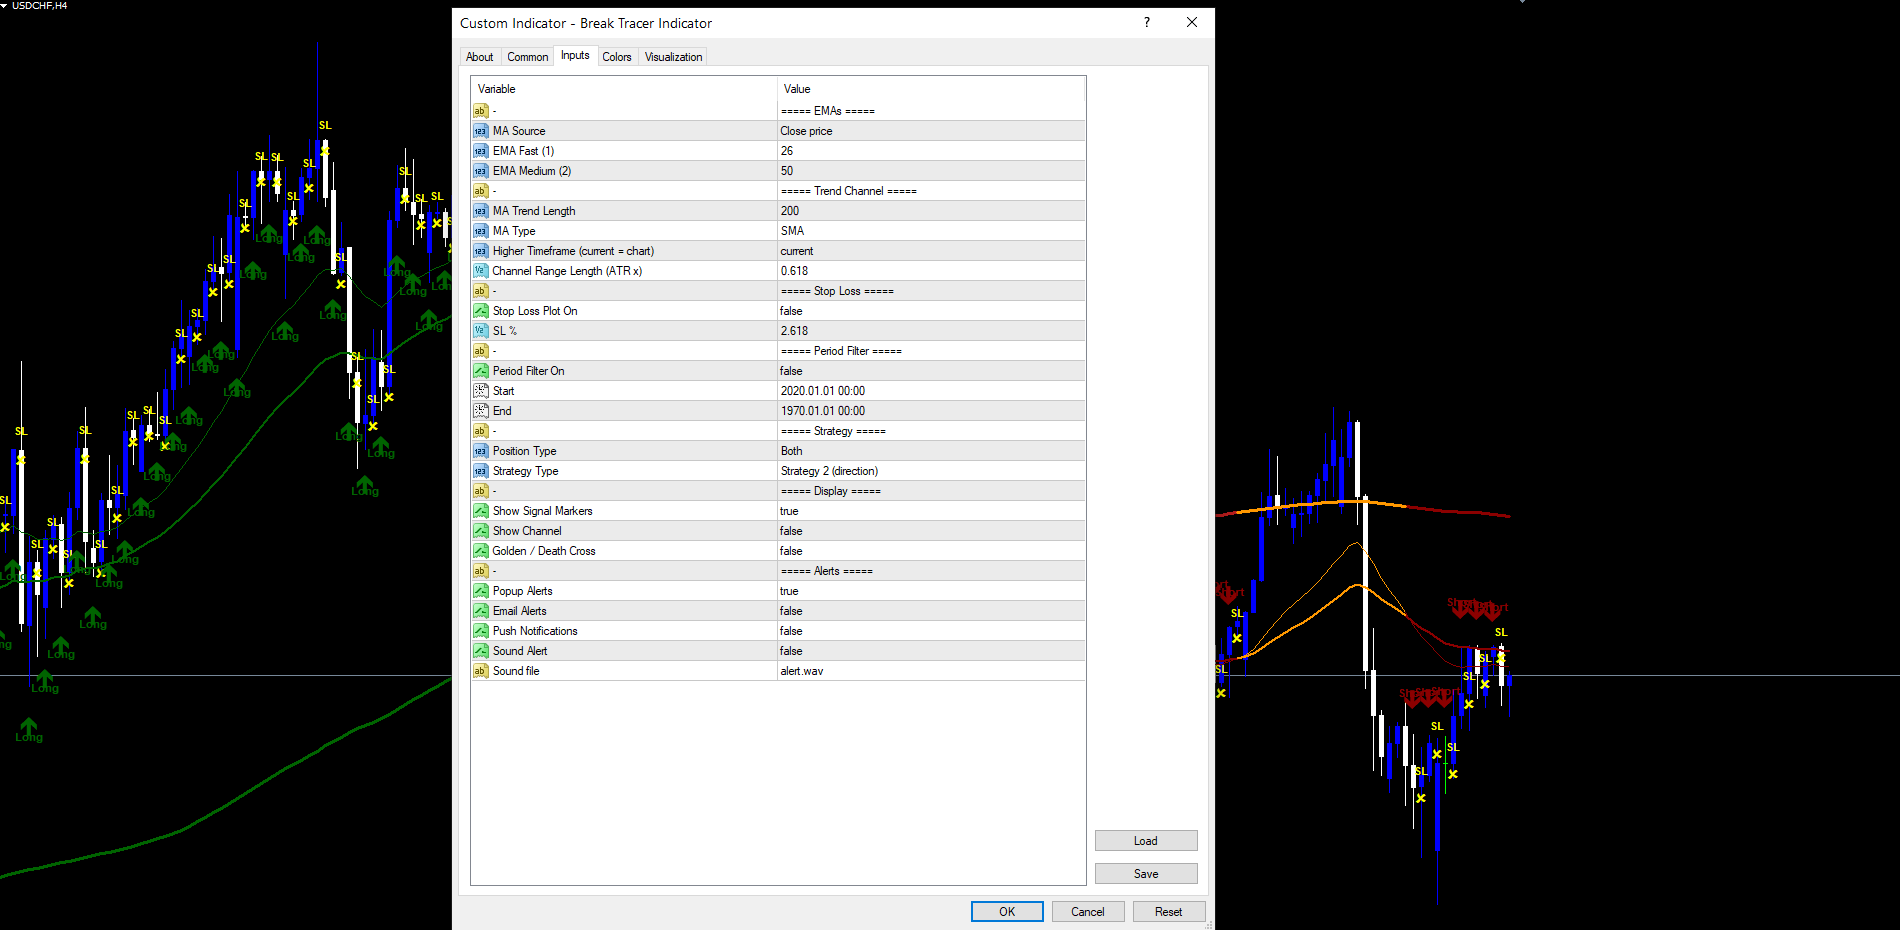
Parameter Reference
All input parameters, grouped by category. Defaults are listed; modify through the standard MetaTrader inputs dialog.
EMAs
| Parameter | Default | Description |
|---|---|---|
| MA Source | Close | Applied price for the fast and medium EMAs |
| EMA Fast (1) | 26 | Period of the fast exponential moving average |
| EMA Medium (2) | 50 | Period of the medium exponential moving average |
Trend Channel
| Parameter | Default | Description |
|---|---|---|
| MA Trend Length | 200 | Period of the slow trend MA |
| MA Type | SMA | EMA or SMA for the trend MA |
| Higher Timeframe | current | Anchor the trend MA to a higher timeframe (current = chart) |
| Channel Range Length | 0.618 | ATR multiplier for the channel half-width |
Stop Loss
| Parameter | Default | Description |
|---|---|---|
| Stop Loss Plot On | false | Enable the SL line and stop-out detection |
| SL % | 2.618 | Stop-loss distance as a percentage of entry close |
Period Filter
| Parameter | Default | Description |
|---|---|---|
| Period Filter On | false | Restrict signals to a date range |
| Start | 2020.01.01 | Start of the active range |
| End | 2099.12.31 | End of the active range |
Strategy
| Parameter | Default | Description |
|---|---|---|
| Position Type | Both | Allow Only Long, Only Short, or Both |
| Strategy Type | Strategy 2 | Strategy 1 (cross) or Strategy 2 (direction) |
Display
| Parameter | Default | Description |
|---|---|---|
| Show Signal Markers | true | Draw entry / exit / SL labels and arrows on the chart |
| Show Channel | false | Draw the ATR channel as a coloured fill |
| Golden / Death Cross | false | Show 50-vs-200 cross labels |
Alerts
| Parameter | Default | Description |
|---|---|---|
| Popup Alerts | true | On-screen alert dialog |
| Email Alerts | false | Email via configured SMTP |
| Push Notifications | false | Mobile push via MetaQuotes ID |
| Sound Alert | false | Play sound file on each event |
| Sound file | alert.wav | Filename for the sound alert |
Recommended Configuration Profiles
Conservative. Strategy Type = Strategy 1 , Channel Range Length = 1.0 , MA Trend Length = 200 , Stop Loss Plot On = true , SL % = 3.0 . Produces fewer signals with a strict cross requirement, wider channel, and explicit risk management.
Default (balanced). All defaults. Suitable for M30-H1 on Forex majors.
Aggressive. Strategy Type = Strategy 2 , Channel Range Length = 0.382 , MA Trend Length = 100 . Produces more frequent signals at the cost of more in-range entries. Useful for active traders willing to filter manually.
HTF-Anchored Swing. Higher Timeframe = H4 , attach to M30 chart. M30 entries that align with the H4 trend.
Installation
Break Tracer Indicator is distributed through the MQL5.com Market and installs automatically.
- Purchase the indicator from the MQL5.com Market product page.
- The indicator downloads and installs automatically into MetaTrader.
- Open the Navigator panel (Ctrl+N) and expand Indicators > Market.
- Locate Break Tracer Indicator in the list.
- Drag it onto any chart, or double-click its name.
- Adjust input parameters if needed; click OK.
The indicator works on any timeframe and any instrument the broker supports. No manual file copying is required.
The warmup period is approximately MA Trend Length + 10 bars (default: 210 bars). On a fresh chart with limited history, the indicator may need a few seconds to populate the trend MA before signals appear. Once the warmup is complete, subsequent ticks process incrementally with negligible latency.
All graphical objects use the BTI_ prefix and are cleaned up automatically when the indicator is removed.
Conclusion
Break Tracer Indicator combines three of the most reliable trend tools into a single non-repainting system: a fast EMA pair, a long-period trend MA with optional higher-timeframe support, and an ATR-based channel that filters out range conditions. Each layer adds an independent confirmation, and signals fire only when all three agree. The result is a clean, structured trend system that converts the basic MA crossover into something traders can actually act on.
The five-colour trend ribbon, the optional stop-loss line with hit detection, the orderly close-by-signal-change exits, and the 4-channel alert package together form a complete signal-to-management workflow within a single indicator. The non-repainting architecture ensures that historical signals are exactly what real-time signals would have been, with no hidden lookaheads.
The indicator is designed for Forex, Crypto, Stocks, Commodities, and Indices traders working on the M15 to H4 timeframes for swing entries, although it adapts to any timeframe through its ATR-scaled channel and HTF anchor. All parameters are fully configurable, allowing the indicator to be tuned from conservative position-trading setups to aggressive intraday configurations.
Download the indicator:
- MetaTrader 5: Break Tracer MT5
- MetaTrader 4: Break Tracer MT4
CONTACT & SUPPORT
- Email: info@forexobroker.com
- Questions: Use the Comments section on the product page or send a private message
- Bug Reports: Please include your broker name, account type, and a screenshot
-
✅ All MQL Tools: https://www.mql5.com/en/users/forexobroker/ ✅
--------------------------------------------------------------------------------------------------------------
🏦 **Broker I use**: https://icmarkets.com/?camp=55869
🏦 **Broker For EU Traders I use 1**: https://www.ictrading.com?camp=91414
🏦 **Broker I use 2**: https://one.exnessonelink.com/boarding/sign-up/a/c_thuv62ocfq
💻 **VPS**: https://chocoping.com/processing/aff.php?aff=738
💼 **Companies I use for getting funded**:
Fundednext: https://fundednext.com/?fpr=kestutis39
The5ers: https://www.the5ers.com/?afmc=16kl
FTMO: https://trader.ftmo.com/?affiliates=nRAyOhmFRnEnFdOpdLeh
Risk Disclaimer
Trading foreign exchange and CFDs on margin carries a high level of risk and may not be suitable for all investors. You may sustain a loss exceeding your initial investment. Trend Quorum is a technical analysis tool and does not guarantee profitable trades. Past performance is not indicative of future results. The authors accept no liability for any loss arising from use of the indicator. By using Trend Quorum you acknowledge sole responsibility for your trading decisions.


 & AMD Framework")
")