")

Introduction
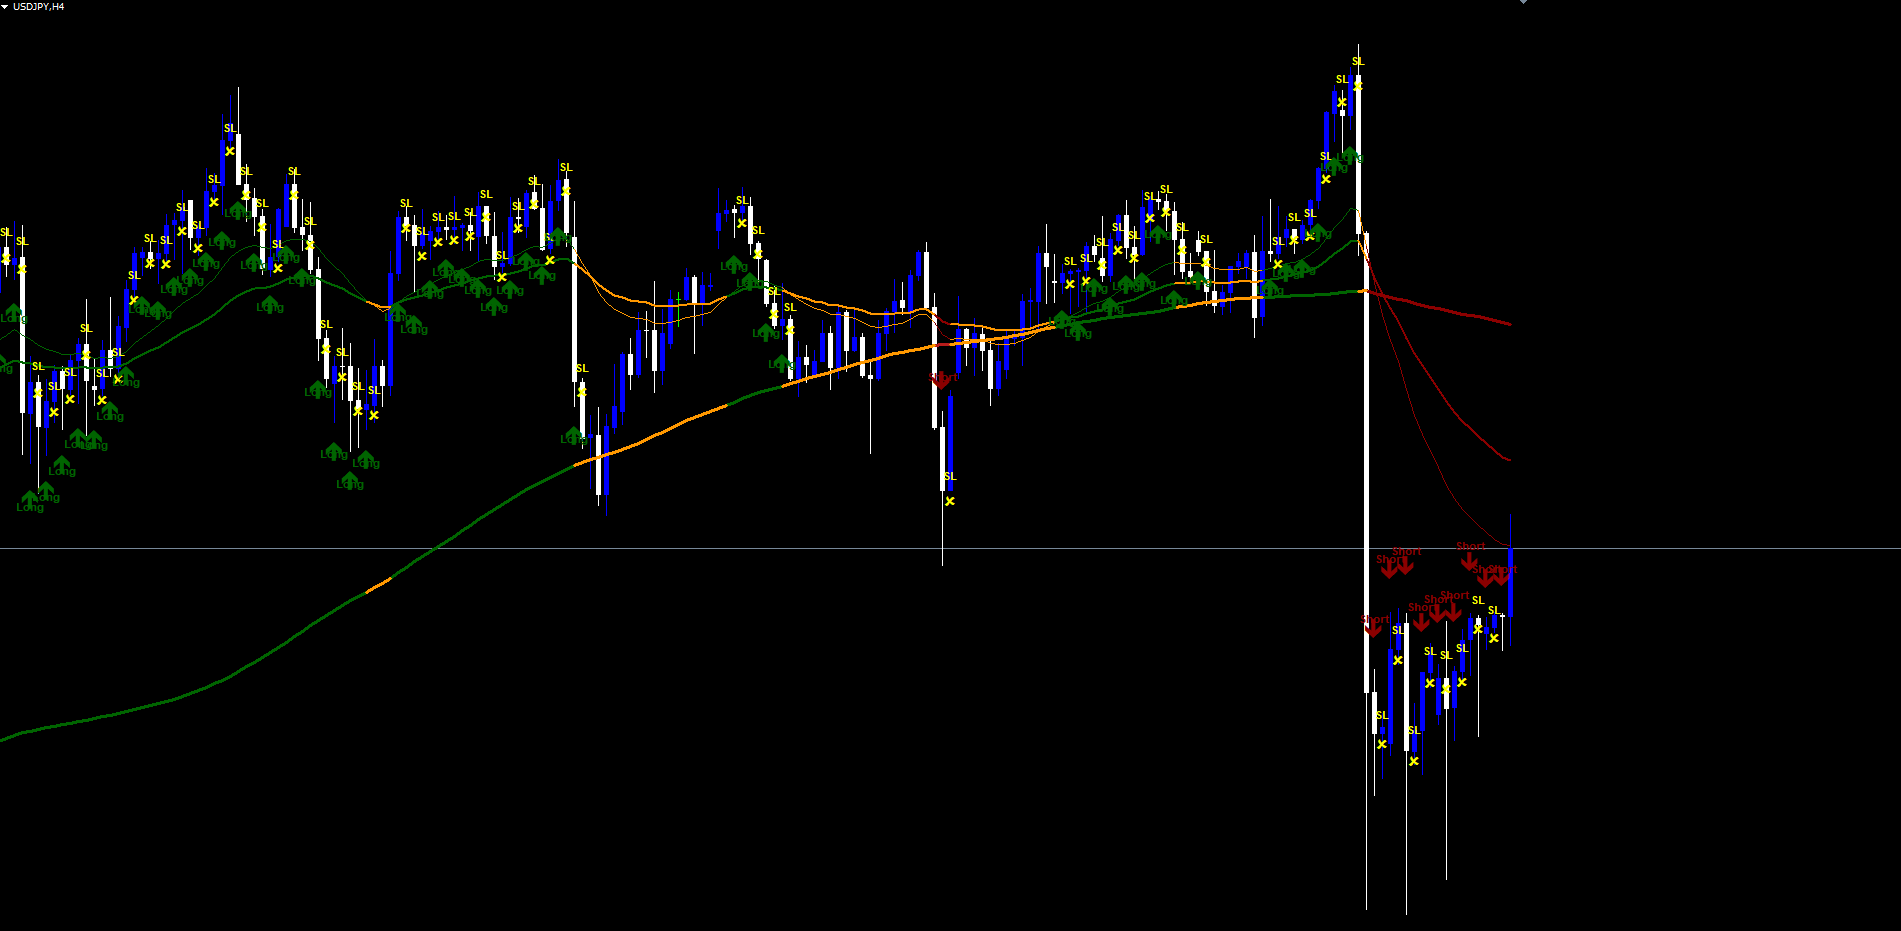
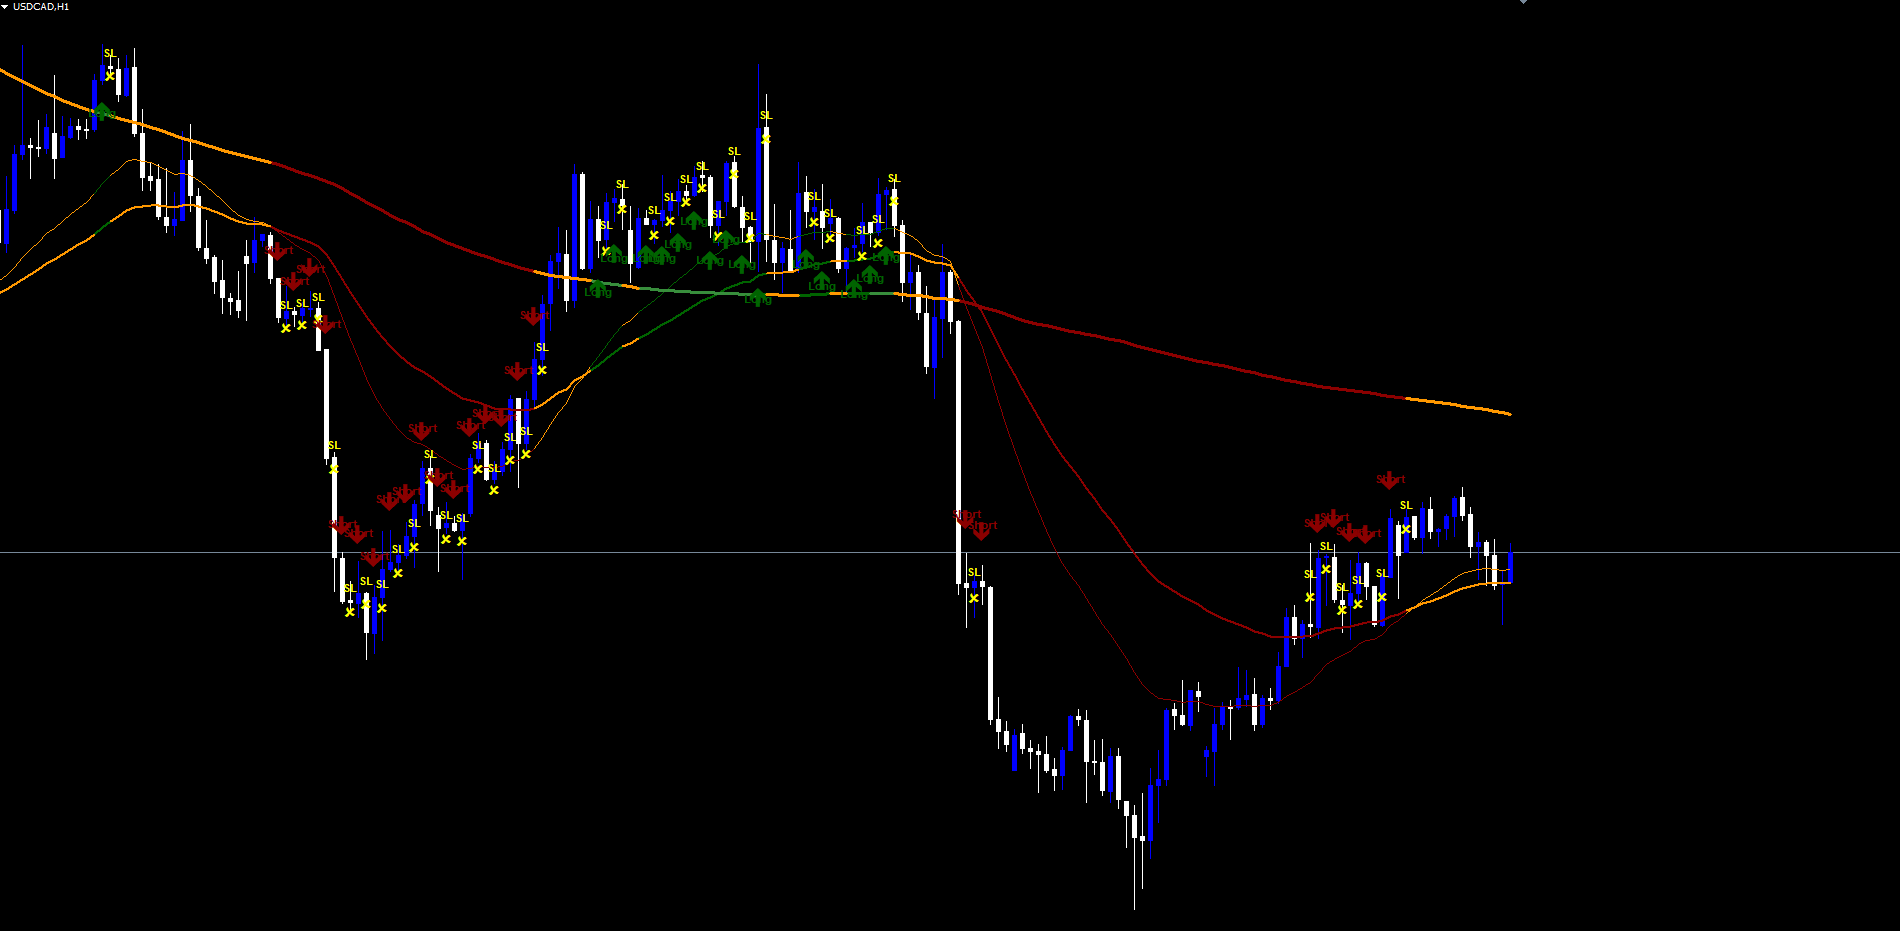
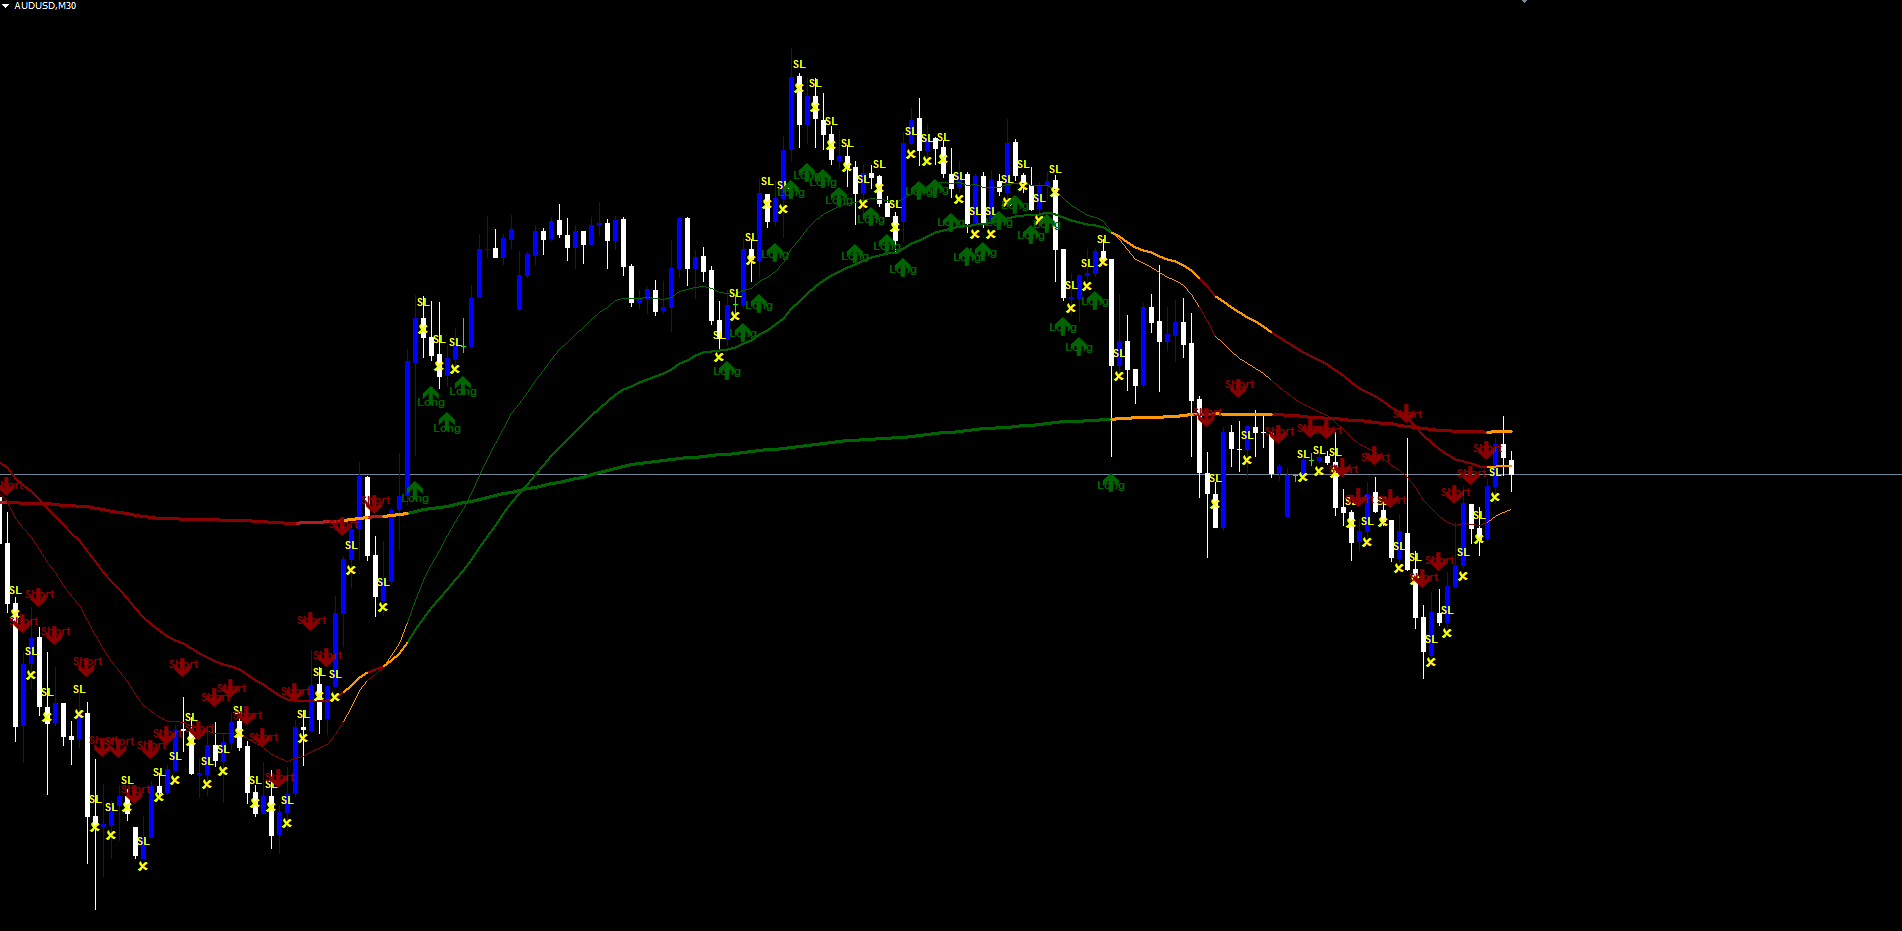
The Break Tracer Indicator is a non-repainting trend system for MetaTrader 4 and MetaTrader 5 that combines three independent components into a single visual indicator:
- A fast EMA pair (default 26 / 50) that defines short-term momentum
- A MA Trend of length 200 (EMA or SMA) that defines the dominant regime, with optional higher-timeframe anchor
- An ATR-based channel that filters out range conditions, drawn at the trend MA plus and minus an ATR multiple
A signal fires only when all three components agree on direction. Long signals require: bar close outside the upper edge of the channel, close above the trend MA, and the fast EMA above the medium EMA. Short signals are the symmetric mirror.
Key Features:
- Non-Repainting: Signals are evaluated only on closed bars and never modify historical markers
- 5-Colour Trend Ribbon: dark green (rising bull), light green (flat bull), orange (range), light red (flat bear), dark red (falling bear)
- Optional Stop-Loss Line: drawn from each entry, with cross-under and bar-engulf detection
- Optional Higher-Timeframe Anchor: trade on lower timeframe with trend MA referenced from a higher timeframe
- Optional Golden / Death Cross: classic 50-vs-200 cross overlay
- 6 Alert Events: BUY, SELL, BUY-CLOSE, SELL-CLOSE, STOP-LOSS-LONG, STOP-LOSS-SHORT (plus GOLDEN-CROSS and DEATH-CROSS when enabled)
- 4 Alert Channels: popup, email, push, sound -- independently togglable
- Period Filter: restrict signals to a date range for backtest windows or session-specific trading
Download the indicator:
- MetaTrader 5: Break Tracer MT5
- MetaTrader 4: Break Tracer MT4
TIP: This indicator is designed for swing traders working on M30-H4 charts. It works on any symbol and any timeframe; the defaults are tuned for the M30-H1 range on Forex majors.
Installation Guide
Break Tracer Indicator is distributed through the MQL5.com Market. Installation is automatic.
Steps:
- Purchase the indicator from the MQL5 Market product page
- The indicator installs automatically into your MetaTrader terminal
- Open MetaTrader and press Ctrl+N to open the Navigator panel
- Expand Indicators > Market
- Locate Break Tracer Indicator in the list
- Drag it onto any chart, or double-click its name
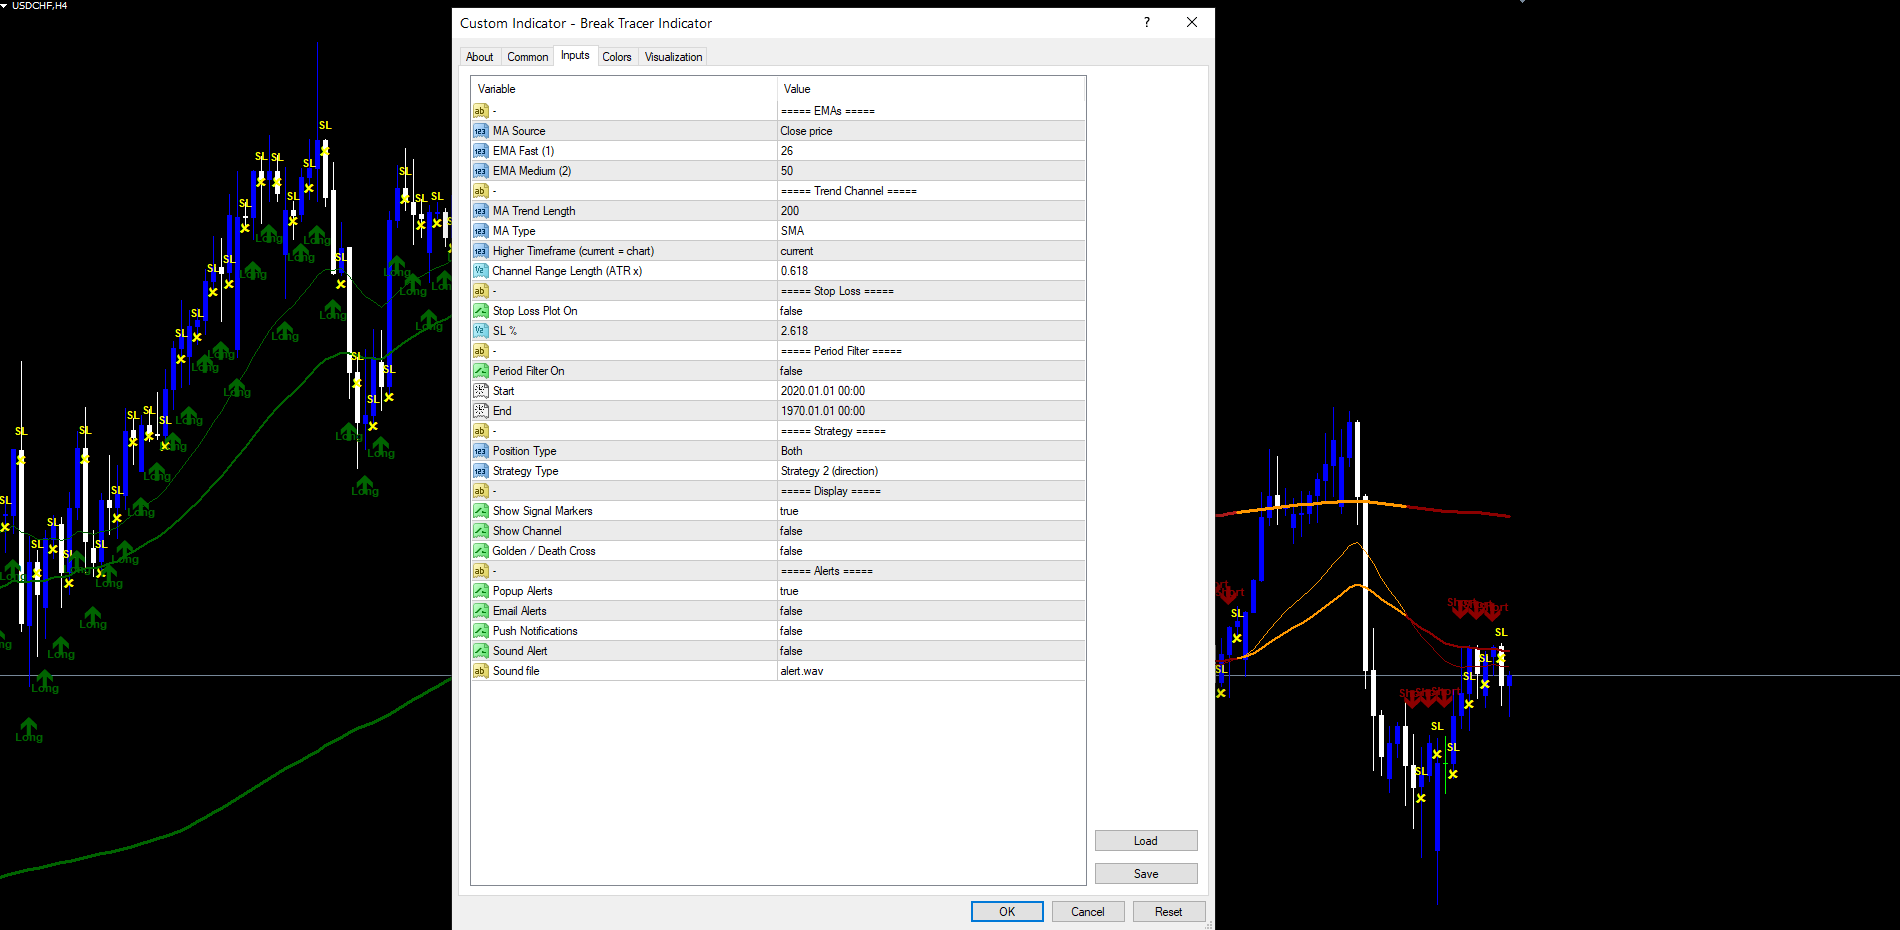
- The settings dialog appears -- adjust parameters as needed (see sections below)
- Click OK to apply
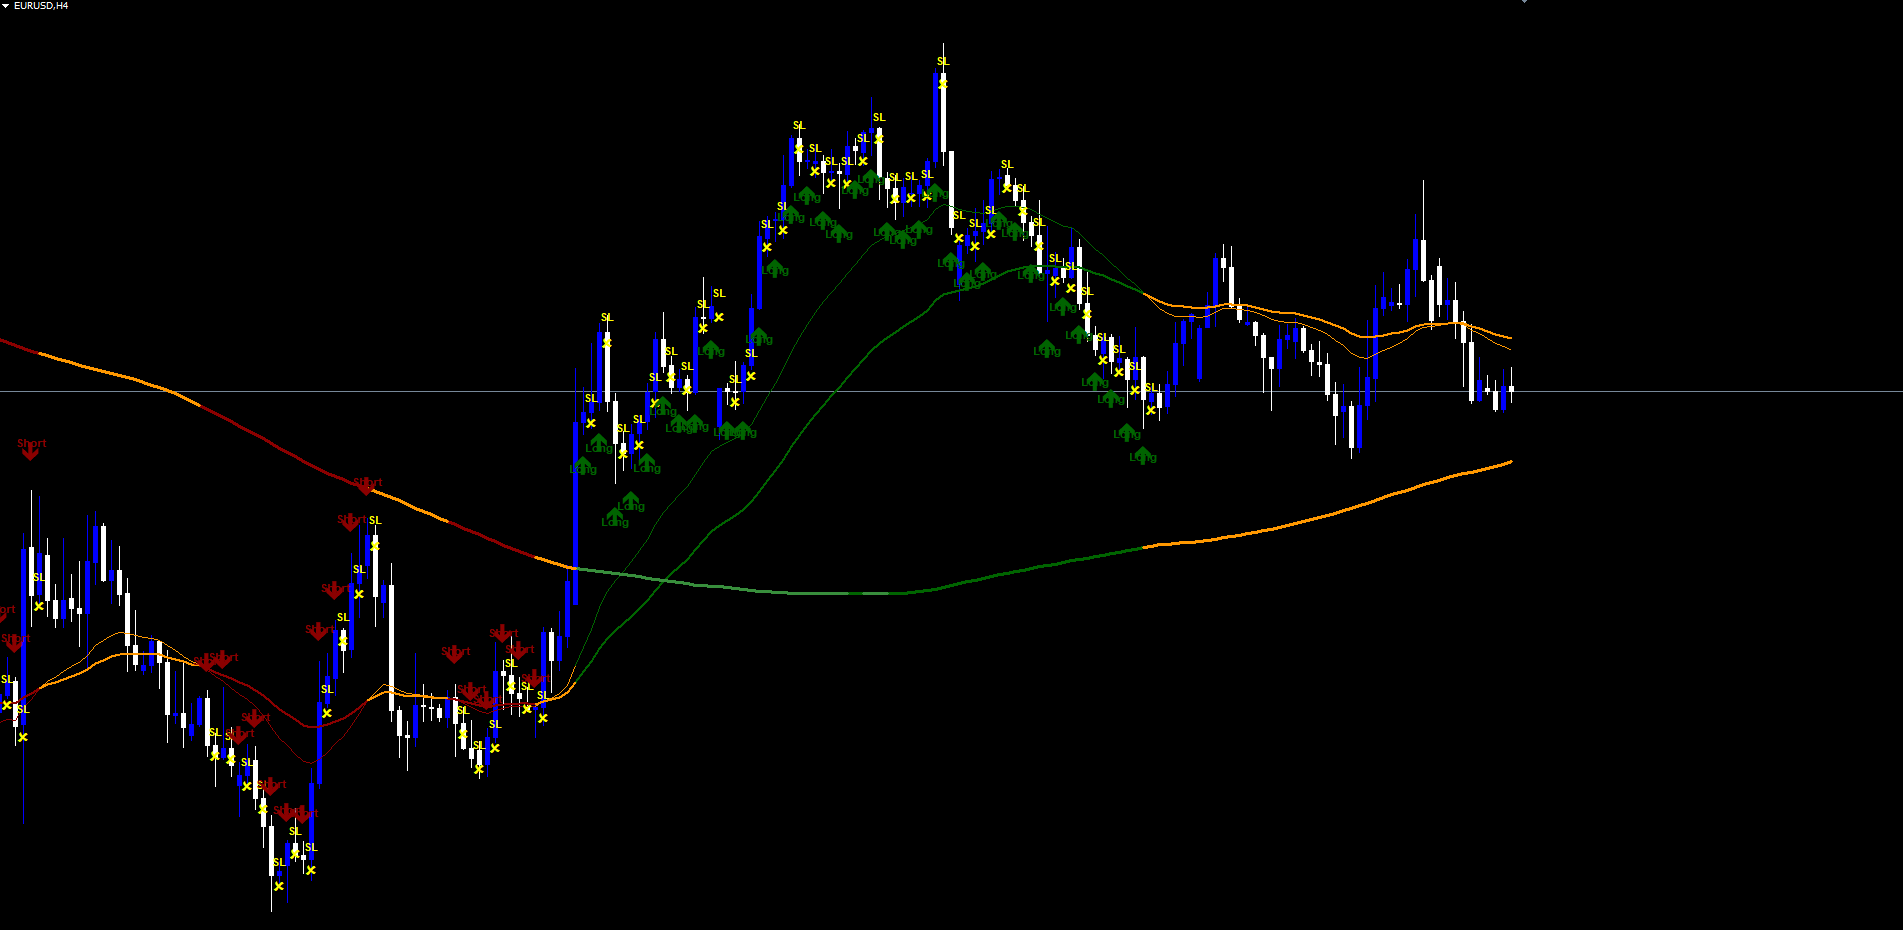
After loading, you will see:
- EMA pair drawn as two thin lines (fast 1px, medium 2px) coloured dark green / dark red / orange depending on the current regime
- Trend MA drawn as a thicker line (3px) coloured by 5-state ribbon
- Coloured fill between the EMA pair (light green / light red / light orange) showing the EMA spread tinted by regime
- Signal arrows (Wingdings 233 for buy, 234 for sell) at entry bars with text labels ("Long", "Short")
- SL labels (yellow X with "SL" text) at stop-loss hits
- Close labels (yellow X with "Close" text) at orderly exits
IMPORTANT: Do not manually copy files to the data folder. The MQL5 Market handles all file placement and updates automatically.
Signal System Overview
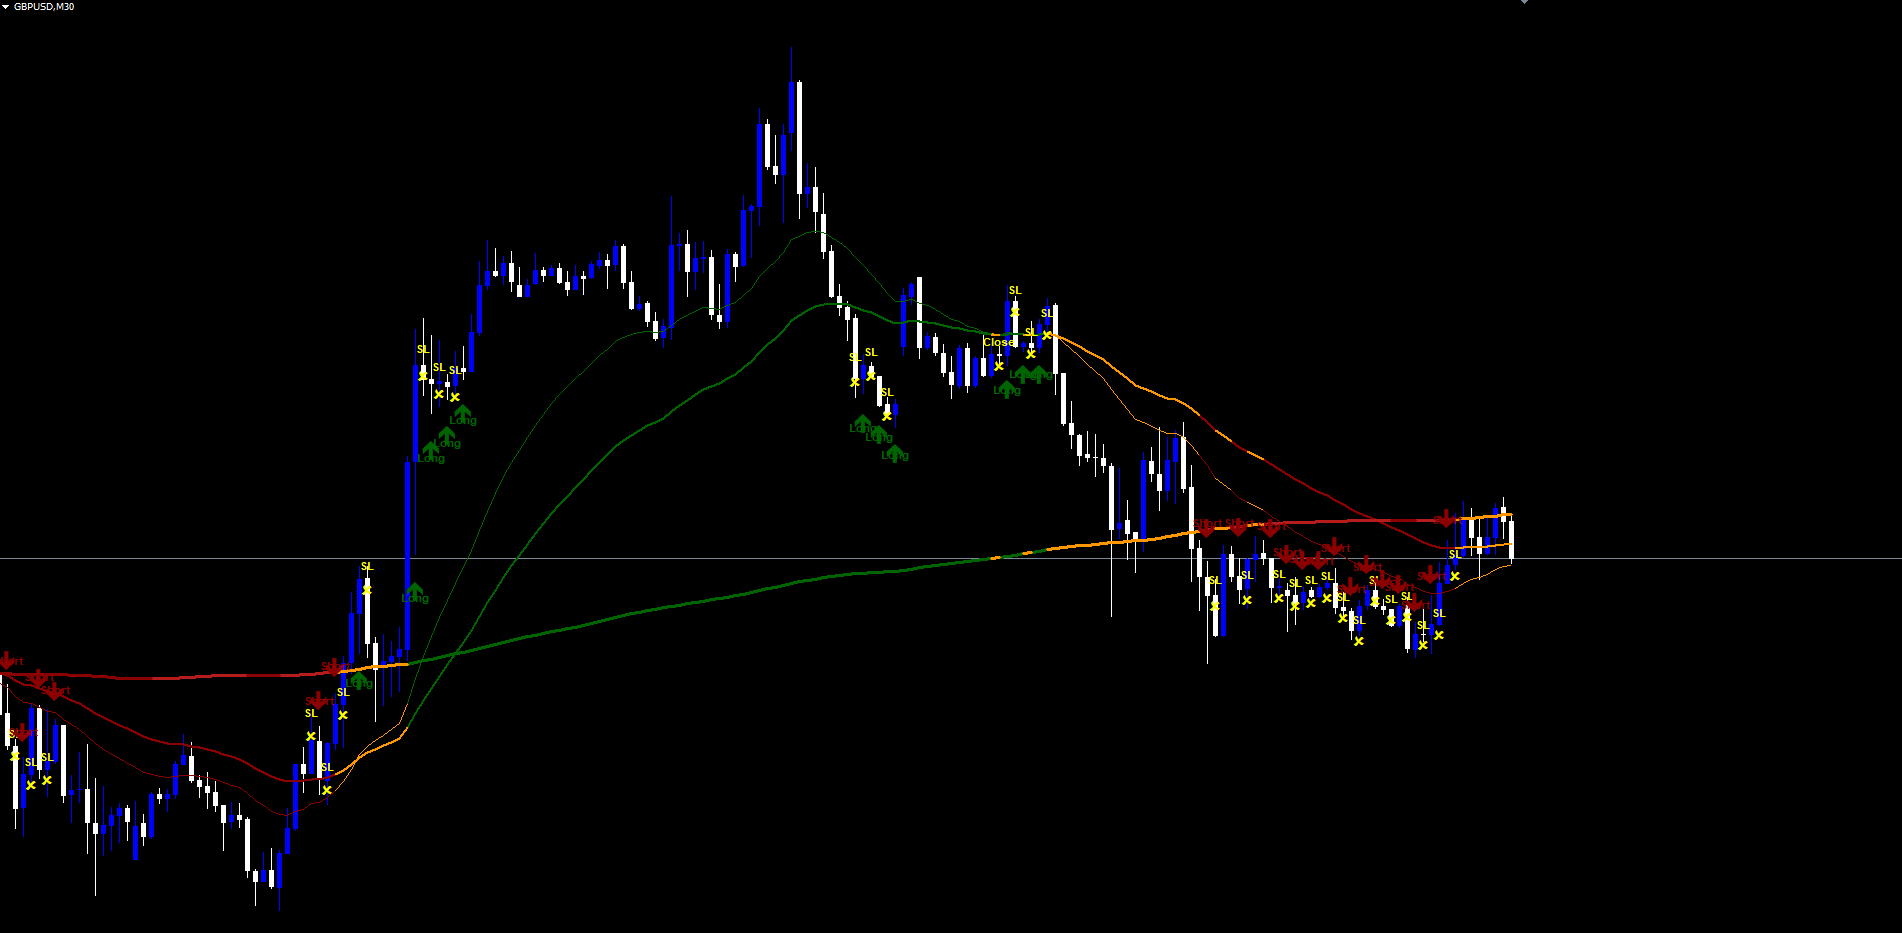
Each trade produces up to three visible markers across its lifecycle:
1. Entry
- Long entry: green up-arrow (Wingdings 233) below the bar with "Long" text label
- Short entry: red down-arrow (Wingdings 234) above the bar with "Short" text label
2. Exit by Signal Change
When the trend regime changes or the EMA stack reverses while a trade is open, the indicator places a yellow X (Wingdings 251) at the close of the exit bar with "Close" text label. This is an orderly exit driven by the trend system, not a stop-loss hit.
3. Exit by Stop Loss
When the optional stop-loss line is touched or crossed, the indicator places a yellow X at the stop-loss price level with "SL" text label.
Non-Repainting Confirmation:
- Entry conditions are evaluated only on closed bars; the current forming bar produces no signal label or alert
- Once a signal arrow and label appear, they are permanent and never repositioned
- What you see in historical data is exactly what would have appeared in real time
NOTE: The one-bar entry delay is the cost of non-repainting integrity. The bar that triggered the signal must close before the signal appears, so the trade is taken at the open of the bar following the trigger.
EMA Settings
The fast and medium EMAs define short-term momentum. Their cross alone is too noisy to trade, but combined with the trend MA and channel filter they form the entry trigger.
| Parameter | Default | Description |
|---|---|---|
| MA Source | Close | Applied price (Close, Open, High, Low, Median, Typical, Weighted) |
| EMA Fast (1) | 26 | Period of the fast exponential moving average |
| EMA Medium (2) | 50 | Period of the medium exponential moving average |
Visual behaviour:
- The fast EMA is drawn at width 1, the medium EMA at width 2
- Both EMAs are coloured dark green when in bull state (trend = +1 and EMA fast > medium), dark red in bear, orange in range or during exit transitions
- A coloured fill is drawn between the two EMAs using the same regime palette (light shades to keep it visually subtle)
TIP: For scalping on M5-M15, try EMA Fast = 9, EMA Medium = 21. For position trading on D1, EMA Fast = 50, EMA Medium = 100. The defaults of 26 / 50 work well on the M30-H4 swing range.
Trend Channel Settings
The trend MA and ATR channel form the regime filter. The trend MA defines where price is structurally; the channel defines what counts as a meaningful breakout from that structure.
| Parameter | Default | Description |
|---|---|---|
| MA Trend Length | 200 | Period of the slow trend MA |
| MA Type | SMA | EMA or SMA for the trend MA |
| Higher Timeframe | current | Timeframe to source the trend MA from (current = chart) |
| Channel Range Length | 0.618 | ATR(MA Trend Length) multiplier for the channel half-width |
How it works:
- The trend MA is calculated on the chart timeframe by default. Setting Higher Timeframe to a higher value (e.g., H4 while the chart is M30) pulls the trend MA from H4 closes, with a one-HTF-bar lookback for non-repaint integrity.
- The channel is drawn at trend MA +/- (ATR(MA Trend Length) x Channel Range Length).
- A bar that overlaps the channel (open or close inside the band) is treated as ranging; no entry signal can fire on that bar.
- A bar that closes outside the channel on the upper side -- with the close above the trend MA and the EMA fast above the EMA medium -- triggers a long signal.
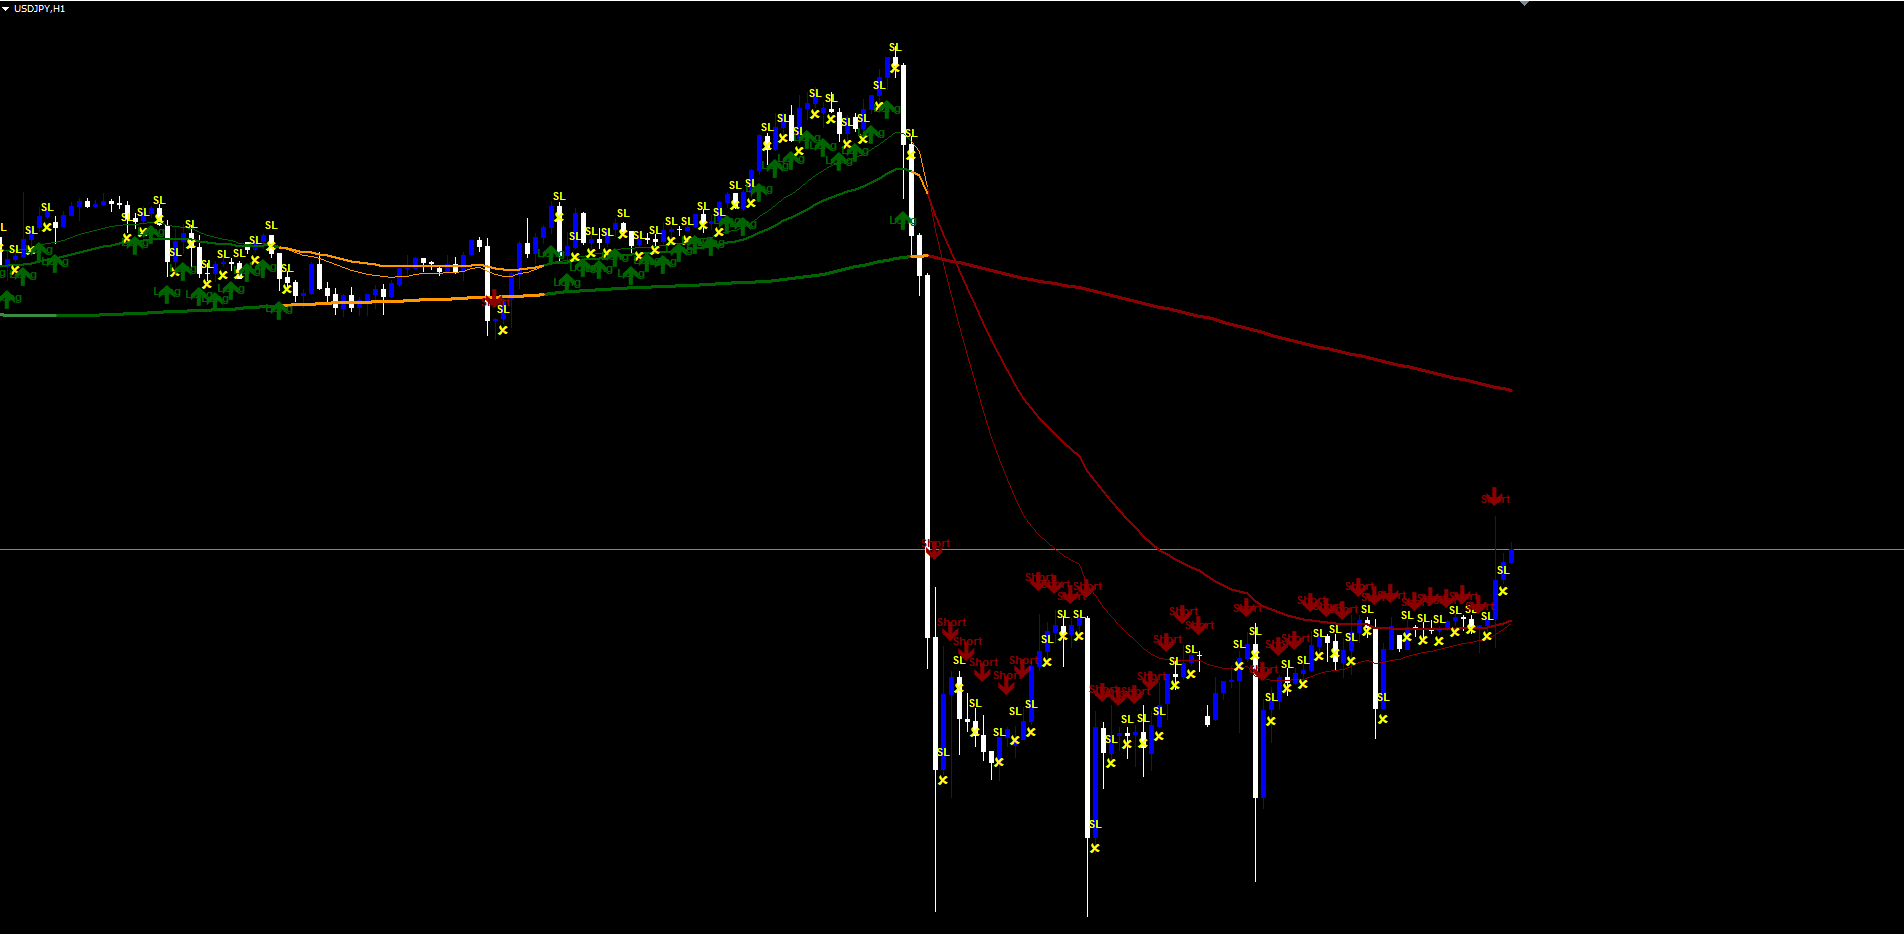
The 5-colour trend ribbon:
The trend MA itself is coloured according to the current regime and its rate of change:
| Colour | Condition |
|---|---|
| Dark green | Trend = +1 (bull) AND trend MA rising vs previous bar |
| Light green | Trend = +1 AND trend MA flat or pulling back |
| Orange | Trend = 0 (range / inside channel) |
| Light red | Trend = -1 (bear) AND trend MA flat or rising |
| Dark red | Trend = -1 AND trend MA falling vs previous bar |
TIP: When the ribbon is dark green or dark red, the trend is asserting itself with momentum. When light green or light red, the trend is cooling and a regime change may be near. Orange means consolidation -- step aside.
Stop Loss Settings
The optional stop-loss line draws an explicit risk level on every entry and watches for stop-out conditions across the life of the trade.
| Parameter | Default | Description |
|---|---|---|
| Stop Loss Plot On | false | Enable the SL line and stop-out detection |
| SL % | 2.618 | Stop-loss distance as a percentage of entry close |
How the SL line works:
- On a long entry, the SL price is Close - (Close x SL% / 100) . Default 2.618% is the inverse Fibonacci ratio.
- On a short entry, the SL price is Close + (Close x SL% / 100) .
- The line is drawn forward from the entry bar at the same price level until the stop-out is detected or the trade closes by signal change.
Stop-out detection:
The state machine watches for two stop-out conditions:
- Cross-under (long) / cross-over (short). Price closes through the line on the wrong side. The previous bar's close was on the correct side; the current bar's close is on the wrong side.
- Bar engulf. The bar's range fully contains the line (high > SL > low). This catches stop-outs that occur during the bar without requiring a closing cross.
When either condition triggers, the indicator marks the bar with a yellow SL label, fires the appropriate stop-loss alert, and resets the trade state. The next signal can enter a fresh trade.
TIP: The SL display is off by default to keep charts clean for analysis. Enable it on a live trading chart so you have explicit risk management on every entry. For low-volatility instruments (e.g., EURGBP, AUDNZD), reduce SL% to 1.5; for high-volatility (e.g., GBPJPY, BTCUSD), increase to 4 or 5.
Period Filter
For traders who only want signals during specific date ranges -- for example, to backtest a window of historical data, or to avoid signals during specific market sessions -- the indicator includes a period filter.
| Parameter | Default | Description |
|---|---|---|
| Period Filter On | false | Restrict signals to a date range |
| Start | 2020.01.01 | Start of the active range |
| End | 2099.12.31 | End of the active range |
When Period Filter On = true , the state machine evaluates entries only on bars whose timestamp falls inside [Start, End] . Bars outside the range produce no entry signal. Existing trades are not closed by the filter -- if a trade is open at the start of an excluded bar, the indicator simply skips evaluating that bar and waits for the next in-range bar.
TIP: Use the period filter for walk-forward analysis: set the range to a single year, attach the indicator, observe signals, then move the range forward. Disable it for everyday live trading.
Strategy Settings
The strategy mode selects how strict the entry filter is. Two modes are provided:
| Parameter | Default | Description |
|---|---|---|
| Position Type | Both | Allow Only Long, Only Short, or Both directions |
| Strategy Type | Strategy 2 | Strategy 1 (cross) or Strategy 2 (direction) |
Strategy 2 (default). A long signal requires three conditions: bar closes outside the upper channel, close above the trend MA, and EMA fast above EMA medium. The cleaner mode that produces the trend regimes most traders will recognise.
Strategy 1. Adds a constraint: the medium EMA must be on the same side of the trend MA as the closing bar. In a bull setup, this means the trend MA must already be below the medium EMA before the long signal can fire. The effect is to delay entries until the EMA structure has fully aligned with the trend MA. Fewer signals, later entries, but each one occurs in a more developed trend.
Position Type:
- Only Long : only buy signals fire; sell signals are suppressed
- Only Short : only sell signals fire
- Both : full bidirectional trading (default)
TIP: If you trade a long-bias portfolio (stock indices, growth crypto), set Position Type = Only Long to filter out the noisy short signals that often occur during pullbacks within a long-term uptrend.
Display Settings
| Parameter | Default | Description |
|---|---|---|
| Show Signal Markers | true | Draw entry / exit / SL labels and arrows on the chart |
| Show Channel | false | Draw the ATR channel as a coloured fill |
| Golden / Death Cross | false | Show 50-vs-200 cross labels |
Show Signal Markers. Master toggle for all chart objects (arrows, text labels, SL line). When false, the indicator draws only the EMA lines and trend ribbon -- useful for traders who want a clean chart for analysis or who manage signals from alerts only.
Show Channel. Draws the ATR channel as a coloured fill above and below the trend MA. The fill takes the regime colour (green / red / orange). Off by default since the trend ribbon already conveys the regime visually.
Golden / Death Cross. Independent of the main trend system, draws orange labels when the medium EMA crosses above (Golden) or below (Death) the trend MA. These are slow secondary signals used by some traders for swing or position trades.
Complete Parameter Reference
| # | Parameter | Type | Default | Category |
|---|---|---|---|---|
| 1 | MA Source | enum | Close | EMAs |
| 2 | EMA Fast (1) | int | 26 | EMAs |
| 3 | EMA Medium (2) | int | 50 | EMAs |
| 4 | MA Trend Length | int | 200 | Trend Channel |
| 5 | MA Type | enum | SMA | Trend Channel |
| 6 | Higher Timeframe | enum | current | Trend Channel |
| 7 | Channel Range Length | double | 0.618 | Trend Channel |
| 8 | Stop Loss Plot On | bool | false | Stop Loss |
| 9 | SL % | double | 2.618 | Stop Loss |
| 10 | Period Filter On | bool | false | Period Filter |
| 11 | Start | datetime | 2020.01.01 | Period Filter |
| 12 | End | datetime | 2099.12.31 | Period Filter |
| 13 | Position Type | enum | Both | Strategy |
| 14 | Strategy Type | enum | Strategy 2 | Strategy |
| 15 | Show Signal Markers | bool | true | Display |
| 16 | Show Channel | bool | false | Display |
| 17 | Golden / Death Cross | bool | false | Display |
| 18 | Popup Alerts | bool | true | Alerts |
| 19 | Email Alerts | bool | false | Alerts |
| 20 | Push Notifications | bool | false | Alerts |
| 21 | Sound Alert | bool | false | Alerts |
| 22 | Sound file | string | alert.wav | Alerts |
Alert Configuration
Break Tracer Indicator supports four alert delivery channels and up to eight distinct alert events.
Alert Channels
| Parameter | Default | Description |
|---|---|---|
| Popup Alerts | true | Show a popup dialog in MetaTrader |
| Email Alerts | false | Send email via configured SMTP |
| Push Notifications | false | Send push to the MetaTrader mobile app |
| Sound Alert | false | Play the configured sound file |
| Sound file | alert.wav | Filename for the sound (must be in MT/Sounds folder) |
Alert Events
The indicator fires alerts for these events, each once per bar:
| Event | Trigger condition |
|---|---|
| BUY | A new long entry fires |
| SELL | A new short entry fires |
| BUY-CLOSE | An open long is closed by a signal change (orderly exit) |
| SELL-CLOSE | An open short is closed by a signal change |
| STOP-LOSS-LONG | An open long is stopped out |
| STOP-LOSS-SHORT | An open short is stopped out |
| GOLDEN-CROSS | Medium EMA crosses above trend MA (if Golden / Death Cross enabled) |
| DEATH-CROSS | Medium EMA crosses below trend MA (if Golden / Death Cross enabled) |
Each alert message has the format: Break Tracer - <SYMBOL> <TIMEFRAME>: <EVENT(S)> . When multiple events fire on the same bar, they are concatenated.
Enabling Push Notifications
- Install the MetaTrader mobile app (iOS or Android)
- Open the app and navigate to Settings > Messages
- Copy your MetaQuotes ID
- In desktop MetaTrader, go to Tools > Options > Notifications
- Enter your MetaQuotes ID and enable notifications
- Set Push Notifications = true in the indicator inputs
Enabling Email Notifications
- In MetaTrader, go to Tools > Options > Email
- Check Enable
- Enter SMTP server, port, login, password, and destination email
- Click Test to verify
- Set Email Alerts = true in the indicator inputs
TIP: Multi-chart traders should enable Push Notifications and disable Popup Alerts. This lets you monitor a watchlist of 10+ instruments without each chart spawning a popup that interrupts other work.
Trading Strategies
Three approaches are provided as starting points. All assume default settings unless noted.
WARNING: Trading involves significant risk of loss. These strategies are educational. Always test on demo first and never trade with money you cannot afford to lose.
Strategy A: Swing Trading on M30 - H1
Goal: ride medium-term trends with a 2-3% risk per trade.
Setup:
- Defaults: EMA Fast = 26, EMA Medium = 50, MA Trend = 200, Channel Range = 0.618
- Stop Loss Plot On = true, SL % = 2.618
Trade management:
- Wait for a Long or Short arrow to appear on a closed bar
- Enter at the open of the next bar
- Hold until either the SL line is hit (yellow SL marker) or a Close marker appears
- Optional: scale out 50% at +1R (stop-loss distance) and trail the rest with a manual stop at the trend MA
Strategy B: HTF-Anchored Lower-TF Entries
Goal: trade M15 swings only when they align with the H4 trend.
Setup:
- Attach to M15 chart
- Higher Timeframe = H4
- All other settings default
How it works:
- The trend MA on the M15 chart is now the H4 200-SMA, lagged one H4 bar for non-repaint
- M15 EMA crosses fire entries only when they align with the H4 regime
- Far fewer signals than pure M15, but each one has the larger-timeframe wind at its back
Strategy C: Position Trading on H4 - D1
Goal: capture multi-week trends.
Setup:
- Higher Timeframe = current
- MA Trend Length = 200 (about 33 trading days on H4)
- Stop Loss Plot On = true, SL % = 4.0 (wider stops for higher timeframe)
- Channel Range Length = 1.0 (slightly wider channel for cleaner breakouts)
Trade management:
- Use Push Notifications -- you may have only one or two signals per month
- Enter at the open of the bar after the signal
- Hold for full trade duration; don't second-guess the system on noise
TIP: For Strategy C, also consider enabling Golden / Death Cross. The slow 50-vs-200 cross often confirms the regime shortly after the main trend signal, providing additional confidence on long-term trades.
Parameter Tuning Presets
Starting points for different trading styles:
Scalping Preset (M5 - M15)
| Parameter | Value |
|---|---|
| EMA Fast (1) | 9 |
| EMA Medium (2) | 21 |
| MA Trend Length | 100 |
| Channel Range Length | 0.382 |
| Stop Loss Plot On | true |
| SL % | 1.0 |
| Higher Timeframe | H1 (anchor to higher TF) |
Swing Trading Preset (M30 - H4)
| Parameter | Value |
|---|---|
| EMA Fast (1) | 26 (default) |
| EMA Medium (2) | 50 (default) |
| MA Trend Length | 200 (default) |
| Channel Range Length | 0.618 (default) |
| Stop Loss Plot On | true |
| SL % | 2.618 (default) |
Conservative / Position Preset (H4 - D1)
| Parameter | Value |
|---|---|
| EMA Fast (1) | 50 |
| EMA Medium (2) | 100 |
| MA Trend Length | 200 |
| Strategy Type | Strategy 1 |
| Channel Range Length | 1.0 |
| Stop Loss Plot On | true |
| SL % | 4.0 |
| Golden / Death Cross | true |
TIP: Start with the Swing Trading preset and modify one parameter at a time to observe its effect on signal quality and frequency. Don't change multiple parameters at once -- you won't know which change produced the result.
Troubleshooting
No Signals Appearing on the Chart
Possible causes:
- Warmup period not reached. The indicator requires MA Trend Length + 10 bars of history (default: 210). Scroll back or wait for more bars.
- Bar not closed. Signals only print on closed bars. The current forming bar produces no marker.
- Market in range mode. When the trend ribbon is orange, the market is inside the channel and no entry signal can fire. Wait for a breakout (ribbon turns green or red).
- Position Type filter active. If Position Type = Only Long , no short signals will appear (and vice versa). Set it to Both to see both directions.
- Period Filter active. If Period Filter On = true and the current bar is outside the date range, signals are suppressed.
Trend Ribbon Stuck on Orange
The orange ribbon means trendDir = 0 -- price is inside the channel. This is a feature, not a bug. The indicator is telling you the market is consolidating and entries should be avoided. Wait for the channel breakout.
If you want fewer "range" bars, reduce Channel Range Length (try 0.382 or 0.5). This narrows the channel and makes more bars qualify as breakouts.
Stop-Loss Hits at Unexpected Prices
The SL price is set at entry-bar close +/- SL% of close. If you expect the SL to be at the trend MA or at a swing low, that is a different system -- adjust your settings or strategy. The SL distance scales with price, so on USDJPY (price ~150) the absolute pip distance will be larger than on EURUSD (price ~1.08) for the same SL%.
EMAs Look Wrong on the Chart
The EMA lines are colored by regime, so a bull-state EMA is dark green, bear-state is dark red, and range/exit-state is orange. This is intentional. If the EMA appears dark green even though price is dropping, that means the regime is still bull (close still above trend MA, EMA fast still above medium) -- the next bar may bring a regime change.
Signal Lag
Signals appear at the close of the trigger bar, with entry at the open of the next bar. This is the non-repaint cost. If you see a candle that visually looks like a perfect signal but no arrow appears, it is because the bar has not yet closed -- the signal will appear after close.
Indicator Not Loading After Purchase
- Ensure MetaTrader is fully updated (Help > Check for Updates)
- Restart MetaTrader after purchase
- Check Navigator > Indicators > Market for the indicator
- If still missing, contact MQL5 support; the marketplace handles delivery
Compile Errors When Modifying the Source
The indicator is sold as compiled .ex4 / .ex5 files. Source modification is not supported and would require a separate purchase under the developer license. The compiled binaries work on all symbols and timeframes; configuration is via inputs only.
FAQ
Q: Does this indicator repaint?
A: No. Signals are evaluated only on closed bars. Higher-timeframe references use the previous closed HTF bar, so no future information can leak into past signals. Historical chart matches real-time exactly.
Q: Can I use it on Crypto / Stocks / Indices?
A: Yes. The ATR-scaled channel and percentage-based SL automatically adapt to any instrument's volatility profile. Defaults are tuned for Forex; for very high-volatility instruments (e.g., BTCUSD intraday), increase SL% to 4-5 and consider widening Channel Range Length to 1.0.
Q: Can I run multiple instances on the same chart?
A: Yes, but each instance creates its own chart objects. Use different settings for different timeframes (e.g., one instance with HTF = H4, another with HTF = D1). Be aware that alerts will fire from each instance independently.
Q: Does the indicator work in the Strategy Tester?
A: Yes. Run it in Visual Mode to see the trend ribbon and signals as the historical bars play through. The non-repaint architecture means tester results match the visual chart.
Q: What is the difference between Strategy 1 and Strategy 2?
A: Strategy 2 (default) requires the EMA stack and trend MA to agree on direction. Strategy 1 adds a stricter requirement: the medium EMA must already be on the correct side of the trend MA. Strategy 1 produces fewer, later, more developed entries; Strategy 2 produces more entries closer to the regime change.
Q: Why is the trend MA orange even though the market clearly looks like a bull trend?
A: The orange state means the most recent bar is inside the ATR channel. Even within a long-term uptrend, individual bars can pull back into the channel and produce a temporary range state. When the next bar closes outside the upper edge of the channel, the trend will return to green.
Q: Can the indicator be used as the basis for an EA?
A: The indicator provides signals via alerts and chart objects. To consume signals from an EA, the EA would read the indicator's buffer values via iCustom() . Specifically, buffer 0 (SL line) is non-empty when a trade is active; the trend ribbon buffers (10-14) hold the trend value when the corresponding state is active. Custom EA development is outside the scope of this manual.
Q: How much history do I need on the chart?
A: At minimum 210 bars (MA Trend Length + 10 warmup). For best signal density, load at least 1000 bars. The indicator's default Max Bars in Chart should be sufficient; if you need more history, increase it via Tools > Options.
Reference: Object Names
The indicator creates chart objects with the prefix BTI_ . They are automatically removed on detach.
| Object | Name pattern |
|---|---|
| Long entry arrow | BTI_longE_<bartime> |
| Long entry text | BTI_longEtxt_<bartime> |
| Short entry arrow | BTI_shortE_<bartime> |
| Short entry text | BTI_shortEtxt_<bartime> |
| Long close arrow | BTI_longX_<bartime> |
| Long close text | BTI_longXtxt_<bartime> |
| Short close arrow | BTI_shortX_<bartime> |
| Short close text | BTI_shortXtxt_<bartime> |
| Long SL arrow | BTI_longSL_<bartime> |
| Long SL text | BTI_longSLtxt_<bartime> |
| Short SL arrow | BTI_shortSL_<bartime> |
| Short SL text | BTI_shortSLtxt_<bartime> |
| Golden cross arrow | BTI_gcross_<bartime> |
| Death cross arrow | BTI_dcross_<bartime> |
To manually delete a stale object, use the right-click menu > Object List > select > Delete.
Conclusion
Break Tracer Indicator is a complete trend system in a single non-repainting package. The combination of fast EMA pair, slow trend MA with optional HTF anchor, and ATR-based channel filter produces clean signals that have agreed across multiple structural references before printing on the chart.
The 5-colour trend ribbon makes regime identification immediate. The optional stop-loss line provides explicit risk management. The 4-channel alert package enables multi-chart monitoring without manual supervision. The non-repaint architecture means historical signals are exactly what real-time signals would have been.
For best results, start with the default settings on M30-H1 Forex charts, observe how the indicator handles your preferred instruments, then tune parameters one at a time using the presets in this manual as guidance.
Download the indicator:
- MetaTrader 5: Break Tracer MT5
- MetaTrader 4: Break Tracer MT4
CONTACT & SUPPORT
- Email: info@forexobroker.com
- Questions: Use the Comments section on the product page or send a private message
- Bug Reports: Please include your broker name, account type, and a screenshot
-
✅ All MQL Tools: https://www.mql5.com/en/users/forexobroker/ ✅
--------------------------------------------------------------------------------------------------------------
🏦 **Broker I use**: https://icmarkets.com/?camp=55869
🏦 **Broker For EU Traders I use 1**: https://www.ictrading.com?camp=91414
🏦 **Broker I use 2**: https://one.exnessonelink.com/boarding/sign-up/a/c_thuv62ocfq
💻 **VPS**: https://chocoping.com/processing/aff.php?aff=738
💼 **Companies I use for getting funded**:
Fundednext: https://fundednext.com/?fpr=kestutis39
The5ers: https://www.the5ers.com/?afmc=16kl
FTMO: https://trader.ftmo.com/?affiliates=nRAyOhmFRnEnFdOpdLeh
Risk Disclaimer
Trading foreign exchange and CFDs on margin carries a high level of risk and may not be suitable for all investors. You may sustain a loss exceeding your initial investment. Trend Quorum is a technical analysis tool and does not guarantee profitable trades. Past performance is not indicative of future results. The authors accept no liability for any loss arising from use of the indicator. By using Trend Quorum you acknowledge sole responsibility for your trading decisions.


")
![[XAUUSD]: Weekly Liquidity Activation Points (timings), June 22-26, 2026](https://c.mql5.com/6/1013/splash-preview-771790.png "[XAUUSD]: Weekly Liquidity Activation Points (timings), June 22-26, 2026")
")