Buffon's Needle and the Probabilistic Nature of Breakouts - When the Parquet Floor Becomes a Chart


Buffon's Needle and the Probabilistic Nature of Breakouts - When the Parquet Floor Becomes a Chart
Colleagues, today we embark on an unusual journey—from an 18th-century Parisian salon straight into the MetaTrader terminal of 2026. And at the center of this journey lies a needle. An ordinary sewing needle, tossed onto a parquet floor.
Count de Buffon and His Immortal Needle
In 1733, the French naturalist Georges-Louis Leclerc, Count de Buffon, formulated a problem that, three centuries later, would force us to reconsider financial charts through an entirely new lens.
Imagine an infinite parquet floor. The planks are perfectly uniform, identical in width. You take a needle of length L and toss it randomly. What is the probability that the needle crosses the seam between the planks?
Buffon's answer: P = 2L / (π × D), where D is the width of a plank.
At first glance—pure geometry, an exercise for the curious mind. Yet this very formula would, centuries later, become a bridge between probability theory and price behavior within support and resistance channels.
From Needle to Perpendicular
Now let us complicate the experiment.
Imagine we drop the needle not randomly, but strictly perpendicular to the seams. The needle no longer rotates—it falls straight, like a plumb line. In this case, the probability of crossing depends solely on the ratio of the needle's length to the plank's width:
P = L / D
If the needle is shorter than the plank's width, the probability increases linearly with its length. If the needle is longer than the plank, it will always cross the line—but we are specifically interested in the domain where L < D, because in a real trading range, candles rarely span the entire channel width in a single movement.
Now imagine we toss not one needle, but a sequence. What is the probability that at least one of N needles crosses the line?
P(N) = 1 - (1 - L/D)^N
This function grows with each new toss. After 10 needles, the probability exceeds that after 3. After 30, it approaches unity. The market is anticipation. The longer price holds within a range, the higher the probability that the next candle will breach the boundary.
Red and Green: Diverging Probabilities
Now let us divide candles into two camps and examine their behavior at the upper boundary of the range—the resistance level.
A green candle is a needle falling point-up. A red candle falls blunt-down.
We calculate P(N) separately for green candles and separately for red candles. Then we compare these probabilities.
The Range as Parquet, Candles as Needles
Now we arrive at the central analogy.
Support and resistance lines are the seams between parquet planks. The price channel is the width of a plank. Each candle is a tossed needle. The time elapsed since the last touch of the level is the number of tosses.
If we construct a curve that accumulates breakout probabilities, accounting for: - The current distance to the level - The duration of consolidation
we obtain an indicator that does not follow price—it evaluates the very possibility of movement. It will not say "buy" or "sell." It will say: "Attention, the probability of a line crossing has reached 73%."
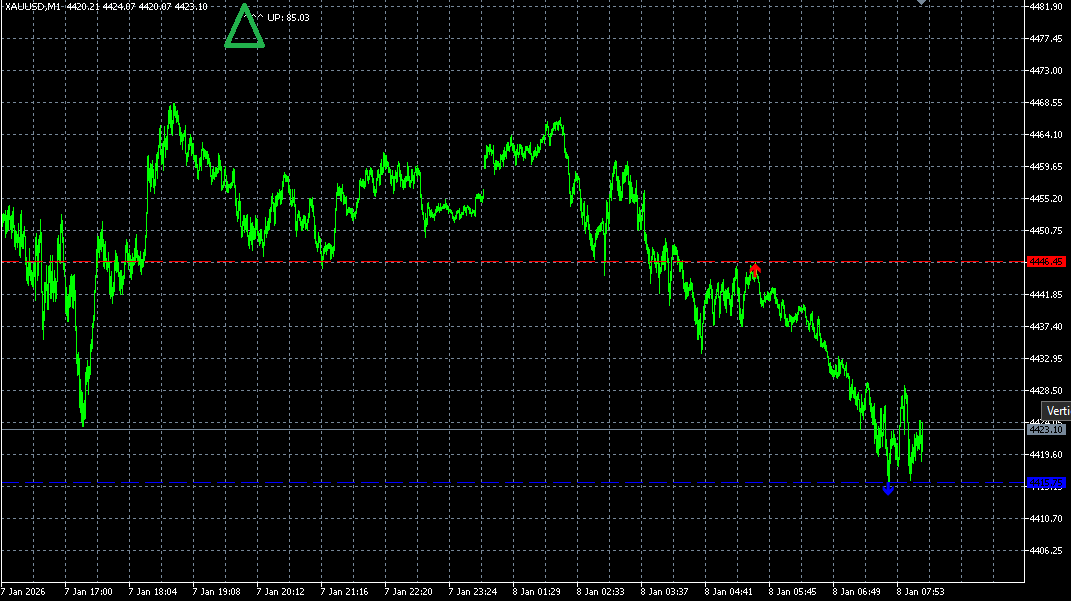
Now imagine that somewhere in the vast expanse of MQL5, an Expert Advisor already exists, quietly and unobtrusively trading gold. Hmm... could it be GOLD QUEEN? No one knows what lies inside. Forums barely mention it. Yet its equity curve crawls upward with astonishing consistency.
Some say neural networks. Some say volatility clustering. Others simply shrug.
What if, inside, it is merely Buffon's needle—tossed at just the right angle?
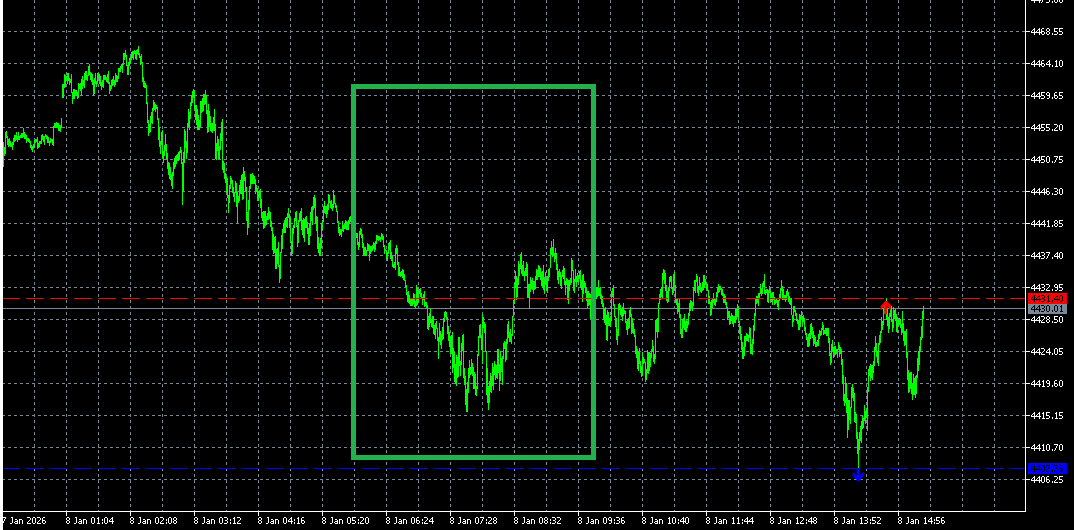
How can one verify this? Only by opening the code. Only by running the tests. Only by witnessing with one's own eyes how the EA responds to a long green candle at resistance—and comparing that response to what probability theory prescribes.
Coincidence? Pattern? Randomness?
The question remains open. Precisely until someone opens the trade log and matches the entries against the peaks of the probabilistic curve.
In Lieu of a Conclusion
We have grown accustomed to thinking of trading as a war of indicators, a battle of bulls and bears, a clash between fundamental and technical analysis. But sometimes it is useful to step away from the charts and imagine that all our work is merely an 18th-century parquet floor upon which an invisible hand tosses infinite needles.
The trader's task is not to predict where the next needle will fall. The trader's task is to discern whether it will cross the line.
And if Buffon taught us to calculate this probability for chaotic tosses, the market teaches us to calculate it for directed tosses. And this, you must admit, is an entirely different order of mathematics.
P.S. If this reading has stirred in you the urge to sketch a script testing the Buffon hypothesis on real candles—you are decidedly not alone. Share your results in the comments. The most unexpected discoveries will certainly find their way into our discussions.