Articles with examples of indicators developed in MQL5
The articles contain detailed explanation of the attached codes. Download and open them in MetaEditor and program together with the author while reading the article.
Add a new article

You are missing trading opportunities:
- Free trading apps
- Over 8,000 signals for copying
- Economic news for exploring financial markets
Registration
Log in
You agree to website policy and terms of use
If you do not have an account, please register

Price Action Analysis Toolkit Development (Part 51): Revolutionary Chart Search Technology for Candlestick Pattern Discovery
This article is intended for algorithmic traders, quantitative analysts, and MQL5 developers interested in enhancing their understanding of candlestick pattern recognition through practical implementation. It provides an in‑depth exploration of the CandlePatternSearch.mq5 Expert Advisor—a complete framework for detecting, visualizing, and monitoring classical candlestick formations in MetaTrader 5. Beyond a line‑by‑line review of the code, the article discusses architectural design, pattern detection logic, GUI integration, and alert mechanisms, illustrating how traditional price‑action analysis can be automated efficiently.

Automating Black-Scholes Greeks: Advanced Scalping and Microstructure Trading
Gamma and Delta were originally developed as risk-management tools for hedging options exposure, but over time they evolved into powerful instruments for advanced scalping, order-flow modeling, and microstructure trading. Today, they serve as real-time indicators of price sensitivity and liquidity behavior, enabling traders to anticipate short-term volatility with remarkable precision.

Price Action Analysis Toolkit Development (Part 50): Developing the RVGI, CCI and SMA Confluence Engine in MQL5
Many traders struggle to identify genuine reversals. This article presents an EA that combines RVGI, CCI (±100), and an SMA trend filter to produce a single clear reversal signal. The EA includes an on-chart panel, configurable alerts, and the full source file for immediate download and testing.

How can century-old functions update your trading strategies?
This article considers the Rademacher and Walsh functions. We will explore ways to apply these functions to financial time series analysis and also consider various applications for them in trading.

Price Action Analysis Toolkit Development (Part 49): Integrating Trend, Momentum, and Volatility Indicators into One MQL5 System
Simplify your MetaTrader 5 charts with the Multi Indicator Handler EA. This interactive dashboard merges trend, momentum, and volatility indicators into one real‑time panel. Switch instantly between profiles to focus on the analysis you need most. Declutter with one‑click Hide/Show controls and stay focused on price action. Read on to learn step‑by‑step how to build and customize it yourself in MQL5.

Price Action Analysis Toolkit Development (Part 48): Multi-Timeframe Harmony Index with Weighted Bias Dashboard
This article introduces the “Multi-Timeframe Harmony Index”—an advanced Expert Advisor for MetaTrader 5 that calculates a weighted bias from multiple timeframes, smooths the readings using EMA, and displays the results in a clean chart panel dashboard. It includes customizable alerts and automatic buy/sell signal plotting when strong bias thresholds are crossed. Suitable for traders who use multi-timeframe analysis to align entries with overall market structure.
Price Action Analysis Toolkit Development (Part 47): Tracking Forex Sessions and Breakouts in MetaTrader 5
Global market sessions shape the rhythm of the trading day, and understanding their overlap is vital to timing entries and exits. In this article, we’ll build an interactive trading sessions EA that brings those global hours to life directly on your chart. The EA automatically plots color‑coded rectangles for the Asia, Tokyo, London, and New York sessions, updating in real time as each market opens or closes. It features on‑chart toggle buttons, a dynamic information panel, and a scrolling ticker headline that streams live status and breakout messages. Tested on different brokers, this EA combines precision with style—helping traders see volatility transitions, identify cross‑session breakouts, and stay visually connected to the global market’s pulse.

Mastering Quick Trades: Overcoming Execution Paralysis
The UT BOT ATR Trailing Indicator is a personal and customizable indicator that is very effective for traders who like to make quick decisions and make money from differences in price referred to as short-term trading (scalpers) and also proves to be vital and very effective for long-term traders (positional traders).

Price Action Analysis Toolkit Development (Part 46): Designing an Interactive Fibonacci Retracement EA with Smart Visualization in MQL5
Fibonacci tools are among the most popular instruments used by technical analysts. In this article, we’ll build an Interactive Fibonacci EA that draws retracement and extension levels that react dynamically to price movement, delivering real‑time alerts, stylish lines, and a scrolling news‑style headline. Another key advantage of this EA is flexibility; you can manually type the high (A) and low (B) swing values directly on the chart, giving you exact control over the market range you want to analyze.

From Novice to Expert: Backend Operations Monitor using MQL5
Using a ready-made solution in trading without concerning yourself with the internal workings of the system may sound comforting, but this is not always the case for developers. Eventually, an upgrade, misperformance, or unexpected error will arise, and it becomes essential to trace exactly where the issue originates to diagnose and resolve it quickly. Today’s discussion focuses on uncovering what normally happens behind the scenes of a trading Expert Advisor, and on developing a custom dedicated class for displaying and logging backend processes using MQL5. This gives both developers and traders the ability to quickly locate errors, monitor behavior, and access diagnostic information specific to each EA.
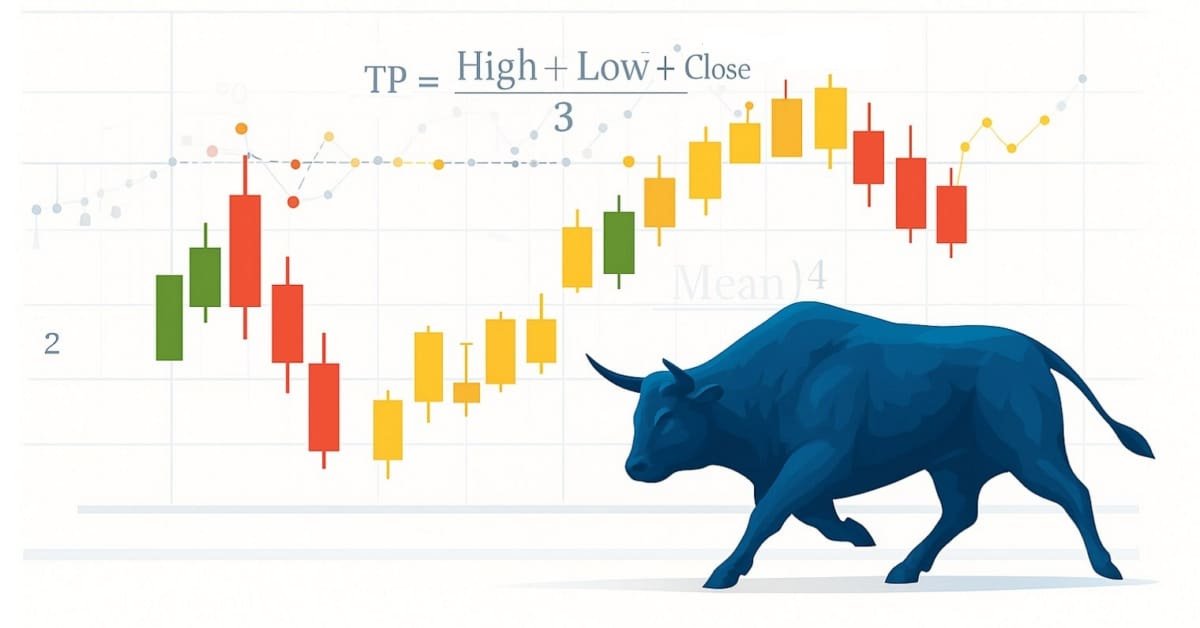
Price Action Analysis Toolkit Development (Part 41): Building a Statistical Price-Level EA in MQL5
Statistics has always been at the heart of financial analysis. By definition, statistics is the discipline that collects, analyzes, interprets, and presents data in meaningful ways. Now imagine applying that same framework to candlesticks—compressing raw price action into measurable insights. How helpful would it be to know, for a specific period of time, the central tendency, spread, and distribution of market behavior? In this article, we introduce exactly that approach, showing how statistical methods can transform candlestick data into clear, actionable signals.
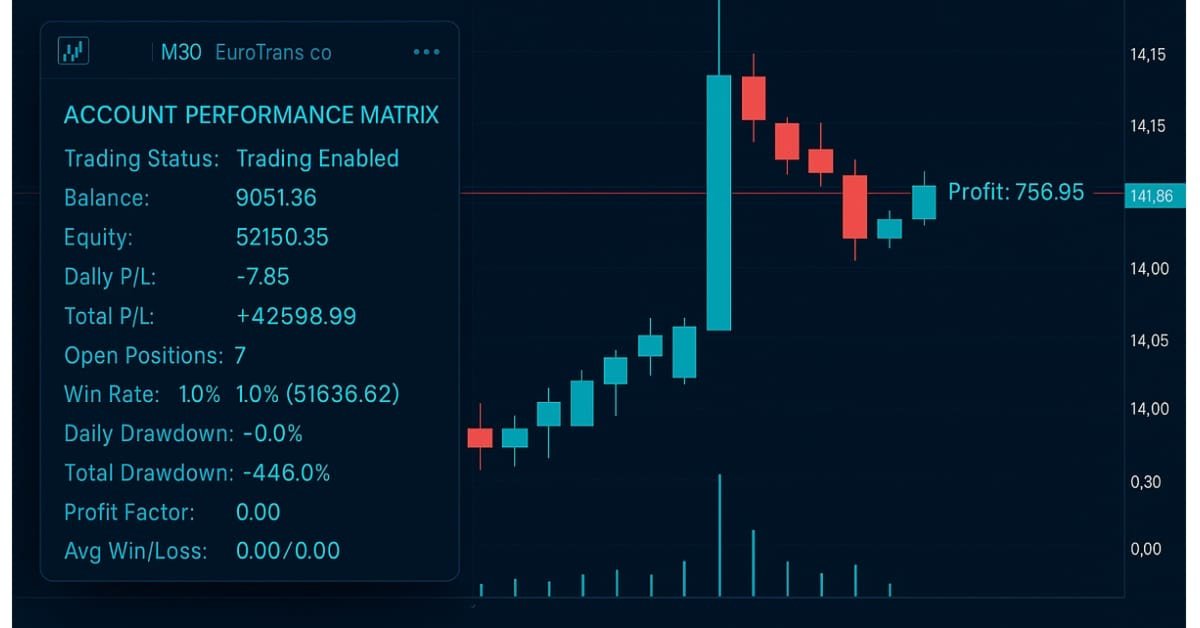
Developing A Custom Account Performance Matrix Indicator
This indicator acts as a discipline enforcer by tracking account equity, profit/loss, and drawdown in real-time while displaying a performance dashboard. It can help traders stay consistent, avoid overtrading, and comply with prop-firm challenge rules.

The Parafrac V2 Oscillator: Integrating Parabolic SAR with Average True Range
The Parafrac V2 Oscillator is an advanced technical analysis tool that integrates the Parabolic SAR with the Average True Range (ATR) to overcome limitations of its predecessor, which relied on fractals and was prone to signal spikes overshadowing previous and current signals. By leveraging ATR’s volatility measure, the version 2 offers a smoother, more reliable method for detecting trends, reversals, and divergences, helping traders reduce chart congestion and analysis paralysis.

Polynomial models in trading
This article is about orthogonal polynomials. Their use can become the basis for a more accurate and effective analysis of market information allowing traders to make more informed decisions.

Building a Professional Trading System with Heikin Ashi (Part 1): Developing a custom indicator
This article is the first installment in a two-part series designed to impart practical skills and best practices for writing custom indicators in MQL5. Using Heikin Ashi as a working example, the article explores the theory behind Heikin Ashi charts, explains how Heikin Ashi candlesticks are calculated, and demonstrates their application in technical analysis. The centerpiece is a step-by-step guide to developing a fully functional Heikin Ashi indicator from scratch, with clear explanations to help readers understand what to code and why. This foundational knowledge sets the stage for Part Two, where we will build an expert advisor that trades based on Heikin Ashi logic.
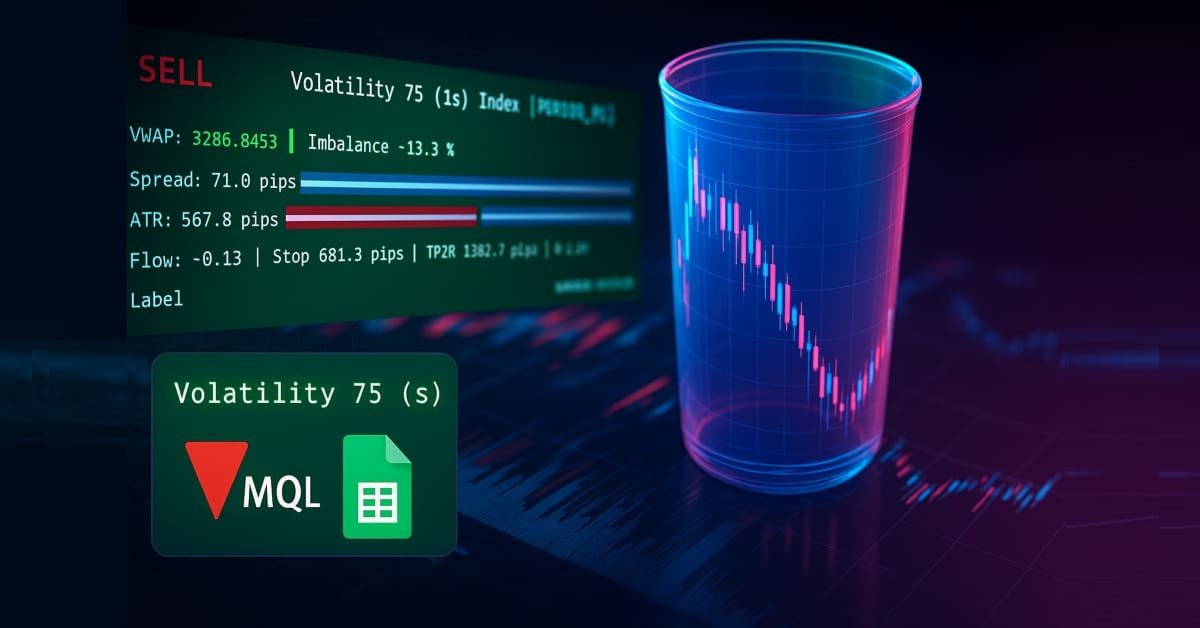
Price Action Analysis Toolkit Development (Part 38): Tick Buffer VWAP and Short-Window Imbalance Engine
In Part 38, we build a production-grade MT5 monitoring panel that converts raw ticks into actionable signals. The EA buffers tick data to compute tick-level VWAP, a short-window imbalance (flow) metric, and ATR-based position sizing. It then visualizes spread, ATR, and flow with low-flicker bars. The system calculates a suggested lot size and a 1R stop, and issues configurable alerts for tight spreads, strong flow, and edge conditions. Auto-trading is intentionally disabled; the focus remains on robust signal generation and a clean user experience.

Chart Synchronization for Easier Technical Analysis
Chart Synchronization for Easier Technical Analysis is a tool that ensures all chart timeframes display consistent graphical objects like trendlines, rectangles, or indicators across different timeframes for a single symbol. Actions such as panning, zooming, or symbol changes are mirrored across all synced charts, allowing traders to seamlessly view and compare the same price action context in multiple timeframes.
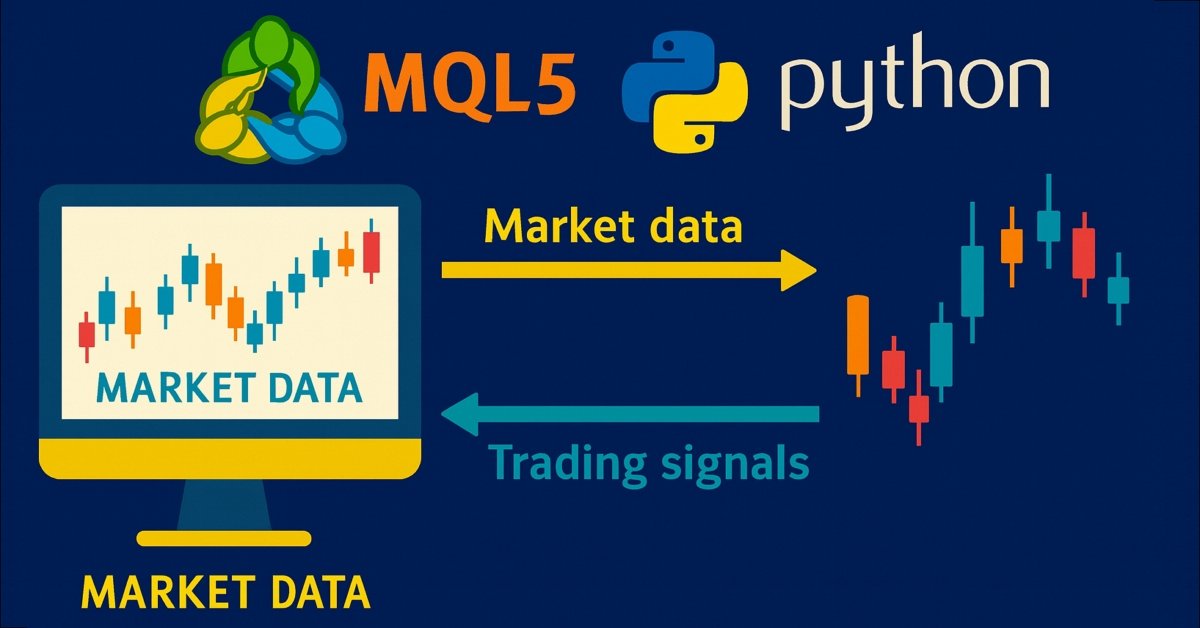
Price Action Analysis Toolkit Development (Part 36): Unlocking Direct Python Access to MetaTrader 5 Market Streams
Harness the full potential of your MetaTrader 5 terminal by leveraging Python’s data-science ecosystem and the official MetaTrader 5 client library. This article demonstrates how to authenticate and stream live tick and minute-bar data directly into Parquet storage, apply sophisticated feature engineering with Ta and Prophet, and train a time-aware Gradient Boosting model. We then deploy a lightweight Flask service to serve trade signals in real time. Whether you’re building a hybrid quant framework or enhancing your EA with machine learning, you’ll walk away with a robust, end-to-end pipeline for data-driven algorithmic trading.

Market Profile indicator (Part 2): Optimization and rendering on canvas
The article considers an optimized version of the Market Profile indicator, where rendering with multiple graphical objects is replaced with rendering on a canvas - an object of the CCanvas class.
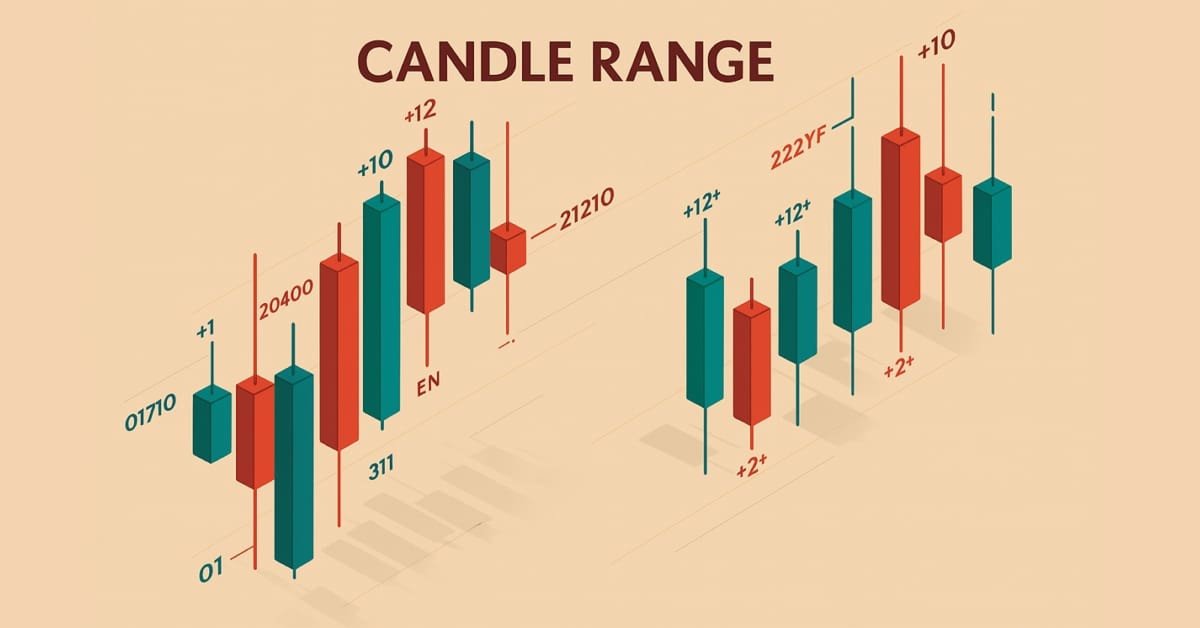
Price Action Analysis Toolkit Development (Part 33): Candle Range Theory Tool
Upgrade your market reading with the Candle-Range Theory suite for MetaTrader 5, a fully MQL5-native solution that converts raw price bars into real-time volatility intelligence. The lightweight CRangePattern library benchmarks each candle’s true range against an adaptive ATR and classifies it the instant it closes; the CRT Indicator then projects those classifications on your chart as crisp, color-coded rectangles and arrows that reveal tightening consolidations, explosive breakouts, and full-range engulfment the moment they occur.
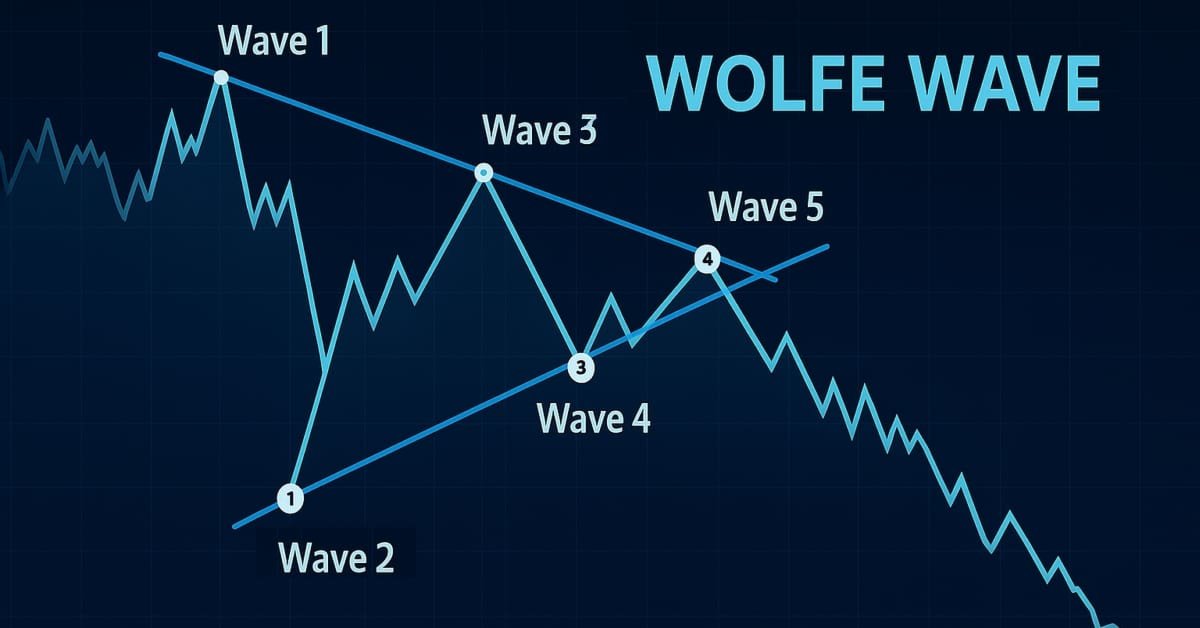
Introduction to MQL5 (Part 19): Automating Wolfe Wave Detection
This article shows how to programmatically identify bullish and bearish Wolfe Wave patterns and trade them using MQL5. We’ll explore how to identify Wolfe Wave structures programmatically and execute trades based on them using MQL5. This includes detecting key swing points, validating pattern rules, and preparing the EA to act on the signals it finds.

Creating 3D bars based on time, price and volume
The article dwells on multivariate 3D price charts and their creation. We will also consider how 3D bars predict price reversals, and how Python and MetaTrader 5 allow us to plot these volume bars in real time.
Price Action Analysis Toolkit Development (Part 32): Python Candlestick Recognition Engine (II) — Detection Using Ta-Lib
In this article, we’ve transitioned from manually coding candlestick‑pattern detection in Python to leveraging TA‑Lib, a library that recognizes over sixty distinct patterns. These formations offer valuable insights into potential market reversals and trend continuations. Follow along to learn more.
Market Profile indicator
In this article, we will consider Market Profile indicator. We will find out what lies behind this name, try to understand its operation principles and have a look at its terminal version (MarketProfile).

Price Action Analysis Toolkit Development (Part 31): Python Candlestick Recognition Engine (I) — Manual Detection
Candlestick patterns are fundamental to price-action trading, offering valuable insights into potential market reversals or continuations. Envision a reliable tool that continuously monitors each new price bar, identifies key formations such as engulfing patterns, hammers, dojis, and stars, and promptly notifies you when a significant trading setup is detected. This is precisely the functionality we have developed. Whether you are new to trading or an experienced professional, this system provides real-time alerts for candlestick patterns, enabling you to focus on executing trades with greater confidence and efficiency. Continue reading to learn how it operates and how it can enhance your trading strategy.
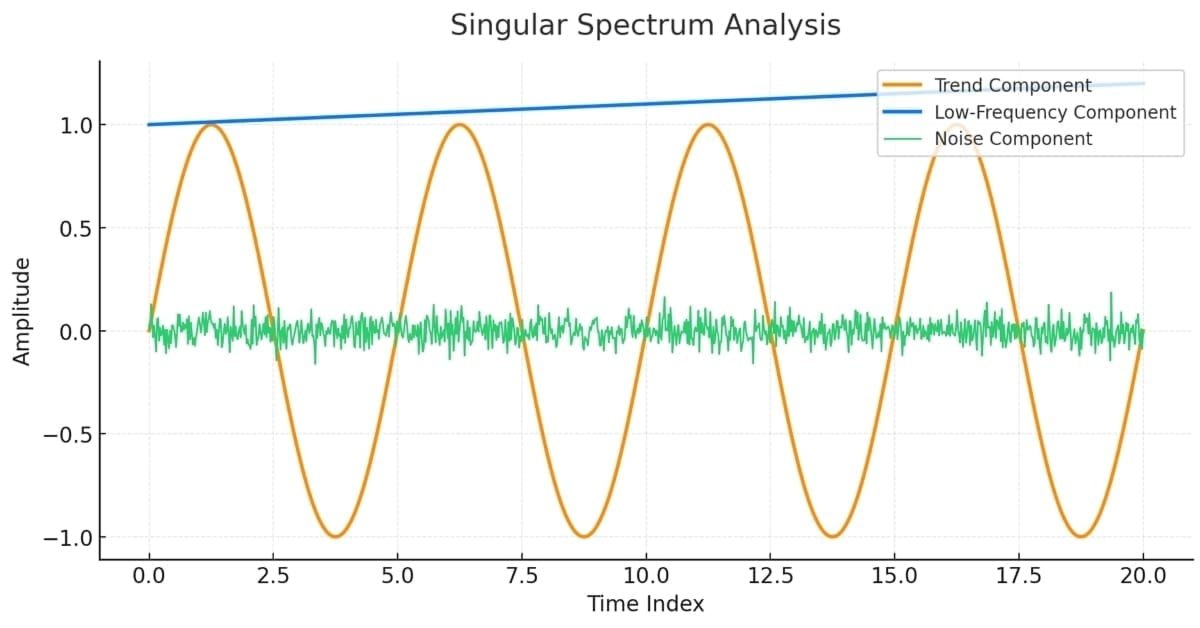
Singular Spectrum Analysis in MQL5
This article is meant as a guide for those unfamiliar with the concept of Singular Spectrum Analysis and who wish to gain enough understanding to be able to apply the built-in tools available in MQL5.

Price Action Analysis Toolkit Development (Part 30): Commodity Channel Index (CCI), Zero Line EA
Automating price action analysis is the way forward. In this article, we utilize the Dual CCI indicator, the Zero Line Crossover strategy, EMA, and price action to develop a tool that generates trade signals and sets stop-loss (SL) and take-profit (TP) levels using ATR. Please read this article to learn how we approach the development of the CCI Zero Line EA.

Moving Average in MQL5 from scratch: Plain and simple
Using simple examples, we will examine the principles of calculating moving averages, as well as learn about the ways to optimize indicator calculations, including moving averages.

Price Action Analysis Toolkit Development (Part 28): Opening Range Breakout Tool
At the start of each trading session, the market’s directional bias often becomes clear only after price moves beyond the opening range. In this article, we explore how to build an MQL5 Expert Advisor that automatically detects and analyzes Opening Range Breakouts, providing you with timely, data‑driven signals for confident intraday entries.

SQLite capabilities in MQL5: Example of a dashboard with trading statistics by symbols and magic numbers
In this article, we will consider creating an indicator that displays trading statistics on a dashboard by account and by symbols and trading strategies. We will implement the code based on examples from the Documentation and the article on working with databases.
Price Action Analysis Toolkit Development (Part 27): Liquidity Sweep With MA Filter Tool
Understanding the subtle dynamics behind price movements can give you a critical edge. One such phenomenon is the liquidity sweep, a deliberate strategy that large traders, especially institutions, use to push prices through key support or resistance levels. These levels often coincide with clusters of retail stop-loss orders, creating pockets of liquidity that big players can exploit to enter or exit sizeable positions with minimal slippage.

Price Action Analysis Toolkit Development (Part 26): Pin Bar, Engulfing Patterns and RSI Divergence (Multi-Pattern) Tool
Aligned with our goal of developing practical price-action tools, this article explores the creation of an EA that detects pin bar and engulfing patterns, using RSI divergence as a confirmation trigger before generating any trading signals.
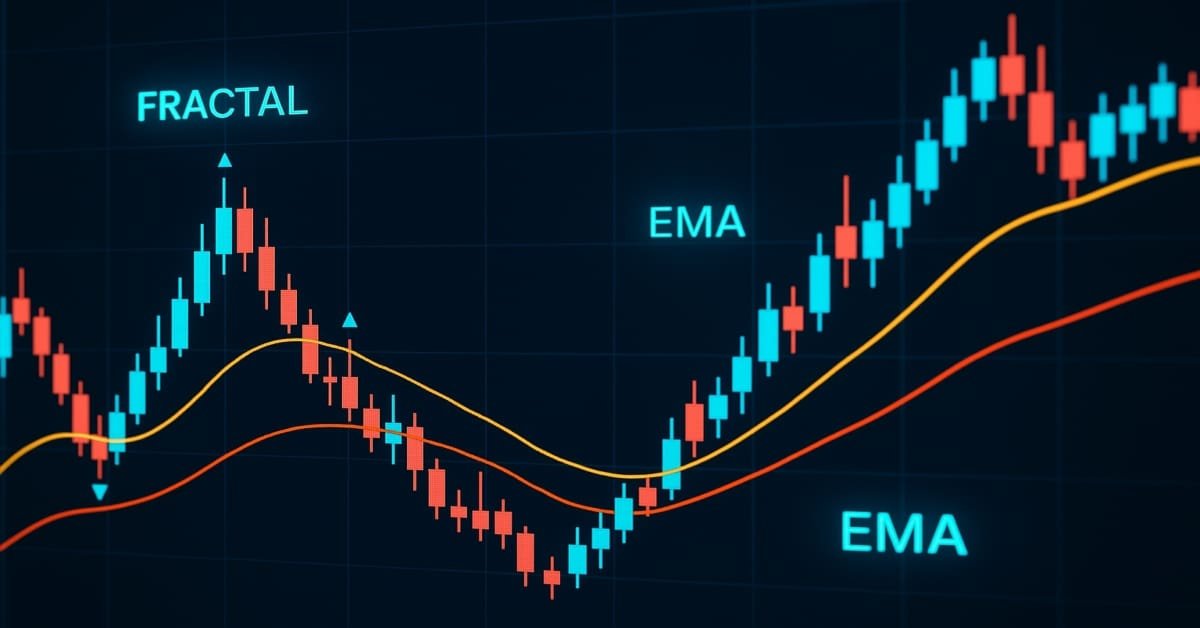
Price Action Analysis Toolkit Development (Part 25): Dual EMA Fractal Breaker
Price action is a fundamental approach for identifying profitable trading setups. However, manually monitoring price movements and patterns can be challenging and time-consuming. To address this, we are developing tools that analyze price action automatically, providing timely signals whenever potential opportunities are detected. This article introduces a robust tool that leverages fractal breakouts alongside EMA 14 and EMA 200 to generate reliable trading signals, helping traders make informed decisions with greater confidence.

From Novice to Expert: Auto-Geometric Analysis System
Geometric patterns offer traders a concise way to interpret price action. Many analysts draw trend lines, rectangles, and other shapes by hand, and then base trading decisions on the formations they see. In this article, we explore an automated alternative: harnessing MQL5 to detect and analyze the most popular geometric patterns. We’ll break down the methodology, discuss implementation details, and highlight how automated pattern recognition can sharpen a trader's market insights.

Price Action Analysis Toolkit Development (Part 24): Price Action Quantification Analysis Tool
Candlestick patterns offer valuable insights into potential market moves. Some single candles signal continuation of the current trend, while others foreshadow reversals, depending on their position within the price action. This article introduces an EA that automatically identifies four key candlestick formations. Explore the following sections to learn how this tool can enhance your price-action analysis.
Price Action Analysis Toolkit Development (Part 23): Currency Strength Meter
Do you know what really drives a currency pair’s direction? It’s the strength of each individual currency. In this article, we’ll measure a currency’s strength by looping through every pair it appears in. That insight lets us predict how those pairs may move based on their relative strengths. Read on to learn more.
Advanced Order Execution Algorithms in MQL5: TWAP, VWAP, and Iceberg Orders
An MQL5 framework that brings institutional-grade execution algorithms (TWAP, VWAP, Iceberg) to retail traders through a unified execution manager and performance analyzer for smoother, more precise order slicing and analytics.
Price Action Analysis Toolkit Development (Part 22): Correlation Dashboard
This tool is a Correlation Dashboard that calculates and displays real-time correlation coefficients across multiple currency pairs. By visualizing how pairs move in relation to one another, it adds valuable context to your price-action analysis and helps you anticipate inter-market dynamics. Read on to explore its features and applications.

Price Action Analysis Toolkit Development (Part 21): Market Structure Flip Detector Tool
The Market Structure Flip Detector Expert Advisor (EA) acts as your vigilant partner, constantly observing shifts in market sentiment. By utilizing Average True Range (ATR)-based thresholds, it effectively detects structure flips and labels each Higher Low and Lower High with clear indicators. Thanks to MQL5’s swift execution and flexible API, this tool offers real-time analysis that adjusts the display for optimal readability and provides a live dashboard to monitor flip counts and timings. Furthermore, customizable sound and push notifications guarantee that you stay informed of critical signals, allowing you to see how straightforward inputs and helper routines can transform price movements into actionable strategies.
From Novice to Expert: Programming Candlesticks
In this article, we take the first step in MQL5 programming, even for complete beginners. We'll show you how to transform familiar candlestick patterns into a fully functional custom indicator. Candlestick patterns are valuable as they reflect real price action and signal market shifts. Instead of manually scanning charts—an approach prone to errors and inefficiencies—we'll discuss how to automate the process with an indicator that identifies and labels patterns for you. Along the way, we’ll explore key concepts like indexing, time series, Average True Range (for accuracy in varying market volatility), and the development of a custom reusable Candlestick Pattern library for use in future projects.