
Using MATLAB 2018 computational capabilities in MetaTrader 5
Introduction
This article is a development of the article "Interaction between MetaTrader 4 and MATLAB" by A. Emelyanov, and it provides information on solving a similar task for modern 64-bit versions of all platforms utilized by users. Over the past period, the method for creating shared DLL libraries has been substantially upgraded in the MATLAB package. Therefore, the method discussed in the original article requires modification. This happened because MATLAB Compiler SDK or MATLAB Coder must now be used instead of MATLAB Compiler. In addition, the practice of working with dynamic memory in MATLAB has changed, which implies certain adjustments of the source code that addresses a library written in the MATLAB language.
The name of this article states that the work here is aimed at facilitating the developers' task of merging the computational capabilities of MATLAB with MQL5 programs. For this purpose, the article uses an example of creating a predictive indicator based on the Seasonal Autoregression Integrated Moving Average (SARIMA) model for a price timeseries, where the task of selecting an adequate model and extrapolating data is laid upon MATLAB.
To demonstrate the details of connecting the computational power of the MATLAB 2018 environment to MQL5, this article focuses on MATLAB Compiler SDK, as well as creating an adapter library on Visual C++ for pairing the MATLAB library with MQL5. This allows one to receive a quick guide to creating programs, and to avoid common mistakes on the way.
Simple and complex data types described in the chapter 1 of the article by A. Emelyanov are not changed. In order not to duplicate the qualitatively stated material, it is advisable to familiarize oneself with the description presented there. Differences arise at the stage of creating a shared C++ library from the MATLAB environment.
This article presents the material according to the following scheme:
- A C++ Shared Library with the Kalman filtering and data prediction based on the Seasonal Autoregression Integrated Moving Average model is created using a set of MATLAB modules preprepared for the indicator.
- Then the calculation module is included in the MQL5 program. To do this, an intermediary library is additionally created, which solves the problem of transferring data between MQL5 (with memory organized in C/C++ style) and MATLAB (with memory organized in matrix form).
- A predictive model is described, which is then embedded in the created indicator, and its performance is demonstrated.
1. Creating a shared C++ library from MATLAB functions using MATLAB Compiler SDK
In 2015, the procedure for creating DLL libraries in MATLAB has undergone changes. As for integration with MQL5 programs, the issue is brought down to that MATLAB Compiler is no longer intended for creating libraries, and is now oriented towards generating autonomous executable files. Since 2015, the functions for creating DLL libraries have been transferred to MATLAB Compiler SDK. MATLAB Compiler SDK has expanded the functionality of MATLAB Compiler, allowing it to create C/C++ shared libraries, Microsoft.NET assemblies, and Java classes from MATLAB programs.
As before, applications created using program components from the MATLAB Compiler SDK package can be redistributed free of charge among users who do not require MATLAB. These applications use MATLAB Runtime and a set of shared libraries that use compiled applications or MATLAB components.
The task previously assigned to the MATLAB Compiler application has been delegated to the Library Compiler program. To give complete picture, let us consider the procedure for creating a C/C++ shared library from the MATLAB environment. The ZIP archive attached to the article contains files with the .m extension, which were used for creating the library. In MATLAB, the Library Compiler application is launched (on the APPS tab), the LibSARIMA.prj project is opened and a structure is formed, similar to the one shown in the figure below.
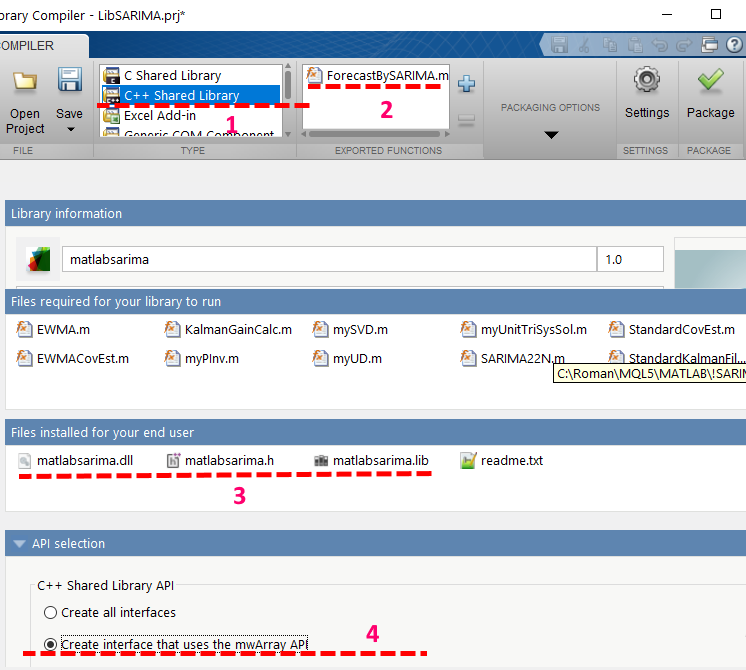
Fig. 1. Library Compiler interface.
Here, it is important to pay attention to positions highlighted in Figure 1 with lines and numbers 1-4.
- A shared library of the C++ standard is created
- The function presented in ForecastSARIMA.m is exported, while the other functions are not subjected to export and not given access to external programs.
- Files for linking in the standard interface are generated (matlabsarima.dll, matlabsarima.h, matlabsarima.lib).
- MATLAB matrix access interface is used through mwArray structures.
After pressing the "Package" button, the library will be generated. It is possible to select the library generation mode that requests users to download the MATLAB Engine from the Internet, or that includes the necessary MATLAB Engine components in the package content.
At this stage, a library will be created, that contains a program for filtering a time series, building a SARIMA model and forecasting. The archive MatlabSArima.zip provides a set of source codes and the resulting library build.
2. Creating an intermediary library in Microsoft Visual C++
Once the main library is created, the next task is to connect to it, pass the data and collect results after calculations. This involves creating an adapter library that provides data translation between MQL5 (with memory organized in C/C++ style) and MATLAB (with memory organized in matrix form).
In newer versions of MATLABx64, the Visual C++ compiler is among the main ones, for which all the necessary software is prepared. Therefore, the fastest, most convenient and reliable way to prepare the auxiliary adapter library is to use Visual C++ in Studio 2017.
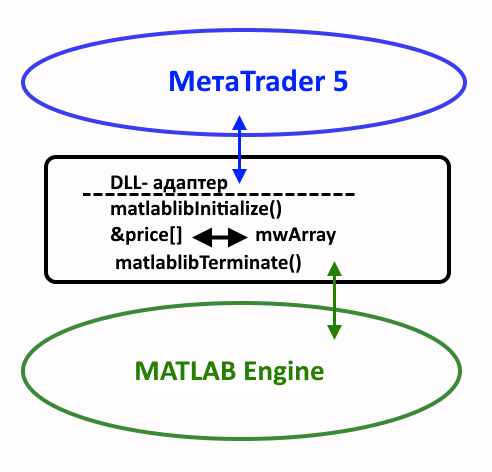
Fig. 2. Diagram of MetaTrader 5 and MATLAB 2018 interaction via an adapter DLL
An important innovation in 2017 was the introduction of such structures as mwArray API to MATLAB, which allow creating and integrating packaged functions to C++ applications. Previously used mxArray was upgraded to a new matrix interface. There is one more option for integrating a shared library — the MATLAB Data API interface, but it is irrelevant in our case.
To start writing the adapter for data, it is desirable to prepare and register three system environment variables in the operating system. For example, this can be done using Explorer through the "System properties", by going to "Advanced system settings" and "Environment Variables".
- The first variable — MATLAB_2018 should point to a directory with MATLAB or MATLAB Runtime installed;
- The second variable — MATLAB_2018_LIB64 should point to a directory containing external libraries: <MATLAB_2018>\extern\lib\win64;
- The third variable — MATLIB_USER should point to a directory where the original libraries are to be placed. This directory must also be added to the system variable "Path" in order to solve the problem of searching for the original user libraries.
2.1 Writing an adapter in Visual Studio 2017
After creating the project of the dynamic link library in Visual Studio 2017, it is necessary to set a number of properties. To make it clear which of the properties need to be controlled, below are figures to facilitate the configuration of the assembly project.
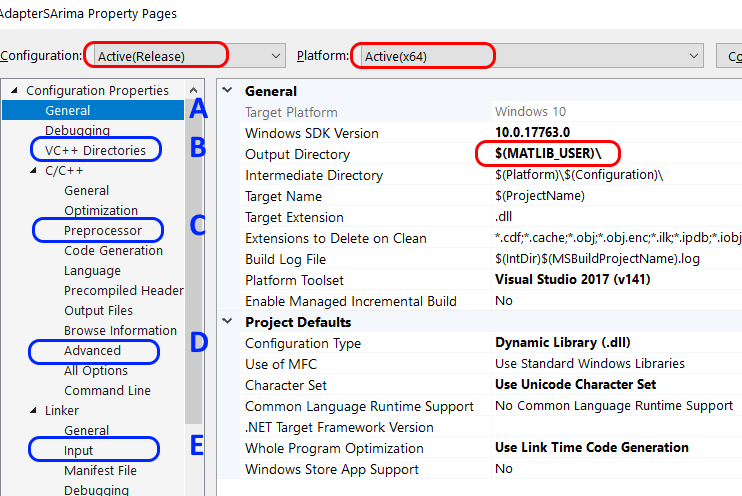
Fig. 3. Property pages (A, B, C, D, E) where changes are required
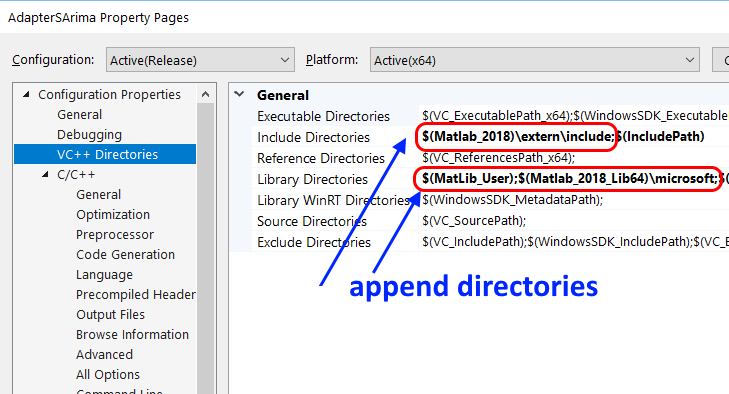
Fig. 4. Directories to search for the necessary project files
In Fig. 4, the $(MatLib_User) directory was added in the field labeled "Library Directories". This directory is convenient for placing general purpose libraries, which are needed both for programming in Visual C/C ++ and for calculations in MetaTrader 5. In this case, those are matlabsarima.lib and matlabsarima.dll.
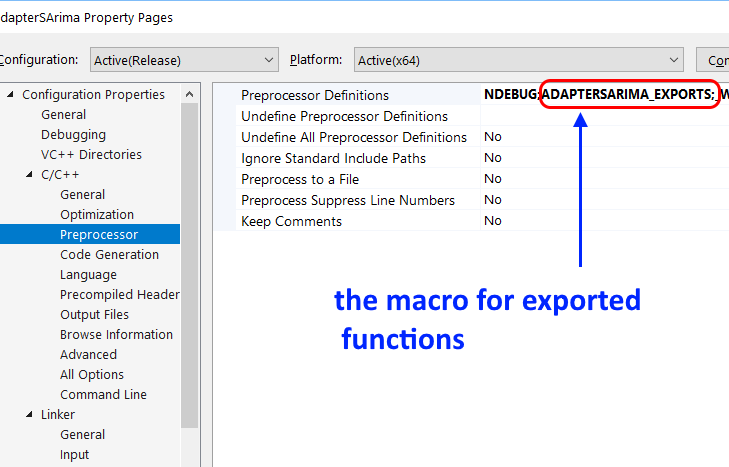
Fig. 5. Setting preprocessor definitions
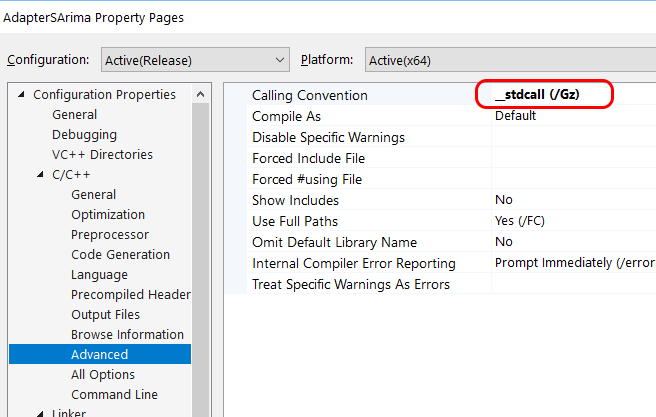
Fig. 6. Calling Convention according to the requirements of MQL5
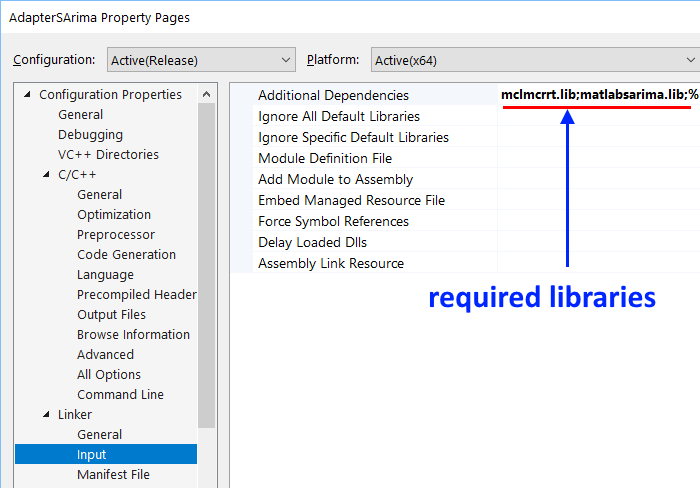
Fig. 7. Specifying additional dependencies (*.lib)
Here is a list of the required changes in the project settings:
- Specify the directories with the required header files;
- Specify the directories with the required library files;
- Set the preprocessor definitions — macro, its functions will be considered below;
- Specify specific libraries needed for work (prepared by MATLAB).
Two files generated using MATLAB — matlabsarima.lib and matlabsarima.dll should be placed to the shared directory, marked as $(MATLIB_USER) in the system variables. The file matlabsarima.h should be located in the directory where the project is assembled. It should be included in the project's "Header files".
To assemble the adapter, it will be necessary to create several files, two of which are worth considering.
1. The AdapterSArima.h file
#pragma once
#ifdef ADAPTERSARIMA_EXPORTS
#define _DLLAPI extern "C" __declspec(dllexport)  // this definition is necessary for pairing DLL and LIB libraries
#else
#define _DLLAPI extern "C" __declspec(dllimport)  // this definition is required for binding a DLL library
#endif
_DLLAPI int prepareSARIMA(void);
_DLLAPI int goSarima(double *Res, double *DataArray, int idx0, int nLoad, int iSeasonPriod = 28, int npredict = 25, int filterOn = 1, int PlotOn = 0);
_DLLAPI void closeSARIMA(void);
The AdapterSArima.h file uses a macro specified in the settings to indicate that the procedures prepareSARIMA(), closeSARIMA() and goSarima(...) are available for bundling with external programs
2. The GoSArima.cpp file
#pragma once
#include "stdafx.h"
#include "matlabsarima.h"
#include "AdapterSArima.h"

bool  SArimaStarted = false;
bool  MLBEngineStarted = false;

//-----------------------------------------------------------------------------------
_DLLAPI int prepareSARIMA(void)
{
        if (!MLBEngineStarted)
        {
                MLBEngineStarted = mclInitializeApplication(nullptr, 0);
                if (!MLBEngineStarted)
                {
                        std::cerr << "Could not initialize the Matlab Runtime (MCR)" << std::endl;
                        return 0;
                }
        }
        if (!SArimaStarted)
        {
                try
                {
                        SArimaStarted = matlabsarimaInitialize();
                        if (!SArimaStarted)
                        {
                                std::cerr << "Could not initialize the library properly" << std::endl;
                                return false;
                        }
                        return (SArimaStarted)?1:0;
                }
                catch (const mwException &e)
                {
                        std::cerr << e.what() << std::endl;
                        return -2;
                }
                catch (...)
                {
                        std::cerr << "Unexpected error thrown" << std::endl;
                        return -3;
                }
        }
        return 1;
}
//-----------------------------------------------------------------------------------

_DLLAPI void closeSARIMA(void)
{
        // Call the application and library termination routine
        //if (SArimaStarted)
        {
                matlabsarimaTerminate();
                SArimaStarted = false;
        }
}
//-----------------------------------------------------------------------------------

_DLLAPI int goSarima(double *Res, double *DataSeries, int idx0, int nLoad, int iSeasonPeriod, int npredict, int filterOn, int PlotOn)
{       //
        // Memory for the results must be allocated in advance, taking into account the forecast in the indicator
        // Memory for Res[] must be allocated. Length = nLoad+npredict !!!
        //
        if (!SArimaStarted)
        {
                SArimaStarted = (prepareSARIMA() > 0) ? true : false;
        }

        mwArray nSeries(1, 1, mxDOUBLE_CLASS), TimeHor(1, 1, mxDOUBLE_CLASS), MAlen(1, 1, mxDOUBLE_CLASS);
        mwArray SeasonLag(1, 1, mxDOUBLE_CLASS), DoPlot(1, 1, mxDOUBLE_CLASS), DoFilter(1, 1, mxDOUBLE_CLASS);

        if (SArimaStarted)
        {
                try
                {
                    MAlen  = 20;         // MA averaging window
                        DoFilter  = (filterOn != 0) ? 1 : 0;
                        TimeHor   = npredict; // prediction points
                        SeasonLag = iSeasonPeriod;     // seasonality period for the SARIMA model

                        DoPlot = PlotOn;    // plot in testing mode

                        nSeries = nLoad;    // data fragment length nLoad

                        mwArray Series(nLoad,1, mxDOUBLE_CLASS, mxREAL);
                        mwArray Result; // result (filtered (if specified filterOn!=0) data and forecast)

                //      load the data to the MATLAB matrix
                        Series.SetData(&DataSeries[idx0], nLoad); // fragment DataSeries[idx0: idx+nLoad]

                        ForecastBySARIMA(1, Result, nSeries, TimeHor, Series, SeasonLag, DoFilter, MAlen, DoPlot);
                        size_t nres = Result.NumberOfElements();
                        Result.GetData(Res, nres);

                  return 0;
                }
                catch (const mwException& e)
                {
                        std::cerr << e.what() << std::endl;
                        return -2;
                }
                catch (...)
                {
                        std::cerr << "Unexpected error thrown" << std::endl;
                        return -3;
                }
        }
        return 0;
}
For completeness, the zip archive contains all files for assembling the AdapterSArima.dll intermediary library. If necessary, it is recommended to unpack the archive and reassemble the adapter in "C:\temp".
3. Creating an indicator
3.1 Problem definition and solution method
The autoregression and moving average model is extremely useful for describing some of the timeseries encountered in practice. This model combines a low-pass filter in the form of a moving average of order q and autoregression of filtered values of the process of order p. If the model uses not the timeseries values but their difference of order d (in practice, it is necessary to determine d, but in most cases d ≤ 2) as input data, then the model is called the autoregression of the integrated moving average. Such a model — ARIMA(p,d,q) (autoregression integrated moving average) allows reducing the nonstationarity of the original series.
To simulate the effects of long-period variability, there is a modification called Seasonal ARIMA. This model corresponds to the timeseries exposed to periodic factors. Stock quotes are influenced by seasonality factors, therefore, their inclusion in the model is suitable for building a price forecast in the indicator.
In order to reduce the influence of noise factors in the incoming stock quotes, it is desirable to provide for the ability of additional filtering and cleaning the data from errors. The more noisy the data, the more difficult it is to process it. Kalman filter is an effective recursive filtering algorithm used in various fields. The algorithm consists of two repeating phases: prediction and adjustment. First, the forecast of the state at the next time point is calculated (taking into account the inaccuracy of measurement). Then, with consideration of the new information, the predicted value is corrected (also taking into account the inaccuracy and noise of this information).
3.2 Indicator program in MQL5
The AdapterSArima.dll and matlabsarima.dll libraries required for the indicator should be placed to the Libraries directory of the MetaTrader 5 working directory.
Debugging and testing have certain specifics. In this mode, MetaEditor launches the library from auxiliary directories "<MetaQuotes\Tester\....\Agent-127.0.0.1-300x>", where 300x takes the values 3000, 3001, 3002, etc. In this case, the AdapterSArima.dll library is copied automatically, but matlabsarima.dll is not. To prevent this from affecting the indicator operation, the matlabsarima.dll library should be placed in the system search directory. It was recommended to designate such a directory as $(MATLIB_USER) and specify it in the system list of search paths, or to copy to Windows or Windows\System32. Then the library will be detected, connected and the indicator will start.
The indicator program that implements prediction according to the considered model is available in the ISArimaForecast.mq5 file and in the attached archive.
//+------------------------------------------------------------------+
//|                                              ISArimaForecast.mq5 |
//|                                                Roman Korotchenko |
//|                                             https://www.mql5.com |
//+------------------------------------------------------------------+
#property copyright   "Roman Korotchenko"
#property link        "https://login.mql5.com/ru/users/Solitonic"
#property description "This indicator demonstrates forecast by model SARIMA(2,1,2)."
#property description "The program actively uses MATLAB with professionally developed toolboxes and the ability to scale."
#property version   "1.00"
#property indicator_chart_window

#import "AdapterSArima.dll"
int  prepareSARIMA(void);
int  goSarima(double &Res[],double &DataArray[],int idx0,int nLoad,int iSeasonPeriod,int npredict,int filterOn,int PlotOn);
void closeSARIMA(void);
#import

#property indicator_buffers 2    //---- Buffers for calculating and drawing the indicator
#property indicator_plots   1    //---- graphic constructions
#property indicator_type1  DRAW_COLOR_LINE
#property indicator_color1  clrChocolate, clrBlue // clrWhite, clrBlue
#property indicator_width1  3
//+------------------------------------------------------------------+
//|                                                                  |
//+------------------------------------------------------------------+
enum ENUM_TIMERECALC
  {
   TimeRecalc05 = 5,   // 5 sec
   TimeRecalc10 = 10,  // 10 sec
   TimeRecalc15 = 15,  // 15 sec
   TimeRecalc30 = 30,  // 30 sec
   TimeRecalc60 = 60   // 60 sec
  };
//--- input parameters
input ENUM_TIMERECALC RefreshPeriod=TimeRecalc30;         // Recalculate period
input int      SegmentLength  = 450; // N: Data fragment
input int      BackwardShift  = 0;   // Backward shift (testing)
input int      ForecastPoints = 25;  // Point to forecast
input int      SeasonLag=32;         // Season lag of SARIMA(2,1,2)
input bool     DoFilter=true;        // Do Kalman filtering of Data Series

                                     // input string   _INTERFACE_   = "* INTERFACE *";
//input long     magic_numb=19661021777;       // Magic Number

//--- indicator buffers
double   DataBuffer[],ColorBuffer[];
//double   LastTrend[],LastData[];

double   wrkResult[],wrkSegment[];
static int wRKLength;

uint CalcCounter;
//
uint calc_data;
uint start_data;    // Start time to build the chart
uint now_data;      // Current time

static int libReady=0,ErrorHFRange,ErrorDataLength;
static bool   IsCalcFinished;

//+------------------------------------------------------------------+
//| Custom indicator initialization function                         |
//+------------------------------------------------------------------+
static int LengthWithPrediction;

static int PlotOn;
//+------------------------------------------------------------------+
//|                                                                  |
//+------------------------------------------------------------------+
void OnDeinit()
  {
   closeSARIMA();
   Alert("SARIMA DLL - DeInit");
   Print("SARIMA DLL - DeInit");
  }
//+------------------------------------------------------------------+
//|                                                                  |
//+------------------------------------------------------------------+
int OnInit()
  {
   if(!TerminalInfoInteger(TERMINAL_DLLS_ALLOWED))
      Alert("Check the connection permission in the terminal settings DLL!");
   else
     {
      libReady=prepareSARIMA();
      if(libReady<0)
        {
         Alert("Dll DOES NOT CONNECTED!");
         return(INIT_FAILED);
        }

     }

   LengthWithPrediction=SegmentLength+ForecastPoints;
//--- indicator buffers mapping
   SetIndexBuffer(0,DataBuffer,INDICATOR_DATA);            ArraySetAsSeries(DataBuffer,true);
   SetIndexBuffer(1,ColorBuffer,INDICATOR_COLOR_INDEX);    ArraySetAsSeries(ColorBuffer,true);
// SetIndexBuffer(2,LastTrend,   INDICATOR_CALCULATIONS);   ArraySetAsSeries(LastTrend,true);      //for Expert
// SetIndexBuffer(3,LastData,    INDICATOR_CALCULATIONS);   ArraySetAsSeries(LastData,true);       //for Expert

   PlotIndexSetInteger(0,PLOT_SHIFT,ForecastPoints-BackwardShift);

   wRKLength = ForecastPoints+ SegmentLength; // The number of elements in the array with the results
   ArrayResize(wrkResult,wRKLength,0);        // Allocates memory for function results
   ArrayResize(wrkSegment,SegmentLength,0);   // Allocates memory for input data.

//---
   string shortname;
   StringConcatenate(shortname,"SARIMA(2,1,2). Season Lag: ",SeasonLag,"  // ");
//--- The label to display in DataWindow
   PlotIndexSetString(0,PLOT_LABEL,shortname);
   IndicatorSetString(INDICATOR_SHORTNAME,shortname);

   now_data  = 0.001*GetTickCount();
   start_data= 0.001*GetTickCount();
   calc_data = 0;

   CalcCounter    = 1;
   IsCalcFinished = true;

   ErrorHFRange   = 0;
   ErrorDataLength= 0;

   PlotOn=0; // Auxiliary drawing, executed by MATLAB (for testing)

   return(INIT_SUCCEEDED);
  }
//+------------------------------------------------------------------+
//| Custom indicator iteration function                              |
//+------------------------------------------------------------------+
int OnCalculate(const int rates_total,
                const int prev_calculated,
                const int begin,
                const double &price[]
                )
  {
//---
   int ShiftIdx=rates_total-SegmentLength-BackwardShift; // The starting index for the work segment data

   if(ShiftIdx<0)
     {
      if(!ErrorDataLength)
        {
         PrintFormat("SARIMA INDI FAULT: there are not enough data.");
         ErrorDataLength=1;
        }
      return(0);
     }

   ErrorDataLength=0;

//- - - - - - - - - - - - - - - - - - - - - - - - - - - - - -

   now_data=0.001*GetTickCount();

   if(now_data-calc_data<RefreshPeriod || !IsCalcFinished) // calculation is not needed or not completed
     {
      // ReloadBuffers(prev_calculated,rates_total);
      return(prev_calculated);
     }
   if(prev_calculated!=0 && !IsCalcFinished)
     {
      return(prev_calculated);  // New data comes faster than current calculation finished
     }
//---------------------------------------------------------------------------

   IsCalcFinished=false; // Block the request a new calculation until the current one is executed

   int idx=0,iBnd2=ShiftIdx+SegmentLength;
   for(int icnt=ShiftIdx; icnt<iBnd2; icnt++)
     {
      wrkSegment[idx++]=price[icnt];
     }

   ErrorHFRange=0;
// MATLAB SUBROUTINE
   goSarima(wrkResult,wrkSegment,0,SegmentLength,SeasonLag,ForecastPoints,DoFilter,PlotOn);

   ReloadBuffers(LengthWithPrediction,rates_total);

   ++CalcCounter;
   IsCalcFinished=true; // Ready to make new calculation

   calc_data=0.001*GetTickCount();

   return(rates_total);
  }
//+------------------------------------------------------------------+
//|                                                                  |
//+------------------------------------------------------------------+
void EmptyBuffers(int n)
  {
   for(int i=0; i<n; i++)
     {
      DataBuffer[i] = EMPTY_VALUE;
      ColorBuffer[i]= EMPTY_VALUE;
     }
  }
//+------------------------------------------------------------------+

void ReloadBuffers(int npoint,int ntotal)
  {
   ResetLastError();
   EmptyBuffers(ntotal); // ntotal = rates_total

   if(npoint== 0) return;
   int k=0;//BackwardShift;
   for(int i=0; i<npoint; i++) // npoint = LengthWithPrediction
     {
      if(i>=ntotal) break;
      DataBuffer [k]=wrkResult[LengthWithPrediction-1-i];
      ColorBuffer[k]=(i<ForecastPoints)? 1:0;
      k++;
     }
  }
//=============================================================================
4. Illustration of the indicator operation
Performance of the indicator was tested on the EURUSD H1 trading data, provided by the MetaTrader platform. A not too large segment of data was selected, equal to 450 units. Long-period "seasonal" lags equal to 28, 30 and 32 units were tested. The lag with a period of 32 units was the best of them on the considered period of history.
A series of calculations for different history fragments was performed. In the model, data segments length of 450 units, seasonal lag of 32 units and prediction length of 30 units were set once and did not change. To assess the quality of the forecast, the results obtained for different fragments were compared with actual data.
Below are the figures showing the result of the indicator operation. In all figures, the chocolate color indicates the completion of a fragment used for selecting the SARIMA(2,1,2) model in MATLAB, and the result obtained on its basis is shown in blue.
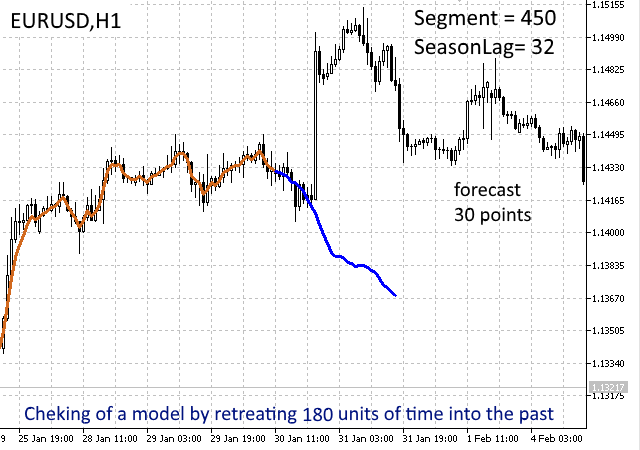
Fig. 8. Trading session 30.12.2018. Kalman filtering is used. Model built on data shifted 180 units to the past
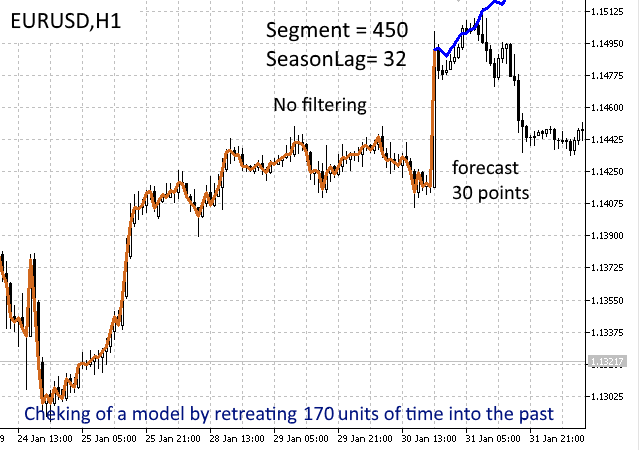
Fig. 9. Daily trading session 30.12.2018. Kalman filtering is not used. Model built on data shifted 170 units to the past
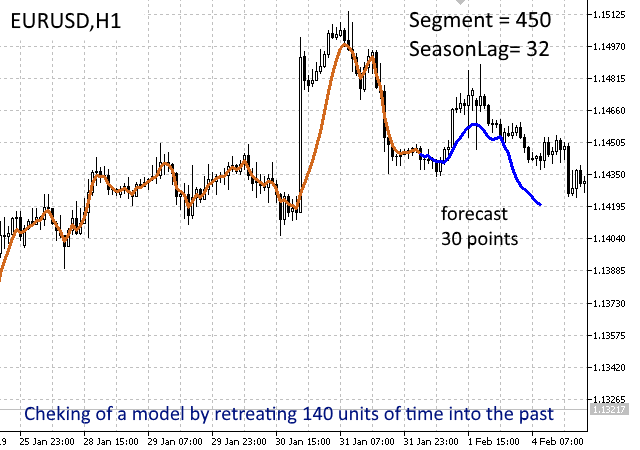
Fig. 10. Trading session 31.12.2018. Kalman filtering is used. Model built on data shifted 140 units to the past
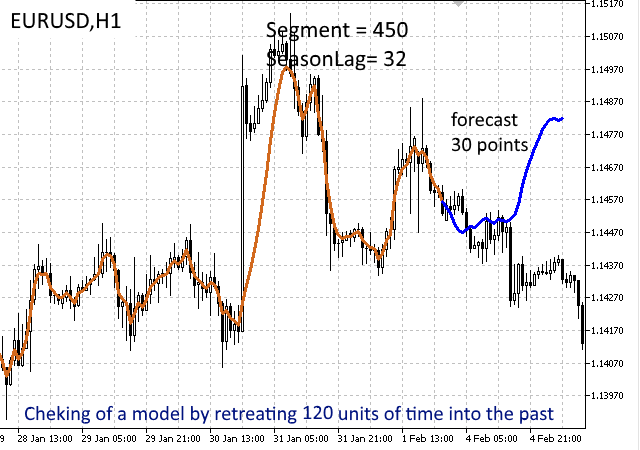
Fig. 11. Trading session 1.02.2019. Kalman filtering is used. Model built on data shifted 120 units to the past
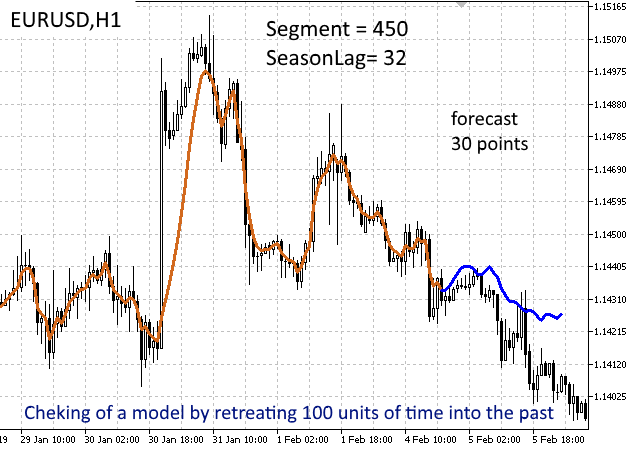
Fig. 12. Trading session 4.02.2019. Kalman filtering is used. Model built on data shifted 100 units to the past
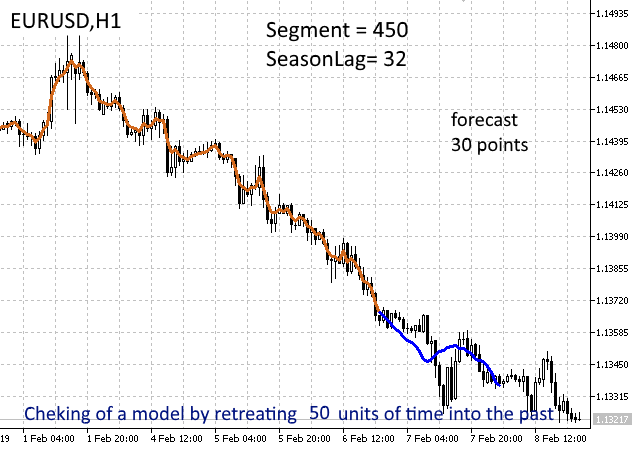
Fig. 13. Trading session 6.02.2019. Kalman filtering is used. Model built on data shifted 50 units to the past
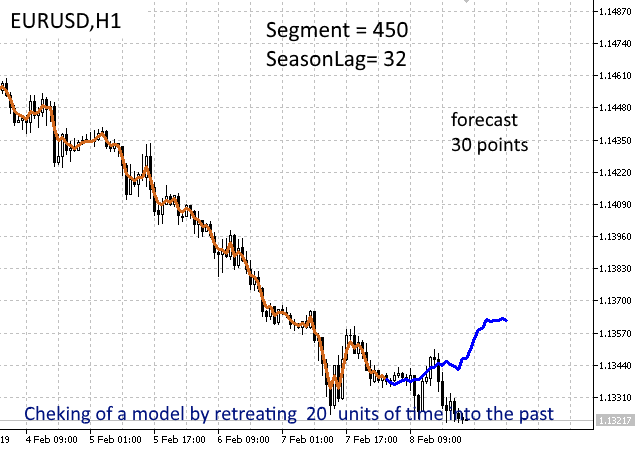
Fig. 14. Trading session 7.02.2019. Kalman filtering is used. Model built on data shifted 20 units to the past
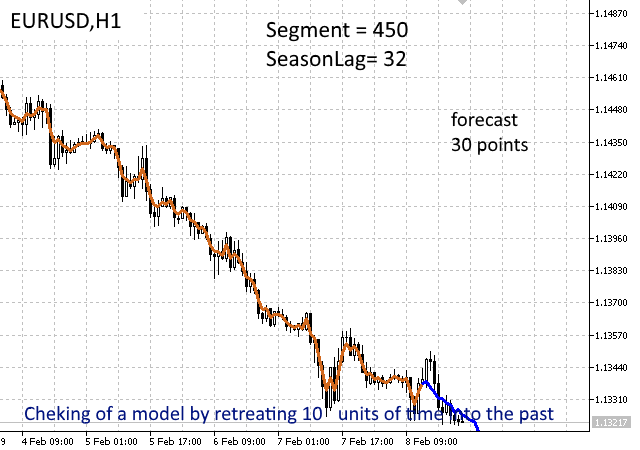
Fig. 15. Trading session 8.02.2019. Kalman filtering is used. Model built on data shifted 10 units to the past
The modeling results show a good probability of the prices, generated in the first 10-12 units, matching the values observed in real time. Moreover, interestingly enough, only a little works is required from traders to set up the model. Two parameters are required for the model — segment length and seasonality period, which can be selected using a successive sweep on the most recent history data. The rest of the calculated load goes to MATLAB. In the future, it is possible to consider the optimal selection of the parameters for the segment length and the seasonality period as a way of improving the indicator.
Conclusions
The article demonstrated the entire software development cycle using 64-bit versions of MQL5 and MATLAB 2018 packages. Additionally, it showed the use of Visual C++ 2017 (x64) for creating an adapter that provides data translation between MQL5 (with memory organized in C/C++ style) and MATLAB (with memory organized in matrix form).
The presented indicator with prediction based on the SARIMA model and Kalman filter serves to demonstrate the possibilities of using MATLAB in econometric applications. It has great potential for further development, provided a MATLAB-based processing of the obtained data and automated detection of the seasonal components in order to optimize the working predicting model.
The indicator considered as an example illustrated the use of MATLAB — the package that allows quickly and efficiently integrating MetaTrader systems with neural networks, fuzzy logic algorithms, as well as other complex and modern methods for processing stock quotes.
The attached archive (MatlabSArima.zip) contains the directory MatlabSArima\LibSARIMA\for_redistribution, which implies downloading the MATLAB Runtime from the Internet. To reduce the amount of information in the MATLAB Runtime for the SARIMA indicator, it is necessary to download a set of 10 files, then unpack and combine them using Total Commander.
| File | Download path |
|---|---|
| sarima_plusMCR00.zip 89.16 MB | https://pinapfile.com/aKrU7 |
| sarima_plusMCR01.zip 94.75 MB | https://pinapfile.com/fvZNS |
| sarima_plusMCR02.zip 94.76 MB | https://pinapfile.com/k7wB5 |
| sarima_plusMCR03.zip 94.76 MB | https://pinapfile.com/jwehs |
| sarima_plusMCR04.zip 94.76 MB | https://pinapfile.com/dv8vK |
| sarima_plusMCR05.zip 94.76 MB | https://pinapfile.com/hueKe |
| sarima_plusMCR06.zip 94.76 MB | https://pinapfile.com/c4qzo |
| sarima_plusMCR07.zip 94.76 MB | https://pinapfile.com/eeCkr |
| sarima_plusMCR08.zip 94.76 MB | https://pinapfile.com/jDKTS |
| sarima_plusMCR09.zip 94.76 MB | https://pinapfile.com/dZDJM |
Translated from Russian by MetaQuotes Ltd.
Original article: https://www.mql5.com/ru/articles/5572
Warning: All rights to these materials are reserved by MetaQuotes Ltd. Copying or reprinting of these materials in whole or in part is prohibited.
This article was written by a user of the site and reflects their personal views. MetaQuotes Ltd is not responsible for the accuracy of the information presented, nor for any consequences resulting from the use of the solutions, strategies or recommendations described.
 A DLL for MQL5 in 10 Minutes (Part II): Creating with Visual Studio 2017
 Developing a cross-platform grider EA
- Free trading apps
- Over 8,000 signals for copying
- Economic news for exploring financial markets
You agree to website policy and terms of use
What about integration with TradingView?
As far as I know, the community is about and for MT5. Not for other platforms. I suggest looking for a solution elsewhere.
As far as I know, the community is about and for MT5. Not for other platforms. I suggest looking for a solution elsewhere.
I think you need to take a course in text interpretation before posting your ridiculous and out-of-context suggestions.
You also need to grow up, because once again, you are more than amateurish, you are childish.
Finally, I suggest you read it 10000 times until you understand it, mane.
I think you need to take a course in interpreting text before posting your ridiculous and out-of-context suggestions.
You also need to grow up, because once again, you're more than amateurish, you're childish.
Finally, I suggest you read it 10000 times until you understand it, mane.
kkkkkkkkkkk poor thing. Even a five-year-old would understand. Anyone who enters here will understand better than you who think you'll find things from another platform here.
Grow up and reach maturity, mane. Know where to look. This is no place for other platforms.
If anyone has tried this successfully, please let me know.
Unfortunately, the author does not respond in the English article. And communicating with the transer is not easy.
Hi Christian, have you solved the problem in the meantime? I'm facing the same thing...
No, I haven't. But the runtime environment has been re-uploaded in the Russian forum. There were probably missing files.
As is very often the case. The article creators don't bother to test it themselves with a fresh Windows.
I have now implemented my own MatLab project.