Exploring options for creating multicolored candlesticks

Introduction
In this article I will address the possibilities of creating customized indicators with candlesticks charts, pointing out their advantages and disadvantages. I will address this subject in 4 topics:
1-Construction of candles with only one color without distinguishing between high and low candles.
2-Construction of multicolored candles, colored according to some business rule.
3-Construction of candles with and without filling, with a distinction between the color of the filling and the color of the edges of the candles.
4-Construction of multicolored candles with and without filling.
Firstly, we need to clarify the reasons for the implementation of coloring rules in candle charts, as well as the importance of the proper choice for the creation of your indicator. Each method has its particularities, advantages and disadvantages, either due to the user's interaction with the program, or due to the optimization of hardware use by the program.
Let us first consider an operating model that works with 3 displaced price lines. The first line (black) is the price itself, the second (blue) is a 1-period moving average shifted 10 periods ahead and the third (red) is a 1-period moving average shifted 20 periods ahead. The construction of the model on a price graph can be seen below, where I inserted two moving averages and changed the price graph to line.
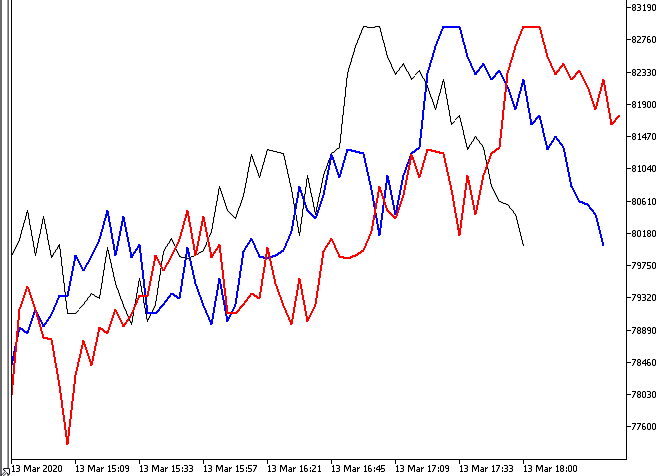
At first glance this is an unfriendly model, difficult to interpret, as it needs to identify not only the color of the lines but also the relationship between them. This often causes confusion and mistakes in decision making. Another model that can cause confusion and errors is the Directional Movement Index indicator, for the same reason, the need to identify not only the color of the lines but also the relationship between them.
In fact, the greater the number of variables or indicators to be considered, the more frequent the errors of interpretation will be, making decisions and results inconsistent. We can use as many indicators and variables as we want, as long as we make this data into objective information that is easy to understand.
The use of coloring rules is an efficient way of condensing all information in order to tell us exactly what we want to know: when we can buy, sell, and when we should be out of the market. So we can synthesize the information in 3 colors. One for purchase, one for sale and one for when there are no conditions to buy or sell. In this article I will work with green for purchase, red for sale and yellow in other cases. This is summarized in the table below.
| Color | Direction |
|---|---|
| green | buy |
| red | sell |
| yellow | neutral |
At this point let's forget about the trading rules behind the candle coloring rule and let's see how to build candle graphs in MQL5. If this is your first time creating a program for MetaTrader 5 in MQL5, I recommend consulting the help of MetaEditor, the MetaTrader 5 development environment.
Building candlestick chart
At this point I will demonstrate how to build a simple candlestick chart and explain some basic features. A candlestick chart consists of a series of candlesticks. Each candle is formed by four prices, the opening, maximum, minimum, and closing of the period. In order to know whether there is a high or low in the period in question, it is verified whether the closing is greater or less than the opening price. If it is a high candle we will color it green and if it is low we will color it red.
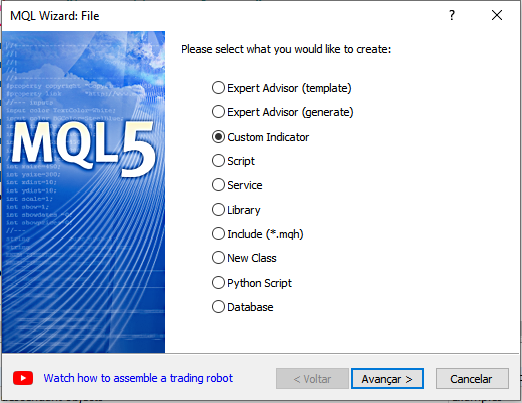
Let's start by creating an indicator with the MQL Wizard.
We give our indicator a name and change the copyright information, that is, the author's name and address for a web page.
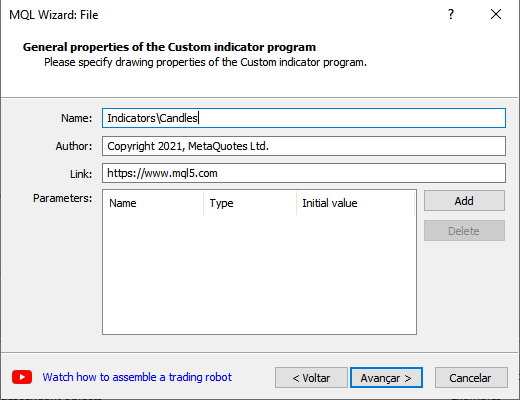
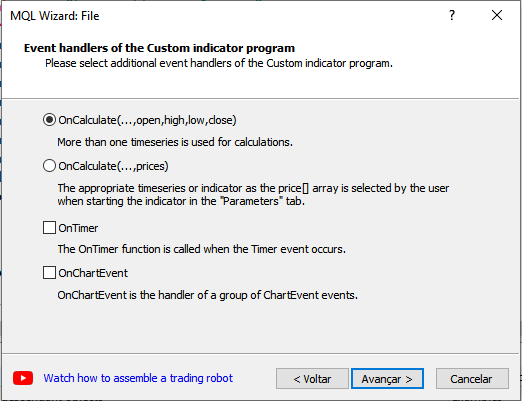
We will use the OnCalculate function that contains the opening, maximum, minimum and closing price series.
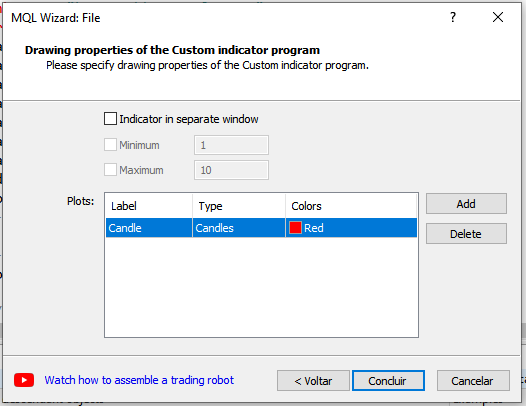
As our indicator will be a candlestick chart, let's choose the CANDLES chart in "type", and rename the label for Candles. This name is used both for the user interface and for handling indicator buffers.
This is the code produced by our MQL Wizard.
//+------------------------------------------------------------------+
//|                                                      Candles.mq5 |
//|                                  Copyright 2021, MetaQuotes Ltd. |
//|                                             https://www.mql5.com |
//+------------------------------------------------------------------+
#property copyright "Copyright 2021, MetaQuotes Ltd."
#property link      "https://www.mql5.com"
#property version   "1.00"
#property indicator_chart_window
#property indicator_buffers 4
#property indicator_plots   1
//--- plot Candle
#property indicator_label1  "Candle"
#property indicator_type1   DRAW_CANDLES
#property indicator_color1  clrRed
#property indicator_style1  STYLE_SOLID
#property indicator_width1  1
//--- indicator buffers
double         CandleBuffer1[];
double         CandleBuffer2[];
double         CandleBuffer3[];
double         CandleBuffer4[];
//+------------------------------------------------------------------+
//| Custom indicator initialization function                         |
//+------------------------------------------------------------------+
int OnInit()
  {
//--- indicator buffers mapping
   SetIndexBuffer(0,CandleBuffer1,INDICATOR_DATA);
   SetIndexBuffer(1,CandleBuffer2,INDICATOR_DATA);
   SetIndexBuffer(2,CandleBuffer3,INDICATOR_DATA);
   SetIndexBuffer(3,CandleBuffer4,INDICATOR_DATA);

//---
   return(INIT_SUCCEEDED);
  }
//+------------------------------------------------------------------+
//| Custom indicator iteration function                              |
//+------------------------------------------------------------------+
int OnCalculate(const int rates_total,
                const int prev_calculated,
                const datetime &time[],
                const double &open[],
                const double &high[],
                const double &low[],
                const double &close[],
                const long &tick_volume[],
                const long &volume[],
                const int &spread[])
  {
//---

//--- return value of prev_calculated for next call
   return(rates_total);
  }
//+------------------------------------------------------------------+
Now just compile the code and our Candles indicator will be available in our file browser in MetaTrader 5. However, when you place it on the price chart it is not displayed correctly, as we do not assign values to the indicator buffers. So let's do this. In this first method we have 4 buffers: CandleBuffer1 [], CandleBuffer2 [], CandleBuffer3 [], CandleBuffer4 []; The use of these buffers is explained in the following table.
| buffers | price series |
|---|---|
| CandleBuffer1 | Open prices |
| CandleBuffer2 | Higher prices |
| CandleBuffer3 | Lower prices |
| CandleBuffer4 | Close prices |
The number of buffers needs to be spelled out in our code through the indicator_buffers property. This work has already been done by the MQL Wizard, however you can change the number of buffers according to the need of the indicator. We will do that later.
#property copyright "Copyright 2021, MetaQuotes Ltd."
#property link      "https://www.mql5.com"
#property version   "1.00"
#property indicator_chart_window
#property indicator_buffers 4
We will assign values to our buffers in the OnCalculate function using a loop running the entire price range. However, once a value has been assigned, it does not need to be reassigned when the size of the series grows. That is, if in a function call we have n candles and in the next call we have n + 1, we just need to calculate the values for the last candle. In the OnCalcultate function, the number of candles in the graph is informed by the rates_total parameter and the number of candles that were in the graph in the last call of the function by the prev_calculated parameter.
This is the result of working on the OnCalculate function.
//+------------------------------------------------------------------+
//| Custom indicator iteration function                              |
//+------------------------------------------------------------------+
int OnCalculate(const int rates_total,
                const int prev_calculated,
                const datetime &time[],
                const double &open[],
                const double &high[],
                const double &low[],
                const double &close[],
                const long &tick_volume[],
                const long &volume[],
                const int &spread[])
  {
//---
   int start = prev_calculated;
   if(start>=rates_total)
      start = rates_total-1;

   for(int i = start; i<rates_total; i++)
     {
      CandleBuffer1[i]=open[i];
      CandleBuffer2[i]=high[i];
      CandleBuffer3[i]=low[i];
      CandleBuffer4[i]=close[i];
     }
//--- return value of prev_calculated for next call
   return(rates_total);
  }
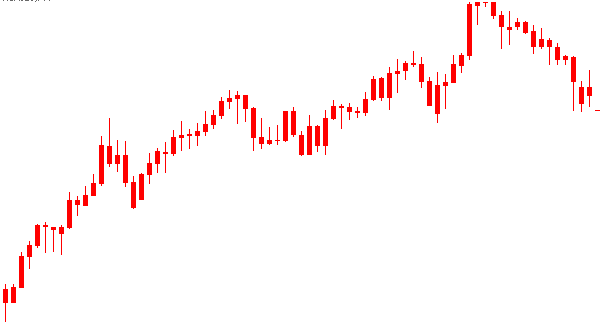
Note that in our indicator all candles are in red, which is the color we defined in the MQL Wizard. However, this color can be changed by the user, as well as it can be changed in our code through the indicator_color1 property. To learn more about defining and working with colors in MQL5 see the documentation on data of Type Color.
//--- plot Candle
#property indicator_label1  "Candle"
#property indicator_type1   DRAW_CANDLES
#property indicator_color1  clrRed
#property indicator_style1  STYLE_SOLID
#property indicator_width1  1
Building multicolored candlestick chart
So far we have seen the creation of a candlestick chart, without distinguishing colors, or low and high candles. We will now see how to make multicolored, colored candles following some business rule. But first, we will use a rule to differentiate high and low candles only by color.
You can see that we use the DRAW_CANDLES drawing type, defined in the indicator properties in indicator_type1. We can change this property to DRAW_COLOR_CANDLES in order to work with multicolored candles. As the type of drawing DRAW_COLOR_CANDLES needs to store the colors for each candle, we have an additional buffer that we will call CandleColor. And our buffer number increases to 5. In addition, we need to add a color for the indicator_color1 property.
#property copyright "Copyright 2021, MetaQuotes Ltd."
#property link      "https://www.mql5.com"
#property version   "1.00"
#property indicator_chart_window
#property indicator_buffers 5
#property indicator_plots   1
//--- plot Candle
#property indicator_label1  "Candle"
#property indicator_type1   DRAW_COLOR_CANDLES
#property indicator_color1  clrGreen,clrRed
#property indicator_style1  STYLE_SOLID
#property indicator_width1  1
//--- indicator buffers
double         CandleBuffer1[];
double         CandleBuffer2[];
double         CandleBuffer3[];
double         CandleBuffer4[];
double         CandleColor[];
Then we initialize the new CandleColor buffer that will store the colors of the candles, informing the compiler that we want to use this buffer to store colors. We do this through the function SetIndexBuffer passing as parameter INDICATOR_COLOR_INDEX. In our case with two colors, green and red, the first color has index 0, the second, index 1. If we define n colors in indicator_color1 we will have the color indexes from 0 to n-1;
//+------------------------------------------------------------------+
//| Custom indicator initialization function                         |
//+------------------------------------------------------------------+
int OnInit()
  {
//--- indicator buffers mapping
   SetIndexBuffer(0,CandleBuffer1,INDICATOR_DATA);
   SetIndexBuffer(1,CandleBuffer2,INDICATOR_DATA);
   SetIndexBuffer(2,CandleBuffer3,INDICATOR_DATA);
   SetIndexBuffer(3,CandleBuffer4,INDICATOR_DATA);
   SetIndexBuffer(4,CandleColor,INDICATOR_COLOR_INDEX);

//---
   return(INIT_SUCCEEDED);
  }
Note that these changes can be made directly in the MQL Wizard which defines and initializes the buffers, as well as the number of buffers required. Just change the drawing type parameter to DRAW_COLOR_CANDLES and its colors in the MQL Wizard window. This is a very useful procedure when you want to work with indicators that plot more than one type of drawing on the graph. We will see this later.
Now we need to assign values to the CandleColor buffer. Let us consider as a coloring rule that the closure is greater than the opening of the candle, so it must be green, otherwise it must be red. Let's see what this looks like within the OnCalculate function.
   for(int i = start; i<rates_total; i++)
     {
      CandleBuffer1[i]=open[i];
      CandleBuffer2[i]=high[i];
      CandleBuffer3[i]=low[i];
      CandleBuffer4[i]=close[i];

      //if the close price is higher than the open price we set the
      //green color (index 0), otherwise, the red color (index 1)
      CandleColor[i]=(close[i]>open[i])?0:1;
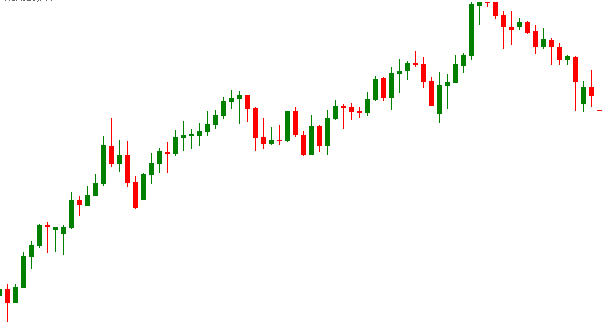
As expected the result is a standard chart, distinguishing between bullish and bearish candles.
Let's change our coloring rule. Instead of differentiating high and low candles, we will use a very simple trading rule, as we will see another way to differentiate high and low candles in the next topic.
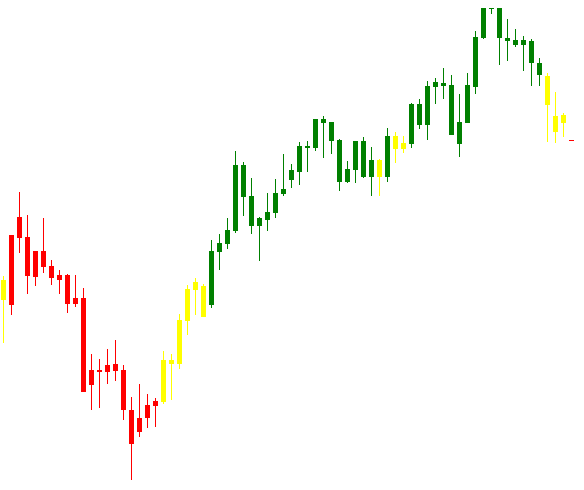
Let us consider the operational model presented at the beginning of the article. We have as business rules that if the black line (closing price) is greater than the blue line (closing shift in 10 periods) and the red line (closing shift in 20 periods), then we want to buy. If the black line (closing price) is less than the blue line and the red line, then we want to sell. In other cases, we must wait for a definition on the direction of the market. This rule is summarized in the following table.
| trading rules | Candlestick color |
|---|---|
| close[0] > close[10] and close[0] > close[20] | green |
| close[0] < close[10] and close[0] < close[20] | red |
| close[0] > close[10] and close[0] < close[20] | yellow |
| close[0] < close[10] and close[0] > close[20] | yellow |
For this model we need to add one more color to the indicator_color1 property.
#property indicator_color1 clrGreen,clrRed,clrYellow
We can now define our rule in our code and assign values according to it. This is the result inside the OnCalculate function;
  {
//---
   int start = prev_calculated;
   if(prev_calculated<20)
      start = 20;
   if(start>=rates_total)
      start = rates_total-1;

   for(int i = start; i<rates_total; i++)
     {
      CandleBuffer1[i]=open[i];
      CandleBuffer2[i]=high[i];
      CandleBuffer3[i]=low[i];
      CandleBuffer4[i]=close[i];

      //Close[0] > Close[10] and Close[0] > Close[20]
      bool buy = close[i]>close[i-10] && close[i]>close[i-20];

      //Close[0] < Close[10] and Close[0] < Close[20]
      bool sell  = close[i]<close[i-10] && close[i]<close[i-20];

      CandleColor[i]=(buy)?0:(sell)?1:2;
     }
//--- return value of prev_calculated for next call
   return(rates_total);
  }
This is the result of our new indicator.
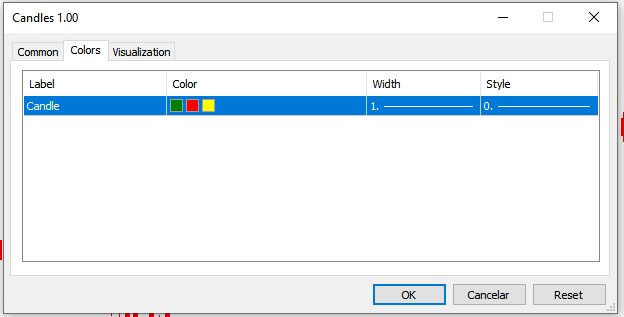
Now, let's look at the user interface in the indicator parameter window in Metatrader 5. Double clicking on the indicator inside the price chart will open the parameter window. We can see in the image below that the colors are passed as a parameter without informing which color refers to the purchase condition, the sale condition and the neutral condition. If we want to work with more colors, 6 colors for example, this can be confusing for the user. So we need to explain to the user what each color refers to. We will do this in the last topic of this article.
Construction of candlestick chart with and without filling
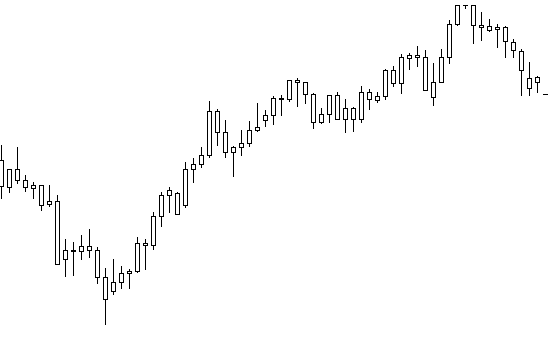
Let us return to our initial code, with candles of a single color. Remember that we used the DRAW_CANDLES design type, with 4 buffers. We can distinguish between the fill color and the color of the candle borders simply by defining two colors in our indicator_color1 property. So the first color will be used for the edges and the second for filling the candles. For demonstration let's see the result in black and white.
#property indicator_type1   DRAW_CANDLES
#property indicator_color1  clrBlack,clrWhite
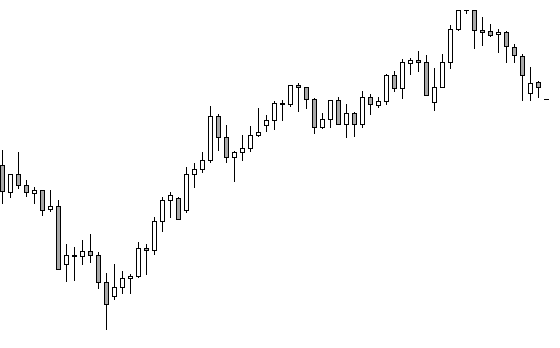
If we define 3 colors in our indicator_color1 property, we now have a distinction between bullish and bearish candles. This form of construction of the candles replaces the first coloring rule that we created in this article. The big difference is that we continue with 4 buffers, and we can define the color of the edges. In this case, the first color is applied to the edges of the candles, the second to fill the bullish candles and the third to fill the bearish candles. This possibility is demonstrated below, where the third color was defined as dark gray to differentiate from the edges.
#property indicator_type1   DRAW_CANDLES
#property indicator_color1  clrBlack,clrWhite,clrDarkGray
Construction of multicolored candlestick chart with and without filling
To finish our study on the creation of multicolored candles in MQL5 we are going to make the user interface in the indicator parameter window more informative. This is an intermediate step for creating multicolored candles with and without filling. In addition, the number of buffers required for both is the same, but higher than the number of buffers in the versions seen so far. This is because we will not plot a design for all colors, but we will plot a design for each color. In our model, we will have 3 drawings, one for purchase, one for sale and one for the other conditions, as proposed at the beginning of the article. That is, we will have 12 buffers to implement this model. In addition, we will use the same business rule based on displaced prices previously seen.
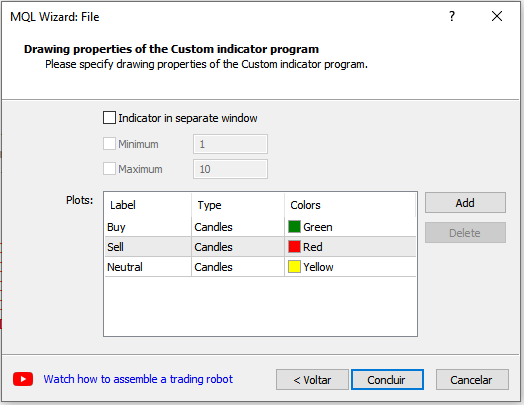
Again we will make use of the MQL Wizard to skip the steps to define and initialize the 12 buffers. Instead of the Candle type design, we will use the Buy, Sell and Neutral designs.
We do not want all drawings to be displayed simultaneously. We want that, according to the business rule, one of the drawings is displayed and the others are hidden. For this, the hidden candle buffers must be filled with an empty value. The first step then is to define the values for which the drawing should be omitted. We do this using the PlotIndexSetDouble function as shown below.
//+------------------------------------------------------------------+
//| Custom indicator initialization function                         |
//+------------------------------------------------------------------+
int OnInit()
  {
//--- indicator buffers mapping
   SetIndexBuffer(0,BuyBuffer1,INDICATOR_DATA);
   SetIndexBuffer(1,BuyBuffer2,INDICATOR_DATA);
   SetIndexBuffer(2,BuyBuffer3,INDICATOR_DATA);
   SetIndexBuffer(3,BuyBuffer4,INDICATOR_DATA);
   SetIndexBuffer(4,SellBuffer1,INDICATOR_DATA);
   SetIndexBuffer(5,SellBuffer2,INDICATOR_DATA);
   SetIndexBuffer(6,SellBuffer3,INDICATOR_DATA);
   SetIndexBuffer(7,SellBuffer4,INDICATOR_DATA);
   SetIndexBuffer(8,NeutralBuffer1,INDICATOR_DATA);
   SetIndexBuffer(9,NeutralBuffer2,INDICATOR_DATA);
   SetIndexBuffer(10,NeutralBuffer3,INDICATOR_DATA);
   SetIndexBuffer(11,NeutralBuffer4,INDICATOR_DATA);

   PlotIndexSetDouble(0,PLOT_EMPTY_VALUE,0.0);
   PlotIndexSetDouble(1,PLOT_EMPTY_VALUE,0.0);
   PlotIndexSetDouble(2,PLOT_EMPTY_VALUE,0.0);

//---
   return(INIT_SUCCEEDED);
  }
In our case, we use the value 0.0 to define empty values in our buffers. The values 0, 1 and 2 passed as the first parameter in the PlotIndexSetDouble function are the index of the drawing to be plotted on the price graph. This index is the same used in declaring the properties of our indicator designs.
All we have to do now is work on our OnCalculate function, applying the business rule created earlier. Since only one of the drawings must be displayed, we can define all drawings as not visible by assigning the value 0.0 to all candles, each time the OnCalculate function is called. Next, we assign the opening, maximum, minimum and closing values to the candles in the drawing we want to display according to the business rule. The result of the work is shown below.
  {
//---
   int start = prev_calculated;
   if(prev_calculated<20)
      start = 20;
   if(start>=rates_total)
      start = rates_total-1;

   for(int i = start; i<rates_total; i++)
     {
      //initializing the candles data
      BuyBuffer1[i]=0.0;
      BuyBuffer2[i]=0.0;
      BuyBuffer3[i]=0.0;
      BuyBuffer4[i]=0.0;

      SellBuffer1[i]=0.0;
      SellBuffer2[i]=0.0;
      SellBuffer3[i]=0.0;
      SellBuffer4[i]=0.0;

      NeutralBuffer1[i]=0.0;
      NeutralBuffer2[i]=0.0;
      NeutralBuffer3[i]=0.0;
      NeutralBuffer4[i]=0.0;

      //Close[0] > Close[10] e Close[0] > Close[20]
      bool buy= close[i]>close[i-10] && close[i]>close[i-20];

      //Close[0] < Close[10] e Close[0] < Close[20]
      bool sell= close[i]<close[i-10] && close[i]<close[i-20];

      //Setting the values to the candles according to the trading rules
      if(buy)
        {
         BuyBuffer1[i]=open[i];
         BuyBuffer2[i]=high[i];
         BuyBuffer3[i]=low[i];
         BuyBuffer4[i]=close[i];
        }
      else
         if(sell)
           {
            SellBuffer1[i]=open[i];
            SellBuffer2[i]=high[i];
            SellBuffer3[i]=low[i];
            SellBuffer4[i]=close[i];
           }
         else
           {
            NeutralBuffer1[i]=open[i];
            NeutralBuffer2[i]=high[i];
            NeutralBuffer3[i]=low[i];
            NeutralBuffer4[i]=close[i];
           }

     }

//--- return value of prev_calculated for next call
   return(rates_total);
  }
The visual result is exactly the same as seen previously using the DRAW_COLOR_CANDLES drawing type. The great advantage of this last method is that we will have a more informative user interface, despite significantly increasing the number of buffers needed. However, we can extend this advantage by making our coloring rule give us not only information about business rules, but also the differentiation between bullish and bearish candles. This can be done simply by working on the edge colors and fillings of the candles seen previously. For each design we will want the edges and the filling of the low candles to be the same color, while for filling the high candles we will use white, for a price chart with a white background, giving the illusion of unfilled candles. This color pattern is simplified in the following table.
| trading rules | border | positive fill | negative fill |
|---|---|---|---|
| buy | green | white | green |
| sell | red | white | red |
| neutral | yellow | white | yellow |
The changes to our code are shown below.
#property indicator_color1 clrGreen,clrWhite,clrGreen
#property indicator_color2 clrRed,clrWhite,clrRed
#property indicator_color3 clrYellow,clrWhite,clrYellow
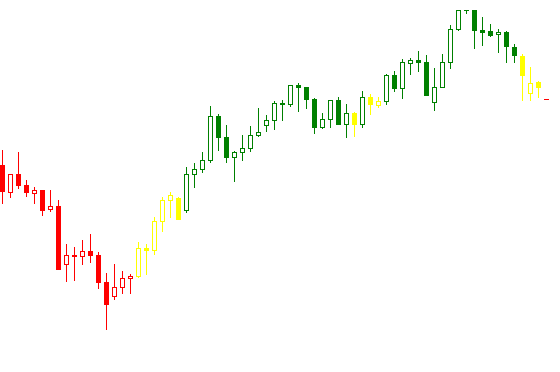
So we arrived at the objective of this article, which is the demonstration of how to create coloring rules according to some business rule applying it to a candle chart with and without filling. The final result of our work is shown in the image below.
Conclusion
We saw that we can create candle charts using two types of design, DRAW_CANDLES and DRAW_COLOR_CANDLES, we saw how to apply a coloring rule based on a trading rule to the candle chart, and how to differentiate colors between the edges and the filling the candles, which allows us to color the candles keeping the distinction between bullish and bearish candles. It is important to note that according to the purpose of the customized indicator, the distinction between low and high candles may not be relevant, as well, if the number of colors is very large, for example, 10 colors, it may not be convenient to use the last method presented as it would increase the number of buffers too much, resulting in greater use of users' hardware.
In this case, there are two options that can be used instead of explaining the applicability of each color in the parameter window of the indicator. You can use the DRAW_COLOR_CANDLES design type, or we can use the DRAW_CANDLES design, to create the illusion of unfilled candles by making the edges and fill of low candles in that design transparent, while the filling of the low candles will be the color of the plan bottom of the price graph, causing the distinction between bullish and bearish candles, superimposed on the drawing DRAW_COLOR_CANDLES, for application of coloring according to the business rule.
Warning: All rights to these materials are reserved by MetaQuotes Ltd. Copying or reprinting of these materials in whole or in part is prohibited.
This article was written by a user of the site and reflects their personal views. MetaQuotes Ltd is not responsible for the accuracy of the information presented, nor for any consequences resulting from the use of the solutions, strategies or recommendations described.

 Bid/Ask spread analysis in MetaTrader 5
 Better programmer (Part 05): How to become a faster developer
- Free trading apps
- Over 8,000 signals for copying
- Economic news for exploring financial markets
You agree to website policy and terms of use
Thanks in advance!
How can I reduce the space between each candlestick? Is there a way?
Thanks in advance!
I don't understand the question.
If you zoom in/out the chart that may reduce or increase the space between the candles.
I don't understand the question.
If you zoom in/out the chart that may reduce or increase the space between the candles.
Thank you VERY MUCH for this article.
It's a blessing. So God bless you.
This article was mentioned today in another topic—Programmatically Change Bear/Bull Candle color.
I learned something new today. Thank you!