
Universal RSI indicator for working in two directions simultaneously
Contents
- Introduction
- Selecting the indicator
- Modifying the RSI indicator
- The first version. Adding signal buffers
- The second version. Adding buffers of signal counters
- The third version. Increasing the number of signals, eliminating skips
- The fourth version. Moving the indicator to the main chart window
- The fifth version. Universal RSI indicator for working in two directions simultaneously
- Conclusion
Introduction
When developing trading algorithms, we almost always encounter a problem: how to determine where a trend/flat begins and ends? It is difficult to find a clear-cut solution. This goal seems achievable by combining the both trend-based and flat-based strategies in one algorithm. In this article, we will create a universal indicator that will combine signals for different types of strategies. We will try to simplify the generation of trade signals in an expert as much as possible. An example of combining several indicators in one will be given. This will be done using object-oriented programming, with each indicator or its part being implemented in the form of a class included in the main program file.
So, the task here is to write an expert that would combine two trading strategies: one for trend trading, the other one of the flats. Suppose that simultaneous trading in two directions is more effective, and such a strategy will be more stable. Then it is more convenient to include only one indicator in an expert, that would generate signals for both strategy types. Inside it, you can implement a complex system for determining buy and sell signals. It may be necessary to combine several identical indicators with different settings into one. Or even to include two different ones in the indicator: main and filtering (auxiliary). It is convenient to implement such schemes using OOP.
The scheme below shows the inclusion of two indicator classes (CIndicator1 and CIndicator2) in the main indicator file (Indicator.mq5). CIndicator2 is an auxiliary indicator, its calculation results are necessary for CIndicator1. Here we apply the method for determining the true bar discussed earlier in the article on creating multi-symbol indicators. A separate CFirstTrueBar class has been written for this article. It will be included in all indicators to avoid calculation on bars that do not belong to the current timeframe.
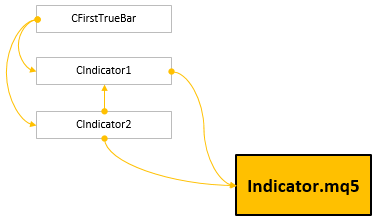
Fig. 1. One of possible schemes for creating an indicator using OOP.
Selecting the indicator
Any indicator from the standard terminal package can be selected for signal generation. Most of them have a similar idea, and any of them is not advantageous over others, as a rule. Some combinations of indicators and filters will be effective at certain time intervals, while others will prove useful on different intervals.
But for convenience of research, it is better to select indicators of the oscillator type. They can be used for determining signals both during a trend and in a flat. The oscillator data can also be used for plotting a price channel. As a result, we obtain the ability to create a universal indicator, which is handy when developing trading strategies of any complexity.
The RSI (Relative Strength Index) indicator will be used as an example in this article series. Below are the calculation results of this indicator with a period of 8 on the AUDUSD H1 chart.
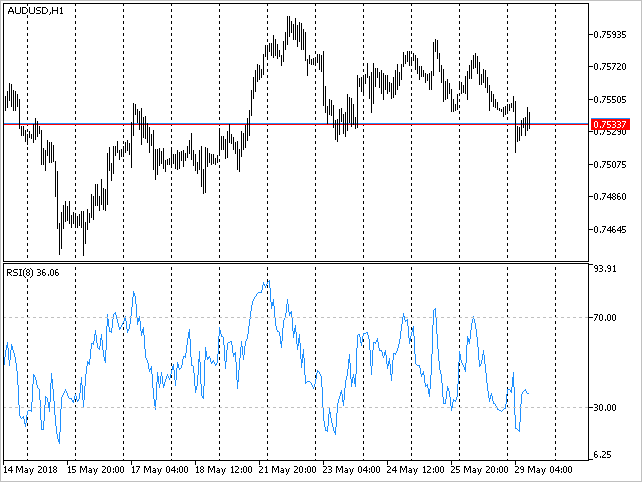
Fig. 2. The Relative Strength Index indicator.
At first glance, it is easy to receive profit based on the signals of this indicator. But this is a delusion. Before you reach a new level of approximate understanding of where to go next, a lot of work needs to be done. At the same time, there is no guarantee that you will achieve your goals.
Consider the simplest and most obvious case: we think that profit can be received when the indicator line crosses the default levels: 70/30. If the level 70 is crossed downwards, it is considered a sell signal. If the level 30 is crossed upwards, it is considered a buy signal. However, we see a lot of false signals, while the price goes in the direction opposite to the opened position.
Here is another example of analyzing the signals of this indicator (see Figure 3). We see that the price moves down for a long while. Red lines mark the signals formed when the indicator crosses the level 30 upwards. If your algorithm involves buying based on these signals, you will receive a floating drawdown. If you set a stop loss every time you open a position, the losses are received several times. At the same time, the price has never reached a positive result since the last buy signal up to the sell signal (green line)appeared. Your result is a loss. Also, this segment of the chart suggests trading along the trend, meaning that we do not see anything unambiguous.
Similar problems arise when using any indicator. Therefore, it does not matter which of them is selected for further work.
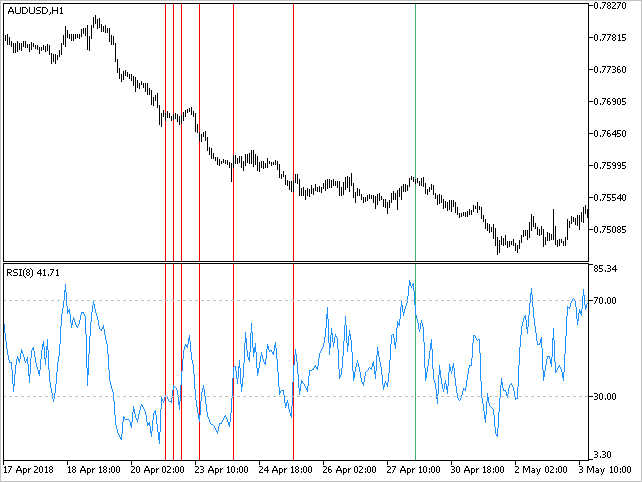
Fig. 3. Signals by the RSI indicator.
Modifying the RSI indicator
Additions should be made to the selected indicator so that it is more convenient to work with from an expert later. We create five versions of RSI, successively progressing from simple to complex (for ease of understanding).
The first version. Adding signal buffers
The standard version of RSI is located in the \MQL5\Indicators\Examples directory of the terminal. Let us make a copy of it and start modifying it. We add two more indicator buffers to the list of fixed parameters. Their total number will also be equal to 5, and 3 will be displayed on the chart. Two buffers will remain reserved for auxiliary calculations. Labels for buy signals will be marked in green (clrMediumSeaGreen), and in red (clrRed) for sell signals.
//--- Properties
#property indicator_separate_window
#property indicator_minimum 0
#property indicator_maximum 100
#property indicator_buffers 5
#property indicator_plots   3
#property indicator_color1  clrSteelBlue
#property indicator_color2  clrMediumSeaGreen
#property indicator_color3  clrRed
Define codes for signal labels. If it is necessary to display dots, the code is 159. If the signals are to displayed as arrows, use the codes 233 and 234, respectively.
//--- Arrows for signals: 159 - dots; 233/234 - arrows
#define ARROW_BUY  159
#define ARROW_SELL 159
Intersections of the indicator line boundaries can serve both as buy and sell signals. Therefore, the external parameter will require an enumeration, which can be used for specifying how to interpret the indicator signals.
- Break in — breakout of the boundaries into the range. A breakout of the lower boundary upwards is a buy signal, while a breakout of the upper boundary downwards is a sell signal.
- Break in reverse — breakout of the boundaries into the range (against the impulse). The same signals as in the 'Break in' mode, but the conditions for buying and selling are reversed.
- Break out — breakout of the boundaries out of the range. A breakout of the upper boundary upwards is a buy signal, while a breakout of the lower boundary downwards is a sell signal.
- Break out reverse — breakout of the boundaries out of the range (against the impulse). The same signals as in the 'Break out' mode, but the conditions for buying and selling are reversed.
All these modes will be shown on the chart below.
//--- Enumeration with the modes of channel boundary breakout
enum ENUM_BREAK_INOUT
  {
   BREAK_IN          =0, // Break in
   BREAK_IN_REVERSE  =1, // Break in reverse
   BREAK_OUT         =2, // Break out
   BREAK_OUT_REVERSE =3  // Break out reverse
  };
The indicator will have three external parameters in total:
- RSI Period — indicator period;
- Signal Level — indicator levels;
- Break Mode — level breakout mode.
//--- Input parameters
input  int              PeriodRSI   =8;         // RSI Period
input  double           SignalLevel =30;        // Signal Level
input  ENUM_BREAK_INOUT BreakMode   =BREAK_OUT; // Mode Break
The properties of the indicator are set in the SetPropertiesIndicator() function. The auxiliary arrays are set last. All the indicator arrays are initialized with zero values in the ZeroIndicatorBuffers() function. Then, we specify that the zero values should not be displayed on the chart, meaning that such values will be empty.
//+------------------------------------------------------------------+
//| Sets indicator properties                                        |
//+------------------------------------------------------------------+
void SetPropertiesIndicator(void)
  {
//--- Short name
   ::IndicatorSetString(INDICATOR_SHORTNAME,"RSI_PLUS1");
//--- Decimal places
   ::IndicatorSetInteger(INDICATOR_DIGITS,2);
//--- Indicator arrays
   ::SetIndexBuffer(0,rsi_buffer,INDICATOR_DATA);
   ::SetIndexBuffer(1,buy_buffer,INDICATOR_DATA);
   ::SetIndexBuffer(2,sell_buffer,INDICATOR_DATA);
   ::SetIndexBuffer(3,pos_buffer,INDICATOR_CALCULATIONS);
   ::SetIndexBuffer(4,neg_buffer,INDICATOR_CALCULATIONS);
//--- Initialization of arrays
   ZeroIndicatorBuffers();
//--- Set the text labels
   string plot_label[]={"RSI","buy","sell"};
   for(int i=0; i<indicator_plots; i++)
      ::PlotIndexSetString(i,PLOT_LABEL,plot_label[i]);
//--- Set the width for the indicator arrays
   for(int i=0; i<indicator_plots; i++)
      ::PlotIndexSetInteger(i,PLOT_LINE_WIDTH,1);
//--- Set the type for the indicator arrays
   ENUM_DRAW_TYPE draw_type[]={DRAW_LINE,DRAW_ARROW,DRAW_ARROW};
   for(int i=0; i<indicator_plots; i++)
      ::PlotIndexSetInteger(i,PLOT_DRAW_TYPE,draw_type[i]);
//--- Label codes
   ::PlotIndexSetInteger(1,PLOT_ARROW,ARROW_BUY);
   ::PlotIndexSetInteger(2,PLOT_ARROW,ARROW_SELL);
//--- Index of the element to begin the calculation from
   for(int i=0; i<indicator_plots; i++)
      ::PlotIndexSetInteger(i,PLOT_DRAW_BEGIN,period_rsi);
//--- The number of the indicator's horizontal levels
   ::IndicatorSetInteger(INDICATOR_LEVELS,2);
//--- Values of the indicator's horizontal levels
   up_level   =100-SignalLevel;
   down_level =SignalLevel;
   ::IndicatorSetDouble(INDICATOR_LEVELVALUE,0,down_level);
   ::IndicatorSetDouble(INDICATOR_LEVELVALUE,1,up_level);
//--- Line style
   ::IndicatorSetInteger(INDICATOR_LEVELSTYLE,0,STYLE_DOT);
   ::IndicatorSetInteger(INDICATOR_LEVELSTYLE,1,STYLE_DOT);
//--- Empty value for plotting where nothing will be drawn
   for(int i=0; i<indicator_buffers; i++)
      ::PlotIndexSetDouble(i,PLOT_EMPTY_VALUE,0);
//--- Shift along the Y axis
   if(BreakMode==BREAK_IN_REVERSE || BreakMode==BREAK_OUT_REVERSE)
     {
      ::PlotIndexSetInteger(0,PLOT_ARROW_SHIFT,arrow_shift);
      ::PlotIndexSetInteger(1,PLOT_ARROW_SHIFT,-arrow_shift);
     }
   else
     {
      ::PlotIndexSetInteger(0,PLOT_ARROW_SHIFT,-arrow_shift);
      ::PlotIndexSetInteger(1,PLOT_ARROW_SHIFT,arrow_shift);
     }
  }
For convenience, preliminary and main calculations of the RSI indicator values are moved to separate functions PreliminaryCalculations() and CalculateRSI(). Their content is the same as in the RSI indicator from the standard package. Let us consider only the function for determining the indicator signals — CalculateSignals(). Here, the conditions are checked first, depending on the mode set in the external parameters. Then, if the conditions are fulfilled, the RSI indicator value is stored to the corresponding indicator array. If a condition is not fulfilled, then zero values will be saved, which will not be displayed on the chart.
//+------------------------------------------------------------------+
//| Calculate the indicator signals                                  |
//+------------------------------------------------------------------+
void CalculateSignals(const int i)
  {
   bool condition1 =false;
   bool condition2 =false;
//--- Breakout into the channel
   if(BreakMode==BREAK_IN || BreakMode==BREAK_IN_REVERSE)
     {
      condition1 =rsi_buffer[i-1]<down_level && rsi_buffer[i]>down_level;
      condition2 =rsi_buffer[i-1]>up_level && rsi_buffer[i]<up_level;
     }
   else
     {
      condition1 =rsi_buffer[i-1]<up_level && rsi_buffer[i]>up_level;
      condition2 =rsi_buffer[i-1]>down_level && rsi_buffer[i]<down_level;
     }
//--- Display the signals if the conditions are fulfilled
   if(BreakMode==BREAK_IN || BreakMode==BREAK_OUT)
     {
      buy_buffer[i]  =(condition1)? rsi_buffer[i] : 0;
      sell_buffer[i] =(condition2)? rsi_buffer[i] : 0;
     }
   else
     {
      buy_buffer[i]  =(condition2)? rsi_buffer[i] : 0;
      sell_buffer[i] =(condition1)? rsi_buffer[i] : 0;
     }
  }
As a result, the code of the main indicator functions, such as OnInit() and OnCalculate(), will look neat and readable:
//+------------------------------------------------------------------+
//| Custom indicator initialization function                         |
//+------------------------------------------------------------------+
void OnInit(void)
  {
//--- Check the external parameter value
   if(PeriodRSI<1)
     {
      period_rsi=2;
      Print("Incorrect value for input variable PeriodRSI =",PeriodRSI,
            "Indicator will use value =",period_rsi,"for calculations.");
     }
   else
      period_rsi=PeriodRSI;
//--- Set indicator properties
   SetPropertiesIndicator();
  }
//+------------------------------------------------------------------+
//| Relative Strength Index                                          |
//+------------------------------------------------------------------+
int OnCalculate(const int      rates_total,
                const int      prev_calculated,
                const datetime &time[],
                const double   &open[],
                const double   &high[],
                const double   &low[],
                const double   &close[],
                const long     &tick_volume[],
                const long     &volume[],
                const int      &spread[])
  {
//--- Leave, if the data are insufficient
   if(rates_total<=period_rsi)
      return(0);
//--- Preliminary calculations
   PreliminaryCalculations(prev_calculated,close);
//--- The main calculations loop
   for(int i=start_pos; i<rates_total && !::IsStopped(); i++)
     {
      //--- Calculate the RSI indicator
      CalculateRSI(i,close);
      //--- Calculate the signals
      CalculateSignals(i);
     }
//--- Return the last calculated number of elements
   return(rates_total);
  }
Attach this indicator to a chart to see what happened. Below are the results in all four operation modes (external parameter Break Mode).

Fig. 4. Demonstration of the modified RSI indicator operation.
After this modification of the RSI indicator, the number of false signals it generates can be seen better. Analyzing the graphs, we conclude that this indicator is sometimes better for trading in flat, and sometimes during a trend.
- The Break in mode is designed for trading in a flat in the direction of RSI.
- The Break in reverse mode is designed for trading along the trend against the direction of RSI.
- The Break out mode is designed for trading along the trend in the direction of RSI.
- The Break out reverse mode is designed for trading in a flat against the direction of RSI.
Can the signals of this indicator be traded only in a flat or only during a trend? How can the probability of positive outcomes and the accuracy of the entries be increased? It is quite possible that if the position is opened not by the first signal in a continuous series, it can improve the result.
The second version. Adding buffers of signal counters
Let us try to add indicator buffers, where the number of continuous signals in one direction will be displayed. As soon as an opposite signal appears, the counter of the previous buffer is zeroed, and the counter for the current series of signals is activated. For the implementation, we slightly supplement the code.
There are changes in specific parameters. Specify a new number of buffers, series for plotting and set the color for them.
//--- Properties
...
#property indicator_buffers 7
#property indicator_plots   5
...
#property indicator_color4  clrMediumSeaGreen
#property indicator_color5  clrRed
At the global scope, add two additional arrays to display the values of counters and two corresponding auxiliary variables:
//--- Indicator arrays
...
double buy_counter_buffer[];
double sell_counter_buffer[];
//--- Counters of continuous signal sequences
int buy_counter  =0;
int sell_counter =0;
The remaining changes concern only the function for determining the signals. Here, if the conditions are met (the next buy or sell signal appears), a corresponding counter is triggered, while the counter for the opposite signal series is reset. In order to avoid increasing the counter on the current bar, it is necessary to skip its triggering on the last incomplete bar.
//+------------------------------------------------------------------+
//| Calculate the indicator signals                                  |
//+------------------------------------------------------------------+
void CalculateSignals(const int i,const int rates_total)
  {
   int last_index=rates_total-1;
//---
   bool condition1 =false;
   bool condition2 =false;
//--- Breakout into the channel
   if(BreakMode==BREAK_IN || BreakMode==BREAK_IN_REVERSE)
     {
      condition1 =rsi_buffer[i-1]<down_level && rsi_buffer[i]>down_level;
      condition2 =rsi_buffer[i-1]>up_level && rsi_buffer[i]<up_level;
     }
   else
     {
      condition1 =rsi_buffer[i-1]<up_level && rsi_buffer[i]>up_level;
      condition2 =rsi_buffer[i-1]>down_level && rsi_buffer[i]<down_level;
     }
//--- Display the signals if the conditions are fulfilled
   if(BreakMode==BREAK_IN || BreakMode==BREAK_OUT)
     {
      buy_buffer[i]  =(condition1)? rsi_buffer[i] : 0;
      sell_buffer[i] =(condition2)? rsi_buffer[i] : 0;
      //--- Counter only by completely formed bars
      if(i<last_index)
        {
         if(condition1)
           {
            buy_counter++;
            sell_counter=0;
           }
         else if(condition2)
           {
            sell_counter++;

            buy_counter=0;
           }
        }
     }
   else
     {
      buy_buffer[i]  =(condition2)? rsi_buffer[i] : 0;
      sell_buffer[i] =(condition1)? rsi_buffer[i] : 0;
      //--- Counter only by completely formed bars
      if(i<last_index)
        {
         if(condition2)
           {
            buy_counter++;
            sell_counter=0;
           }
         else if(condition1)
           {
            sell_counter++;
            buy_counter=0;
           }
        }
     }
//--- Correction of the last value (equal to penultimate)
   if(i<last_index)
     {
      buy_counter_buffer[i]  =buy_counter;
      sell_counter_buffer[i] =sell_counter;
     }
   else
     {
      buy_counter_buffer[i]  =buy_counter_buffer[i-1];
      sell_counter_buffer[i] =sell_counter_buffer[i-1];
     }
  }
After the changes are made, attach the indicator to a chart to see what happened. Now the RSI indicator became more informative. The values of these counters can be received in an Expert Advisor to form additional conditions for buying and selling.

Fig. 5. Modified RSI indicator with counters of continuous signals in the same direction.
To make that everything works as intended, check the indicator both in the tester and in real time. The result in the strategy tester:
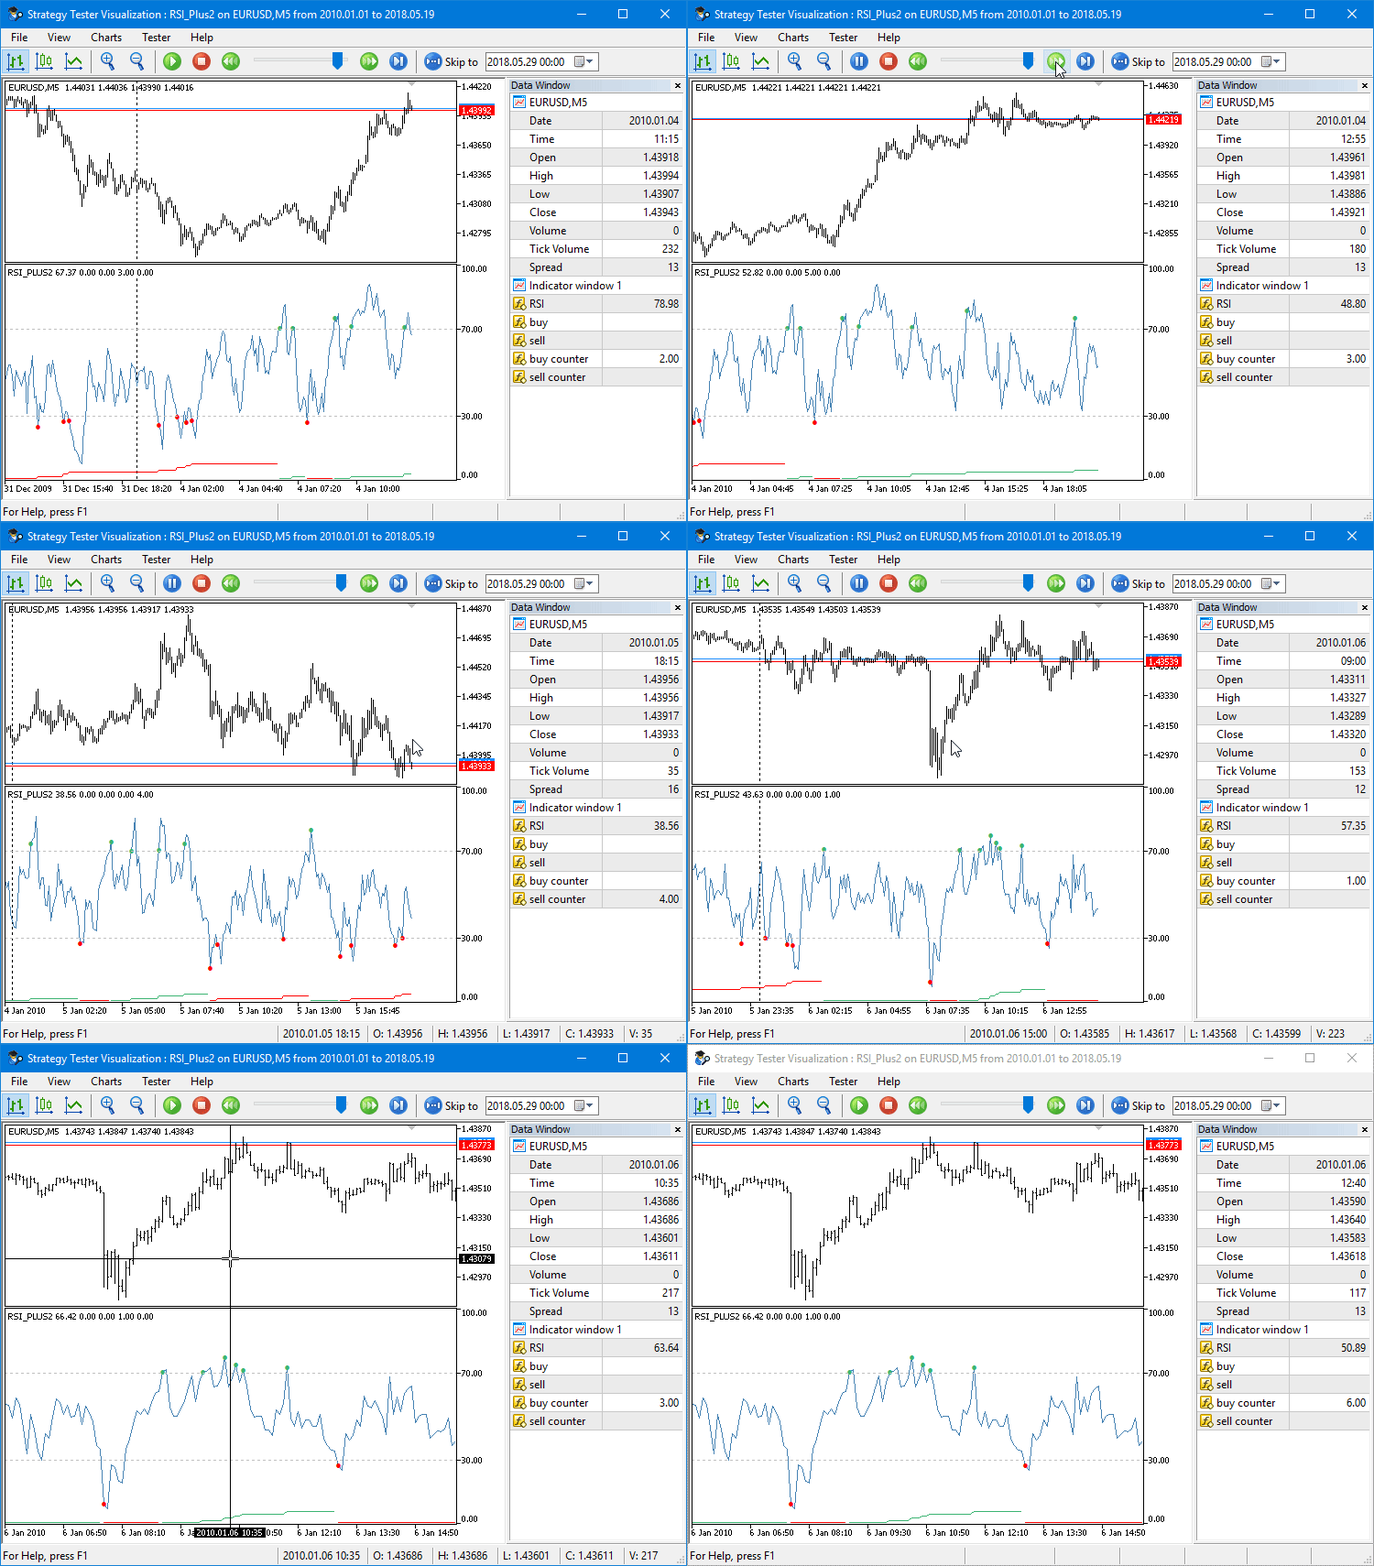
Fig. 6. Checking the operation of the modified RSI indicator in the strategy tester.
The next screenshot below shows the indicator values in all operation modes of the Break Mode parameter.

Fig. 7. The indicator in all operation modes of the Break Mode parameter.
There may be a situation on the chart, where the price can move a rather large distance between two similar signals. This happens very often and on any timeframes. At the same time, you can change the Signal Level external parameter as much as you want, configuring the range boundaries — this does not solve the problem. This uncertainty can interfere with the creation of a clear trading logic or complicate it with the need to write additional conditions.
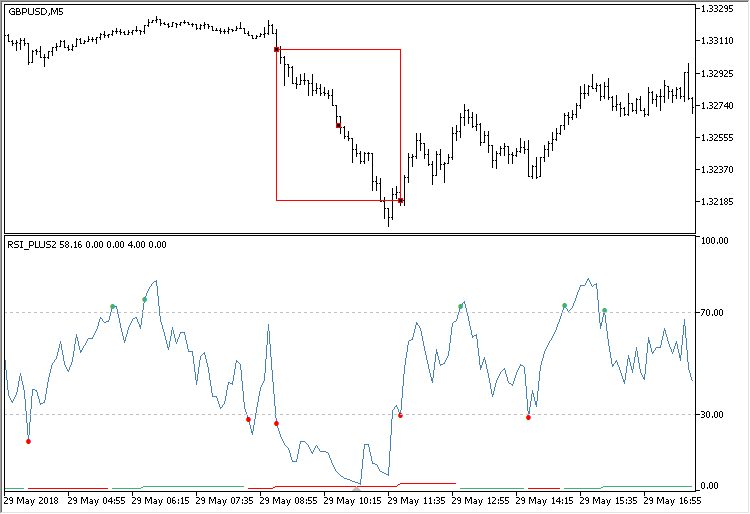
Fig. 8. Skipped signals at a significant price movement.
In the next version, we will eliminate such skips, making the indicator even more informative.
The third version. Increasing the number of signals, eliminating skips
In this version, the number of indicator buffers remains the same. But it is necessary to add arrays of indicator levels to generate signals when the indicator crosses a line.
//--- Values of horizontal levels of the indicator and their number
double up_level          =0;
double down_level        =0;
int    up_levels_total   =0;
int    down_levels_total =0;
//--- Arrays of horizontal levels
double up_levels[];
double down_levels[];
To avoid the skipping of signals, as mentioned in the previous section, the levels will be set every 5 points. That is, if a value 30 is specified in the Signal Level external parameter, then the following value will be calculated for the upper levels: 70, 75, 80, 85, 90, 95.
The indicator levels are calculated by the GetLevelsIndicator() function. Two separate loops calculate the values of levels to be placed in the arrays. The function returns the total number of levels.
//+------------------------------------------------------------------+
//| Return the indicator levels                                      |
//+------------------------------------------------------------------+
int GetLevelsIndicator(void)
  {
   int levels_counter=0;
   double level=down_level;
//--- Lower levels down to the lower limit
   while(level>0 && !::IsStopped())
     {
      int size=::ArraySize(down_levels);
      ::ArrayResize(down_levels,size+1);
      down_levels[size]=level;
      level-=5;
      levels_counter++;
     }
   level=up_level;
//--- Upper levels up to the upper limit
   while(level<100 && !::IsStopped())
     {
      int size=::ArraySize(up_levels);
      ::ArrayResize(up_levels,size+1);
      up_levels[size]=level;
      level+=5;
      levels_counter++;
     }
//---
   return(levels_counter);
  }
The levels are set in the function SetPropertiesIndicator(). Its shortened version is shown below. Here, the initial levels for the upper and lower ranges are calculated first and the level arrays are zeroed. Then the total number of indicator levels is set by calling the GetLevelsIndicator() function. After that, the calculated levels of the upper and lower ranges are set from the arrays.
//+------------------------------------------------------------------+
//| Sets indicator properties                                        |
//+------------------------------------------------------------------+
void SetPropertiesIndicator(void)
  {
...
//--- Calculation of the first levels
   up_level   =100-SignalLevel;
   down_level =SignalLevel;
//--- Zeroing the level arrays
   ::ArrayFree(up_levels);
   ::ArrayFree(down_levels);
//--- The number of the indicator's horizontal levels
   ::IndicatorSetInteger(INDICATOR_LEVELS,GetLevelsIndicator());
//--- Values of the indicator's horizontal levels of the lower level
   down_levels_total=::ArraySize(down_levels);
   for(int i=0; i<down_levels_total; i++)
      ::IndicatorSetDouble(INDICATOR_LEVELVALUE,i,down_levels[i]);
//--- Values of the indicator's horizontal levels of the upper level
   up_levels_total=::ArraySize(up_levels);
   int total=up_levels_total+down_levels_total;
   for(int i=down_levels_total,k=0; i<total; i++,k++)
      ::IndicatorSetDouble(INDICATOR_LEVELVALUE,i,up_levels[k]);
...
  }
Accordingly, it is necessary to make changes in the CalculateSignals() function. Only the modified part of the function is shown here as well. To check if the conditions are met in the cycles, see if at least one of the levels in the arrays is crossed.
//+------------------------------------------------------------------+
//| Calculate the indicator signals                                  |
//+------------------------------------------------------------------+
void CalculateSignals(const int i,const int rates_total)
  {
   int last_index=rates_total-1;
//---
   bool condition1 =false;
   bool condition2 =false;
//--- Breakout into the channel
   if(BreakMode==BREAK_IN || BreakMode==BREAK_IN_REVERSE)
     {
      if(rsi_buffer[i]<50)
        {
         for(int j=0; j<down_levels_total; j++)
           {
            condition1=rsi_buffer[i-1]<down_levels[j] && rsi_buffer[i]>down_levels[j];
            if(condition1)
               break;
           }
        }
      //---
      if(rsi_buffer[i]>50)
        {
         for(int j=0; j<up_levels_total; j++)
           {
            condition2=rsi_buffer[i-1]>up_levels[j] && rsi_buffer[i]<up_levels[j];
            if(condition2)
               break;
           }
        }
     }
   else
     {
      for(int j=0; j<up_levels_total; j++)
        {
         condition1=rsi_buffer[i-1]<up_levels[j] && rsi_buffer[i]>up_levels[j];
         if(condition1)
            break;
        }
      //---
      for(int j=0; j<down_levels_total; j++)
        {
         condition2=rsi_buffer[i-1]>down_levels[j] && rsi_buffer[i]<down_levels[j];
         if(condition2)
            break;
        }
     }
//--- Display the signals if the conditions are fulfilled
...
//--- Correction of the last value (equal to penultimate)
...
  }
Figure 9 shows how it looks.

Fig. 9. Forming signals when crossing multiple levels.
One problem is solved, but two more have appeared. The first lies in the necessity to exclude the signals where the price turns out to be higher than the previous buy signal or below the previous sell signal. Figure 10 demonstrates such a situation for a series of buy signals: the price at the last signal is above the price of the previous signal. This is relevant for modes Break in and Break out reverse, where it is necessary to stick to the concept of buying low and selling high.
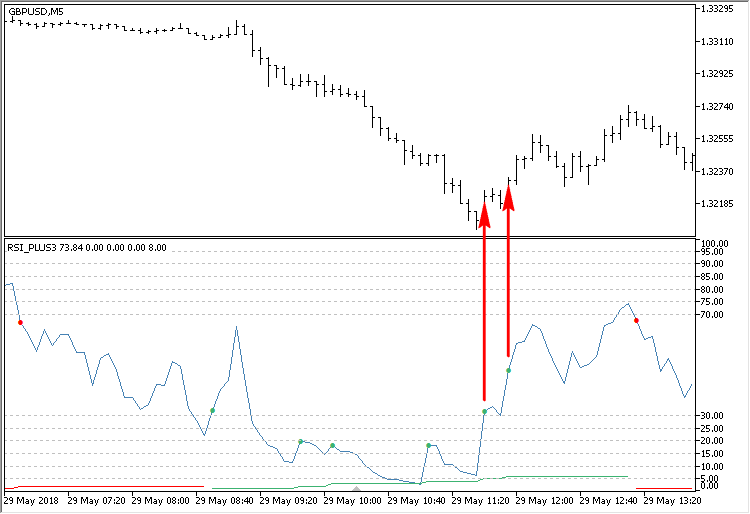
Fig. 10. The situation where the signal's price is higher than the previous signal's price.
The second problem is too frequent signals, sometimes even on several bars in a row. In this case, the price passes an insignificant distance between the signals (see Fig. 11).
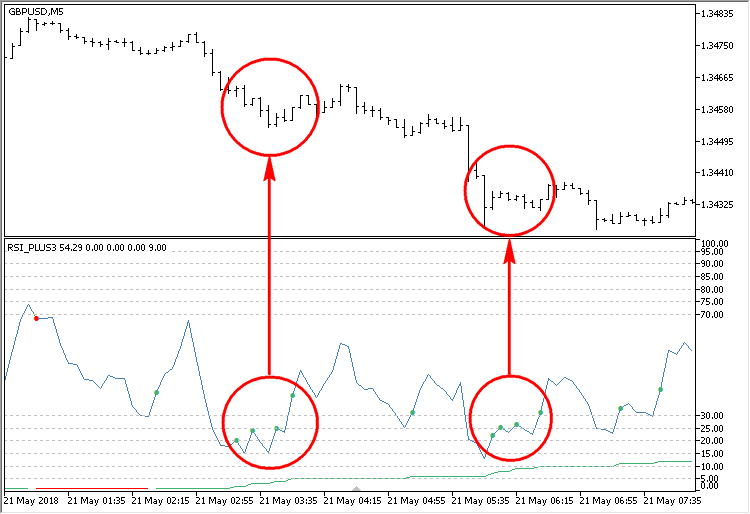
Fig. 11. Accumulations of frequent signals with insignificant price movements.
These problems will be solved in the next version.
The fourth version. Moving the indicator to the main chart window
This version of the indicator will be moved to the main chart. This indicator's operation is visualized better here: the signals are shown directly on the price. To control the distance between the signals (in points), one could simply specify a fixed value in an external parameter. But we will try to create a dynamic variant and tie this value to the volatility indicator (ATR). For convenience, the calculations for the indicators will be written in separate classes: CATR and CRsiPlus. It is possible to combine any number of indicators using this method, combining their calculation results in one program.
Determining a true bar
It is assumed that this version is used in the future to develop an Expert Advisor. Therefore, to eliminate the influence of the higher timeframes in historical data, we will determine the true bar when the bars of the current timeframe are not sufficient. This has been thoroughly described in the article on multi-symbol indicators. To determine the first true bar, we write a separate class CFirstTrueBar. First, let us take a closer look at this class.
Definitions of the CFirstTrueBar class members and methods are shown below. Let us briefly consider them.
//+------------------------------------------------------------------+
//| Class for determining the true bar                               |
//+------------------------------------------------------------------+
class CFirstTrueBar
  {
private:
   //--- Time of the true bar
   datetime          m_limit_time;
   //--- Number of the true bar
   int               m_limit_bar;
   //---
public:
                     CFirstTrueBar(void);
                    ~CFirstTrueBar(void);
   //--- Return (1) the time and (2) the number of the true bar
   datetime          LimitTime(void) const { return(m_limit_time); }
   int               LimitBar(void)  const { return(m_limit_bar);  }
   //--- Determine the first true bar
   bool              DetermineFirstTrueBar(void);
   //---
private:
   //--- Search for the first true bar of the current period
   void              GetFirstTrueBarTime(const datetime &time[]);
  };
The private method CFirstTrueBar::GetFirstTrueBarTime() is used to search for the true bar. It should be passed an array of history bar times to search for the first true bar. Iterate from the beginning of the array, and once a bar corresponding to the current timeframe is found, store the time and index of this bar. When the true bar is identified, its time and index can be obtained using the CFirstTrueBar::LimitTime() and CFirstTrueBar::LimitBar() methods.
//+------------------------------------------------------------------+
//| Search for the first true bar of the current period              |
//+------------------------------------------------------------------+
void CFirstTrueBar::GetFirstTrueBarTime(const datetime &time[])
  {
//--- Get the array size
   int array_size=::ArraySize(time);
   ::ArraySetAsSeries(time,false);
//--- Check each bar one by one
   for(int i=1; i<array_size; i++)
     {
      //--- If the bar corresponds to the current time frame
      if(time[i]-time[i-1]==::PeriodSeconds())
        {
         //--- Save it and terminate the loop
         m_limit_time =time[i-1];
         m_limit_bar  =i-1;
         break;
        }
     }
  }
The CFirstTrueBar::GetFirstTrueBarTime() method is called in the CFirstTrueBar::DetermineFirstTrueBar() method. This is where the array of bar times is obtained, which is later used to search for the first true bar.
//+------------------------------------------------------------------+
//| Determine the first true bar                                     |
//+------------------------------------------------------------------+
bool CFirstTrueBar::DetermineFirstTrueBar(void)
  {
//--- Array of bar times
   datetime time[];
//--- Get the total number of bars for the symbol
   int available_bars=::Bars(_Symbol,_Period);
//--- Copy the bar time array. If this action failed, try again.
   if(::CopyTime(_Symbol,_Period,0,available_bars,time)<available_bars)
      return(false);
//--- Get the time of the first true bar corresponding to the current time frame
   GetFirstTrueBarTime(time);
   return(true);
  }
Adding the ATR indicator
The ATR indicator will be calculated in the same way as in the standard package. The code is taken from here: \MQL5\Indicators\Examples. Below are the declarations of members and methods of the CATR class. The only difference from the standard version is that the first true bar is determined here, from which the calculations begin.
Include the file with the CFirstTrueBar class and declare its instance in the body of the CATR class. Please note that the indicator arrays are declared here with public access. This is necessary to have the ability to set them as indicator buffers in the main indicator file.
//+------------------------------------------------------------------+
//|                                                          ATR.mqh |
//|                        Copyright 2018, MetaQuotes Software Corp. |
//|                                              http://www.mql5.com |
//+------------------------------------------------------------------+
#include "FirstTrueBar.mqh"
//+------------------------------------------------------------------+
//| The ATR indicator                                                |
//+------------------------------------------------------------------+
class CATR
  {
private:
   //--- Determine the first true bar
   CFirstTrueBar     m_first_true_bar;
   //--- Indicator period
   int               m_period;
   //--- Limiter in calculation of the indicator values
   int               m_limit;
   //---
public:
   //--- Indicator buffers
   double            m_tr_buffer[];
   double            m_atr_buffer[];
   //---
public:
                     CATR(const int period);
                    ~CATR(void);
   //--- Indicator period
   void              PeriodATR(const int period) { m_period=period; }
   //--- Calculate the ATR indicator
   bool              CalculateIndicatorATR(const int rates_total,const int prev_calculated,const datetime &time[],const double &close[],const double &high[],const double &low[]);
   //--- Zero the indicator buffers
   void              ZeroIndicatorBuffers(void);
   //---
private:
   //--- Preliminary calculations
   bool              PreliminaryCalc(const int rates_total,const int prev_calculated,const double &close[],const double &high[],const double &low[]);
   //--- Calculate ATR
   void              CalculateATR(const int i,const datetime &time[],const double &close[],const double &high[],const double &low[]);
  };
The first true bar, from which the indicator will be calculated further, is determined in the method for preliminary calculations. If it is not determined, then the program leaves the method.
//+------------------------------------------------------------------+
//| Preliminary calculations                                         |
//+------------------------------------------------------------------+
bool CATR::PreliminaryCalc(const int rates_total,const int prev_calculated,const double &close[],const double &high[],const double &low[])
  {
//--- If it is the first calculation or there were changes
   if(prev_calculated==0)
     {
      //--- Determine the number of the true bar
      m_first_true_bar.DetermineFirstTrueBar();
      //--- Leave, if the true bar was not determined
      if(m_first_true_bar.LimitBar()<0)
         return(false);
      //---
      m_tr_buffer[0]  =0.0;
      m_atr_buffer[0] =0.0;
      //--- Bar to calculate from
      m_limit=(::Period()<PERIOD_D1)? m_first_true_bar.LimitBar()+m_period : m_period;
      //--- Leave, if out of range (insufficient bars)
      if(m_limit>=rates_total)
         return(false);
      //--- Calculate the values of the true range
      int start_pos=(m_first_true_bar.LimitBar()<1)? 1 : m_first_true_bar.LimitBar();
      for(int i=start_pos; i<m_limit && !::IsStopped(); i++)
         m_tr_buffer[i]=::fmax(high[i],close[i-1])-::fmin(low[i],close[i-1]);
      //--- The first ATR values are not calculated
      double first_value=0.0;
      for(int i=m_first_true_bar.LimitBar(); i<m_limit; i++)
        {
         m_atr_buffer[i]=0.0;
         first_value+=m_tr_buffer[i];
        }
      //--- Calculation of the first value
      first_value/=m_period;
      m_atr_buffer[m_limit-1]=first_value;
     }
   else
      m_limit=prev_calculated-1;
//---
   return(true);
  }
Signal filtering in the RSI indicator
In addition to the indicator buffers descried above, this version of RSI will have two more. Those will be continuous levels plotted separately based on prices of the buy and sell signals with spread taken into account. In order to have the ability to include the data of the indicator ATR in the calculations, it is necessary to get the pointer to the instance of the ATR class created in the main program file. Therefore, a pointer of type CATR and the corresponding methods for getting and setting are declared here.
To optimize the code, some of its blocks are now implemented as separate methods. These include checking the conditions, working with counters, etc. The only new method not considered previously is CRsiPlus::DirectionControl(). It is the method where the movement direction is controlled and the excessive signals are filtered out based on the current volatility. In addition, there are auxiliary methods for removing unnecessary signals — CRsiPlus::DeleteBuySignal() and CRsiPlus::DeleteSellSignal().
//+------------------------------------------------------------------+
//|                                                          RSI.mqh |
//|                        Copyright 2017, MetaQuotes Software Corp. |
//|                                              http://www.mql5.com |
//+------------------------------------------------------------------+
#include "FirstTrueBar.mqh"
#include "ATR.mqh"
//--- Enumeration of the channel breakout modes
enum ENUM_BREAK_INOUT
  {
   BREAK_IN          =0, // Break in
   BREAK_IN_REVERSE  =1, // Break in reverse
   BREAK_OUT         =2, // Break out
   BREAK_OUT_REVERSE =3  // Break out reverse
  };
//+------------------------------------------------------------------+
//| The RSI indicator with a volatility filter                       |
//+------------------------------------------------------------------+
class CRsiPlus
  {
private:
   //--- Determine the first true bar
   CFirstTrueBar     m_first_true_bar;
   //--- Pointer to ATR
   CATR             *m_atr;

   //--- Indicator period
   int               m_period;
   //--- RSI level
   double            m_signal_level;
   //--- Mode for generating signals
   ENUM_BREAK_INOUT  m_break_mode;

   //--- Counters of signals in the same direction
   int               m_buy_counter;
   int               m_sell_counter;
   //--- Indicator levels
   double            m_up_level;
   double            m_down_level;
   double            m_up_levels[];
   double            m_down_levels[];
   int               m_up_levels_total;
   int               m_down_levels_total;

   //--- Limiter in calculation of the indicator values
   int               m_limit;
   //--- To determine the last bar
   bool              m_is_last_index;
   //---
public:
   //--- Indicator buffers
   double            m_rsi_buffer[];
   double            m_pos_buffer[];
   double            m_neg_buffer[];
   //---
   double            m_buy_buffer[];
   double            m_sell_buffer[];
   double            m_buy_level_buffer[];
   double            m_sell_level_buffer[];
   double            m_buy_counter_buffer[];
   double            m_sell_counter_buffer[];
   //---
public:
                     CRsiPlus(const int period,const double signal_level,const ENUM_BREAK_INOUT break_mode);
                    ~CRsiPlus(void) {}
   //--- Pointer to ATR
   void              AtrPointer(CATR &object) { m_atr=::GetPointer(object);  }
   CATR             *AtrPointer(void)         { return(::GetPointer(m_atr)); }
   //--- Calculate the RSI indicator
   bool              CalculateIndicatorRSI(const int rates_total,const int prev_calculated,const double &close[],const int &spread[]);
   //--- Initialization of all indicator buffers
   void              ZeroIndicatorBuffers(void);
   //---
private:
   //--- Get the indicator levels
   int               GetLevelsIndicator(void);
   //--- Preliminary calculations
   bool              PreliminaryCalc(const int rates_total,const int prev_calculated,const double &close[]);
   //--- Calculate the RSI series
   void              CalculateRSI(const int i,const double &price[]);
   //--- Calculate the indicator signals
   void              CalculateSignals(const int i,const int rates_total,const double &close[],const int &spread[]);

   //--- Check conditions
   void              CheckConditions(const int i,bool &condition1,bool &condition2);
   //--- Check counters
   void              CheckCounters(bool &condition1,bool &condition2);
   //--- Increase the buy and sell counters
   void              IncreaseBuyCounter(const bool condition);
   void              IncreaseSellCounter(const bool condition);

   //--- Control of the movement direction
   void              DirectionControl(const int i,bool &condition1,bool &condition2);
   //--- Remove the excessive buy and sell signals
   void              DeleteBuySignal(const int i);
   void              DeleteSellSignal(const int i);
   //--- Zero the specified element of indicator buffers
   void              ZeroIndexBuffers(const int index);
  };
The CRsiPlus::DirectionControl() method checks the following conditions, which determine if the signal is excessive:
- If there is a signal, but the size of the impulse is smaller than the current volatility.
- If the generated signal is opposite to the direction of the current series.
If the conditions are met, the signal is erased.
//+------------------------------------------------------------------+
//| Control of the movement direction                                |
//+------------------------------------------------------------------+
void CRsiPlus::DirectionControl(const int i,bool &condition1,bool &condition2)
  {
   double atr_coeff     =0.0;
   double impulse_size  =0.0;
   bool   atr_condition =false;
//---
   bool buy_condition  =false;
   bool sell_condition =false;
//--- If the reversion is disabled
   if(m_break_mode==BREAK_IN || m_break_mode==BREAK_OUT)
     {
      buy_condition =condition1 && m_buy_counter>1;
      impulse_size  =::fabs(m_buy_buffer[i]-m_buy_level_buffer[i-1]);
      atr_condition =impulse_size<m_atr.m_atr_buffer[i];
      //---
      if((m_buy_counter>1 && atr_condition) ||
         (m_break_mode==BREAK_IN && buy_condition && m_buy_buffer[i]>m_buy_level_buffer[i-1]) ||
         (m_break_mode==BREAK_OUT && buy_condition && m_buy_buffer[i]<m_buy_level_buffer[i-1]))
        {
         DeleteBuySignal(i);
        }
      //---
      sell_condition =condition2 && m_sell_counter>1;
      impulse_size   =::fabs(m_sell_buffer[i]-m_sell_level_buffer[i-1]);
      atr_condition  =impulse_size<m_atr.m_atr_buffer[i];
      //---
      if((m_sell_counter>1 && atr_condition) ||
         (m_break_mode==BREAK_IN && sell_condition && m_sell_buffer[i]<m_sell_level_buffer[i-1]) ||
         (m_break_mode==BREAK_OUT && sell_condition && m_sell_buffer[i]>m_sell_level_buffer[i-1]))
        {
         DeleteSellSignal(i);
        }
     }
//--- Reversion is enabled
   else
     {
      buy_condition =condition2 && m_buy_counter>1;
      impulse_size  =::fabs(m_buy_buffer[i]-m_buy_level_buffer[i-1]);
      atr_condition =impulse_size<m_atr.m_atr_buffer[i];
      //---
      if((m_buy_counter>1 && atr_condition) ||
         (m_break_mode==BREAK_IN_REVERSE && buy_condition && m_buy_buffer[i]<m_buy_level_buffer[i-1]) ||
         (m_break_mode==BREAK_OUT_REVERSE && buy_condition && m_buy_buffer[i]>m_buy_level_buffer[i-1]))
        {
         DeleteBuySignal(i);
        }
      //---
      sell_condition =condition1 && m_sell_counter>1;
      impulse_size   =::fabs(m_sell_buffer[i]-m_sell_level_buffer[i-1]);
      atr_condition  =impulse_size<m_atr.m_atr_buffer[i];
      //---
      if((m_sell_counter>1 && atr_condition) ||
         (m_break_mode==BREAK_IN_REVERSE && sell_condition && m_sell_buffer[i]>m_sell_level_buffer[i-1]) ||
         (m_break_mode==BREAK_OUT_REVERSE && sell_condition && m_sell_buffer[i]<m_sell_level_buffer[i-1]))
        {
         DeleteSellSignal(i);
        }
     }
  }
Now let us see take a closer look at the main file of the indicator. This version of the indicator already has 11 buffers, 7 of which are main, and 4 are auxiliary.
//--- Properties
#property indicator_chart_window
#property indicator_buffers 11
#property indicator_plots   7
#property indicator_color1  clrMediumSeaGreen
#property indicator_color2  clrRed
#property indicator_color5  clrMediumSeaGreen
#property indicator_color6  clrRed
For convenience, all the used files with classes are located in the indicator's directory in the Includes folder:
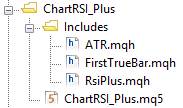
Fig. 12. Indicator directory.
Therefore, the inclusion in the main file will look as follows:
//--- Include the classes of indicators
#include "Includes\ATR.mqh"
#include "Includes\RsiPlus.mqh"
To the external parameters, we add another one for the ATR indicator period.
//--- Input parameters
input int              PeriodRSI   =8;         // RSI period
input double           SignalLevel =30;        // Signal level
input ENUM_BREAK_INOUT BreakMode   =BREAK_OUT; // Break mode
input int              PeriodATR   =200;       // ATR period
The indicators are declared with the parameters passed to the constructor.
//--- Instances of indicators for work
CATR     atr(PeriodATR);
CRsiPlus rsi(PeriodRSI,SignalLevel,BreakMode);
In the OnInit() initialization function, do not forget to pass the pointer to ATR to the RSI indicator.
//+------------------------------------------------------------------+
//| Custom indicator initialization function                         |
//+------------------------------------------------------------------+
void OnInit(void)
  {
//--- Initialization of the indicators
   rsi.AtrPointer(atr);
//--- Set indicator properties
   SetPropertiesIndicator();
  }
Since the arrays allocated for the indicator buffers are declared as public in each indicator class, their addition to the indicator in the main file looks like the usual inclusion of dynamic arrays.
//+------------------------------------------------------------------+
//| Sets indicator properties                                        |
//+------------------------------------------------------------------+
void SetPropertiesIndicator(void)
  {
//--- Short name
   ::IndicatorSetString(INDICATOR_SHORTNAME,"RSI_PLUS_CHART");
//--- Decimal places
   ::IndicatorSetInteger(INDICATOR_DIGITS,::Digits());
//--- Indicator buffers
   ::SetIndexBuffer(0,rsi.m_buy_buffer,INDICATOR_DATA);
   ::SetIndexBuffer(1,rsi.m_sell_buffer,INDICATOR_DATA);
   ::SetIndexBuffer(2,rsi.m_buy_counter_buffer,INDICATOR_DATA);
   ::SetIndexBuffer(3,rsi.m_sell_counter_buffer,INDICATOR_DATA);
   ::SetIndexBuffer(4,rsi.m_buy_level_buffer,INDICATOR_DATA);
   ::SetIndexBuffer(5,rsi.m_sell_level_buffer,INDICATOR_DATA);
   ::SetIndexBuffer(6,atr.m_atr_buffer,INDICATOR_DATA);
   ::SetIndexBuffer(7,rsi.m_rsi_buffer,INDICATOR_CALCULATIONS);
   ::SetIndexBuffer(8,rsi.m_pos_buffer,INDICATOR_CALCULATIONS);
   ::SetIndexBuffer(9,rsi.m_neg_buffer,INDICATOR_CALCULATIONS);
   ::SetIndexBuffer(10,atr.m_tr_buffer,INDICATOR_CALCULATIONS);
//--- Initialization of arrays
   atr.ZeroIndicatorBuffers();
   rsi.ZeroIndicatorBuffers();
...
  }
Auxiliary arrays used for additional calculations are not displayed on the chart and in the data window. If it is necessary to show the data in the data window while not displaying them on the chart, it is necessary to set the DRAW_NONE property for such series.
//+------------------------------------------------------------------+
//| Sets indicator properties                                        |
//+------------------------------------------------------------------+
void SetPropertiesIndicator(void)
  {
...
//--- Set the type for the indicator buffers
   ENUM_DRAW_TYPE draw_type[]={DRAW_ARROW,DRAW_ARROW,DRAW_NONE,DRAW_NONE,DRAW_LINE,DRAW_LINE,DRAW_NONE};
   for(int i=0; i<indicator_plots; i++)
      ::PlotIndexSetInteger(i,PLOT_DRAW_TYPE,draw_type[i]);
...
  }
The content of the OnCalculate() function comes down to calling two methods for calculating the ATR indicator and the modified RSI.
//+------------------------------------------------------------------+
//| Custom indicator iteration function                              |
//+------------------------------------------------------------------+
int OnCalculate(const int      rates_total,
                const int      prev_calculated,
                const datetime &time[],
                const double   &open[],
                const double   &high[],
                const double   &low[],
                const double   &close[],
                const long     &tick_volume[],
                const long     &volume[],
                const int      &spread[])
  {
//--- Calculate the ATR indicator
   if(!atr.CalculateIndicatorATR(rates_total,prev_calculated,time,close,high,low))
      return(0);
//--- Calculate the RSI indicator
   if(!rsi.CalculateIndicatorRSI(rates_total,prev_calculated,close,spread))
      return(0);
//--- Return the last calculated number of elements
   return(rates_total);
  }
After compiling and loading the indicator on the chart, you will see a result as shown in Figure 13. The levels plotted based on the indicator signals form a kind of channel. It is easy to use it to determine the distance the price has passed since the last opposite signals of the previous series.

Fig. 13. Operation result of the modified RSI indicator on the main chart.
When developing a trading system, it may be necessary to visualize the precise values of one or another indicator buffer. This is particularly true when the series of some buffers with values falling out of sight are not displayed on the chart. Their values can be seen in the Data Window. For convenience, you can enable the crosshair using the middle mouse button. In Figure 14, the ATR indicator from the standard package is added to the chart, so that it can be compared with the one calculated in the modified RSI.
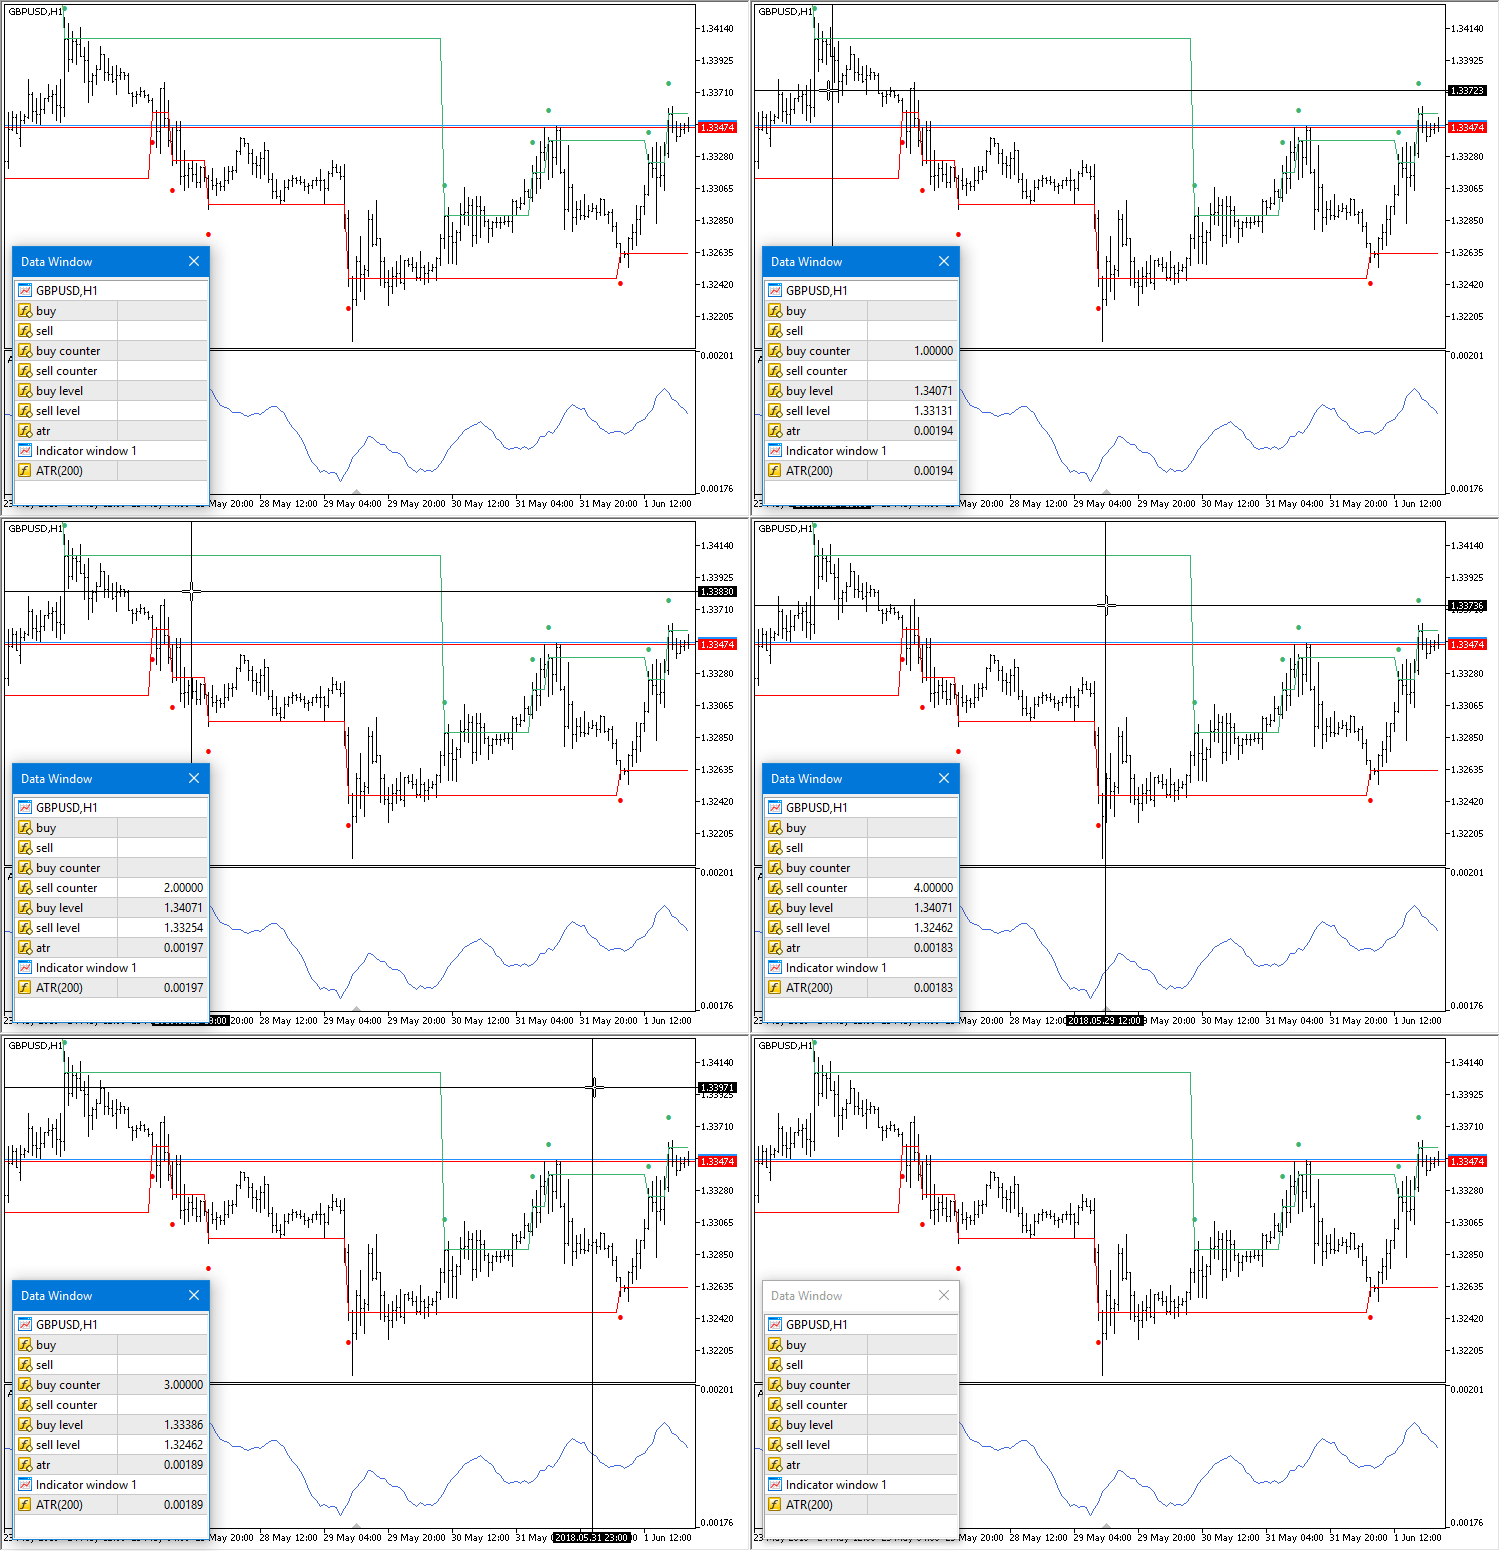
Fig. 14. Viewing values in the indicator data window.
The fifth version. Universal RSI indicator for working in two directions simultaneously
And what if we need an indicator that shows signals in two directions simultaneously? After all, MetaTrader 5 provides the ability to open hedging accounts, meaning that it is possible to develop a system with differently directed positions. It would be useful to have an indicator that generates signals both in a trend and in a flat.
Let us briefly consider how to create such an indicator. We already have everything necessary, and the changes will only be made in the main file. This version will have 20 buffers in total, of which 15 will be used for drawing.
#property indicator_buffers 20
#property indicator_plots   15
Trend-based signals will be displayed as arrows, and as dots for the flat-based signals. This will better visualize the type any particular signal belongs to, making it easier to understand.
//--- Arrows for signals: 159 - dots; 233/234 - arrows;
#define ARROW_BUY_IN   233
#define ARROW_SELL_IN  234
#define ARROW_BUY_OUT  159
#define ARROW_SELL_OUT 159
The same files as in the previous version are included, also in the local directory of the indicator. Subsequently, you will have the ability to place a single copy of these files, wherever you feel comfortable.
//--- Include the classes of indicators
#include "Includes\ATR.mqh"
#include "Includes\RsiPlus.mqh"
In this version of the indicator, it is not necessary to specify the signal type in the external parameters. But let us make it possible to specify the levels for trend-based signals (Signal level In) and flat-based ones (Signal level Out) separately.
//--- Input parameters
input int    PeriodRSI      =8;   // RSI period
input double SignalLevelIn  =35;  // Signal level In
input double SignalLevelOut =30;  // Signal level Out
input int    PeriodATR      =100; // ATR period
Then it is necessary to declare two instances of the CRsiPlus class: one for the trend-based signals, and another for signals in a flat. In both cases, the reverse types of signals are used (BREAK_IN_REVERSE and BREAK_OUT_REVERSE). That is, the impulse out of the channel will serve as a signal for the flat; and for the trend, entries will be made in the trend direction after a rollback.
//--- Instances of indicators for work
CATR atr(PeriodATR);
CRsiPlus rsi_in(PeriodRSI,SignalLevelIn,BREAK_IN_REVERSE);
CRsiPlus rsi_out(PeriodRSI,SignalLevelOut,BREAK_OUT_REVERSE);
Pointer to the ATR indicator should be passed to both instances of RSI:
//+------------------------------------------------------------------+
//| Custom indicator initialization function                         |
//+------------------------------------------------------------------+
void OnInit(void)
  {
//--- Passing the pointer to ATR
   rsi_in.AtrPointer(atr);
   rsi_out.AtrPointer(atr);
//--- Set indicator properties
   SetPropertiesIndicator();
  }
The indicator buffers for each instance are set in such sequence to make it easier to navigate in the code. The sequence, of course, does not matter. You only need to know the buffer number to get the values of any particular series to form the conditions in the Expert Advisor later.
//+------------------------------------------------------------------+
//| Sets indicator properties                                        |
//+------------------------------------------------------------------+
void SetPropertiesIndicator(void)
  {
//--- Short name
   ::IndicatorSetString(INDICATOR_SHORTNAME,"RSI_PLUS2_CHART");
//--- Decimal places
   ::IndicatorSetInteger(INDICATOR_DIGITS,::Digits());
//--- Indicator buffers
   ::SetIndexBuffer(0,rsi_in.m_buy_buffer,INDICATOR_DATA);
   ::SetIndexBuffer(1,rsi_in.m_sell_buffer,INDICATOR_DATA);
   ::SetIndexBuffer(2,rsi_in.m_buy_counter_buffer,INDICATOR_DATA);
   ::SetIndexBuffer(3,rsi_in.m_sell_counter_buffer,INDICATOR_DATA);
   ::SetIndexBuffer(4,rsi_in.m_buy_level_buffer,INDICATOR_DATA);
   ::SetIndexBuffer(5,rsi_in.m_sell_level_buffer,INDICATOR_DATA);
   ::SetIndexBuffer(6,rsi_in.m_rsi_buffer,INDICATOR_CALCULATIONS);
   ::SetIndexBuffer(7,rsi_in.m_pos_buffer,INDICATOR_CALCULATIONS);
   ::SetIndexBuffer(8,rsi_in.m_neg_buffer,INDICATOR_CALCULATIONS);
//---
   ::SetIndexBuffer(9,rsi_out.m_buy_buffer,INDICATOR_DATA);
   ::SetIndexBuffer(10,rsi_out.m_sell_buffer,INDICATOR_DATA);
   ::SetIndexBuffer(11,rsi_out.m_buy_counter_buffer,INDICATOR_DATA);
   ::SetIndexBuffer(12,rsi_out.m_sell_counter_buffer,INDICATOR_DATA);
   ::SetIndexBuffer(13,rsi_out.m_buy_level_buffer,INDICATOR_DATA);
   ::SetIndexBuffer(14,rsi_out.m_sell_level_buffer,INDICATOR_DATA);
   ::SetIndexBuffer(15,rsi_out.m_rsi_buffer,INDICATOR_CALCULATIONS);
   ::SetIndexBuffer(16,rsi_out.m_pos_buffer,INDICATOR_CALCULATIONS);
   ::SetIndexBuffer(17,rsi_out.m_neg_buffer,INDICATOR_CALCULATIONS);
//---
   ::SetIndexBuffer(18,atr.m_atr_buffer,INDICATOR_DATA);
   ::SetIndexBuffer(19,atr.m_tr_buffer,INDICATOR_CALCULATIONS);
//--- Initialization of arrays
   atr.ZeroIndicatorBuffers();
   rsi_in.ZeroIndicatorBuffers();
   rsi_out.ZeroIndicatorBuffers();
...
  }
To avoid confusion of what signal level belongs to which type of signals, they will be drawn with a dashed line for the flat.
//+------------------------------------------------------------------+
//| Sets indicator properties                                        |
//+------------------------------------------------------------------+
void SetPropertiesIndicator(void)
  {
...
//--- Set the line style for the specified indicator buffers
   ::PlotIndexSetInteger(13,PLOT_LINE_STYLE,STYLE_DOT);
   ::PlotIndexSetInteger(14,PLOT_LINE_STYLE,STYLE_DOT);
...
  }
The code of the OnCalculate() function is limited to only calling the methods for each instance of the indicator.
//+------------------------------------------------------------------+
//| Custom indicator iteration function                              |
//+------------------------------------------------------------------+
int OnCalculate(const int      rates_total,
                const int      prev_calculated,
                const datetime &time[],
                const double   &open[],
                const double   &high[],
                const double   &low[],
                const double   &close[],
                const long     &tick_volume[],
                const long     &volume[],
                const int      &spread[])
  {
//--- Calculate the ATR indicator
   if(!atr.CalculateIndicatorATR(rates_total,prev_calculated,time,close,high,low))
      return(0);
//--- Calculate the RSI indicator
   if(!rsi_in.CalculateIndicatorRSI(rates_total,prev_calculated,close,spread))
      return(0);
   if(!rsi_out.CalculateIndicatorRSI(rates_total,prev_calculated,close,spread))
      return(0);
//--- Return the last calculated number of elements
   return(rates_total);
  }
Figure 15 demonstrates the indicator operation on the chart. All this is only the result of running RSI.
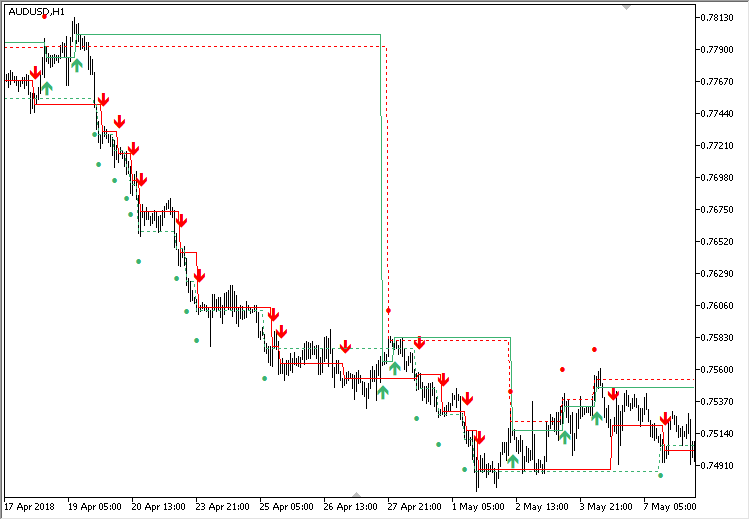
Fig. 15. The universal RSI indicator.
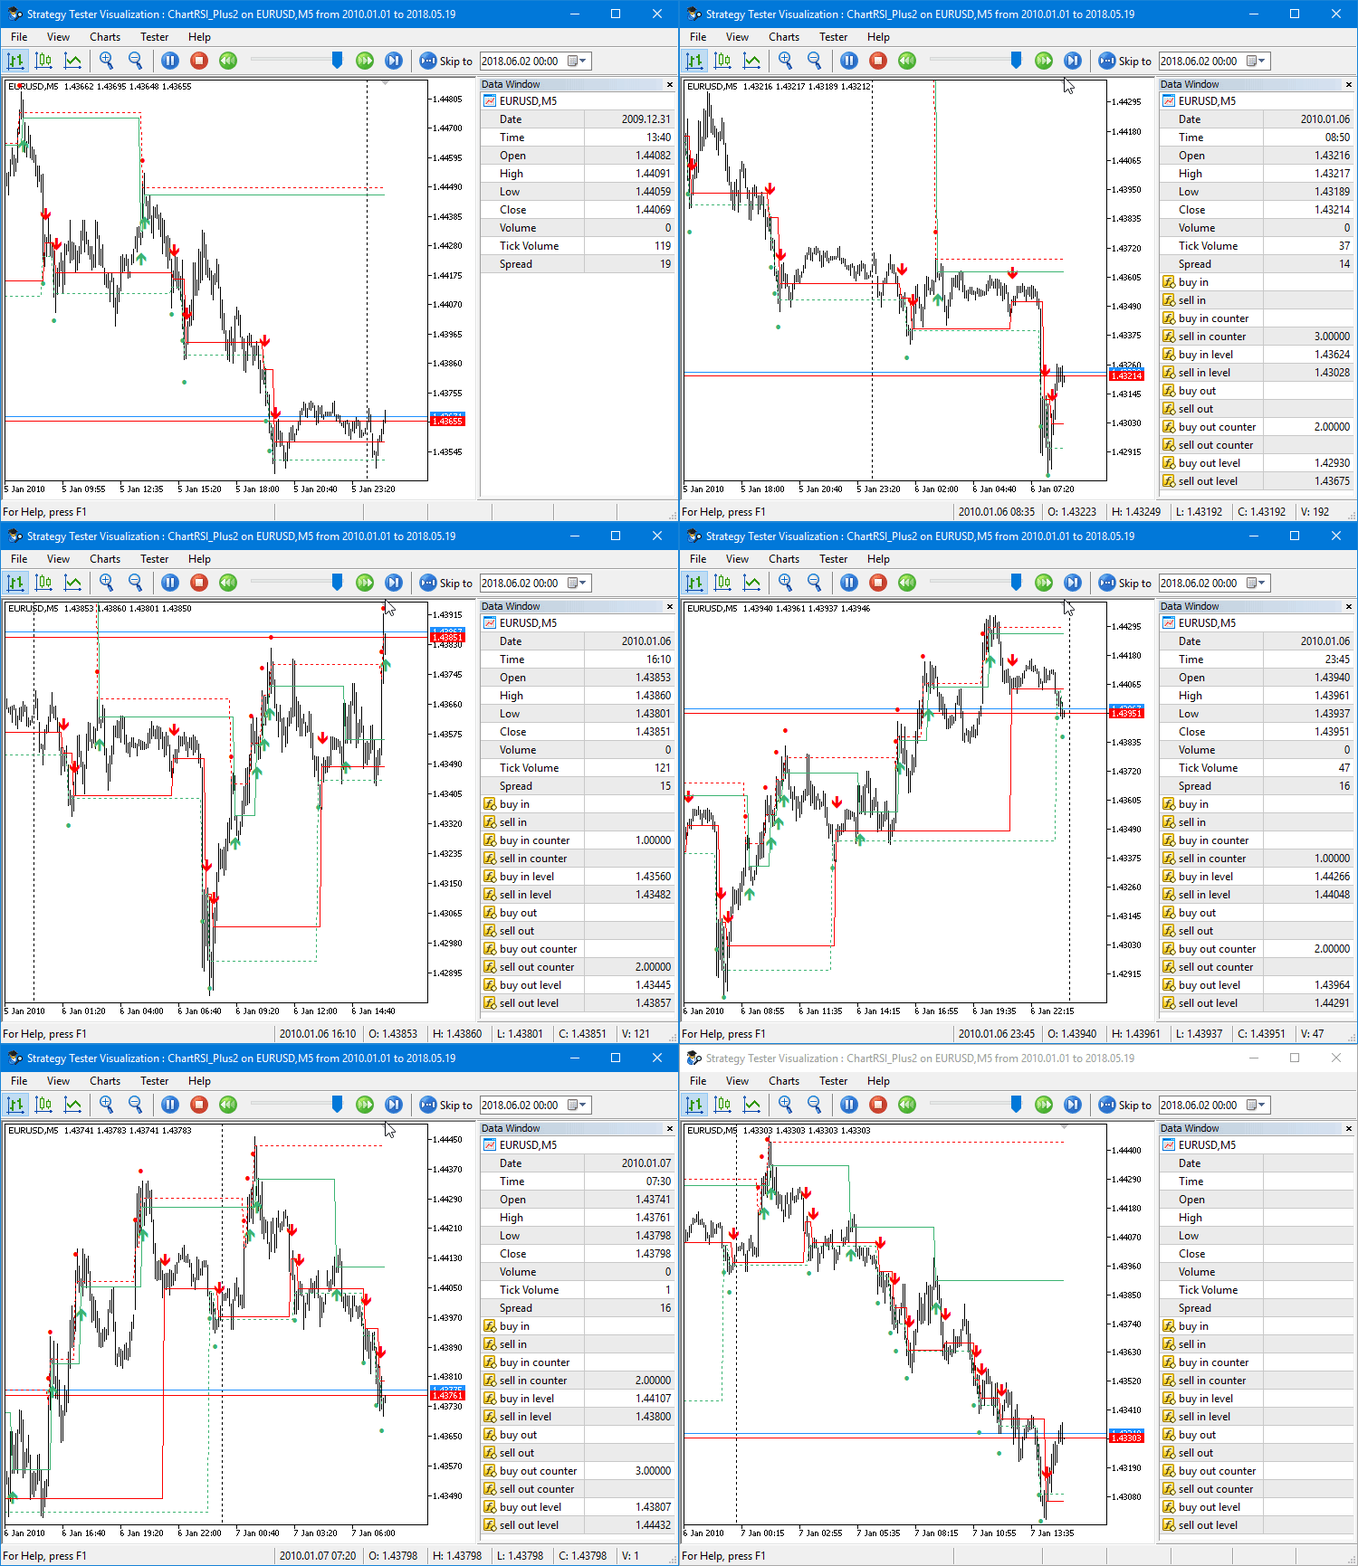
Fig. 16. The universal RSI indicator in the strategy tester.
In this form, the indicator shows the entry points, as well as the points for increasing the position volume. In addition, it is possible to obtain the index of the current signal in the continuous series it belongs to. And since there are also price levels, it is possible to obtain the distance the price has moved from the last signal from the previous series. A more complex trading algorithm can be implemented as well. For example, when opening positions by trend, they can be closed partially or fully based on the signals designed for working in a flat.
Considering the results of the indicator on the chart, you can come up with different trading algorithms that first need to checked in the tester. This is also a large-scale work: there can be infinitely many variants for implementation. Each trading module can be made to receive the trading results of another. That is, the trend trading module can receive the trading result of the flat trading module, and vice versa. Based on these data, they can adjust their behavior, adapting to the current situation. Each module can influence the trading tactics of each other: modify the conditions for opening, closing or managing positions, modify the management system (converting it from a conservative model to an aggressive one and vice versa). The trading system can be very complex and adapt to the current price action.
Conclusion
As you can see, a simple indicator can be made much more informative. In its turn, this facilitates the development of trading algorithms. Otherwise, all this would have to be done within the Expert Advisor, complicating its code. Now everything is hidden inside one program, and you can simply read the calculated values in its arrays.
You can continue to develop this idea. For example, you can introduce addition buffers for new characteristics that specify the trend or flat state. You can add a buffer for trailing stop, the calculation of which can be tied to the current volatility (the ATR indicator). As a result, all the necessary calculations will be implemented in an indicator, while the Expert Advisor will simple receive the prepared levels.
| File name | Comment |
|---|---|
| MQL5\Indicators\RSI\RSI_Plus1.mq5 | The first version of the modified RSI indicator |
| MQL5\Indicators\RSI\RSI_Plus2.mq5 | The second version of the modified RSI indicator |
| MQL5\Indicators\RSI\RSI_Plus3.mq5 | The third version of the modified RSI indicator |
| MQL5\Indicators\RSI\ChartRSI_Plus1\ChartRSI_Plus1.mq5 | The fourth version of the modified RSI indicator |
| MQL5\Indicators\RSI\ChartRSI_Plus2\ChartRSI_Plus2.mq5 | The fifth version of the modified RSI indicator |
Translated from Russian by MetaQuotes Ltd.
Original article: https://www.mql5.com/ru/articles/4828
Warning: All rights to these materials are reserved by MetaQuotes Ltd. Copying or reprinting of these materials in whole or in part is prohibited.
This article was written by a user of the site and reflects their personal views. MetaQuotes Ltd is not responsible for the accuracy of the information presented, nor for any consequences resulting from the use of the solutions, strategies or recommendations described.
 Developing stock indicators featuring volume control through the example of the delta indicator
 Custom presentation of trading history and creation of report diagrams
- Free trading apps
- Over 8,000 signals for copying
- Economic news for exploring financial markets
You agree to website policy and terms of use
It looks interesting but when I compile it in the latest version MT5 I get 70 errors!
Can you help and check if this is still working in latest version of MT5, please?
Great article and amazing work, comes with entry points and where to reinforce our position... congratulations.
I just installed this.
Just one question. I was watching the several files, can you set an alarm?
hiI would like to know if you could explain how to make this type of indicator based on an rsi.
because the reality is that this indicator has already been made but it does not allow me to make modifications such as removing the signals, or putting the parameters that I really need, I would like to know how this type of indicator would be made from the rsi, or how I could do to put the arrows directly on the candle as part of a separate signal to make it work automatically with those parameters. if anyone knows contact me 809-404-0295.Awesome Article.
Thank you so much.