Articles with examples of indicators developed in MQL5
The articles contain detailed explanation of the attached codes. Download and open them in MetaEditor and program together with the author while reading the article.
Add a new article

You are missing trading opportunities:
- Free trading apps
- Over 8,000 signals for copying
- Economic news for exploring financial markets
Registration
Log in
You agree to website policy and terms of use
If you do not have an account, please register
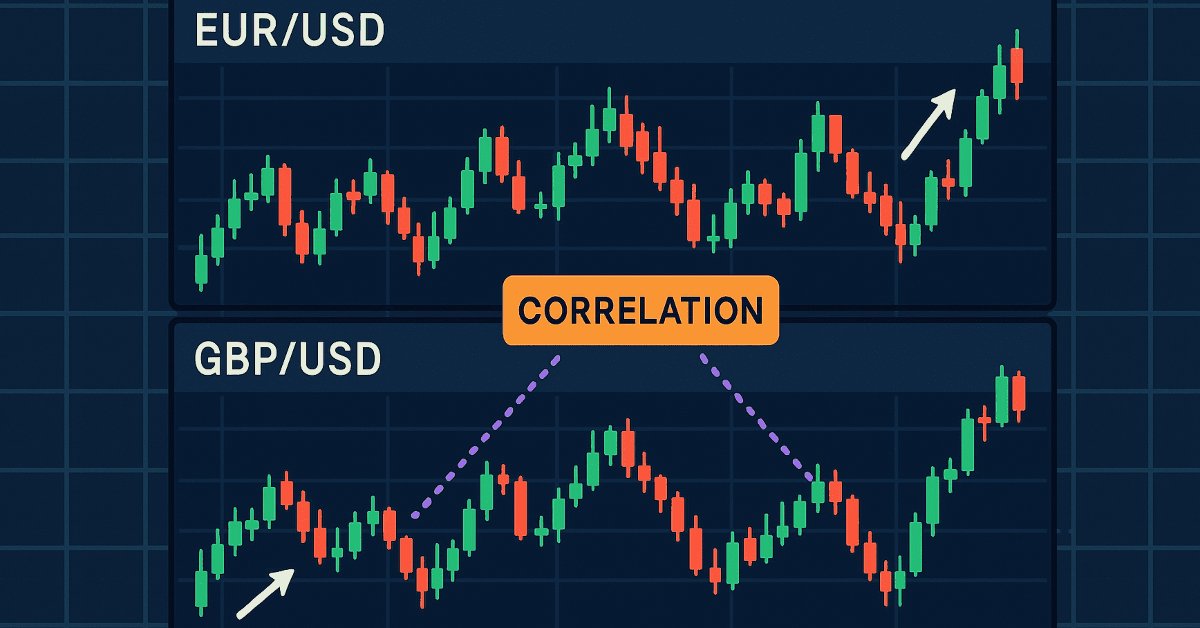
Price Action Analysis Toolkit Development (Part 20): External Flow (IV) — Correlation Pathfinder
Correlation Pathfinder offers a fresh approach to understanding currency pair dynamics as part of the Price Action Analysis Toolkit Development Series. This tool automates data collection and analysis, providing insight into how pairs like EUR/USD and GBP/USD interact. Enhance your trading strategy with practical, real-time information that helps you manage risk and spot opportunities more effectively.

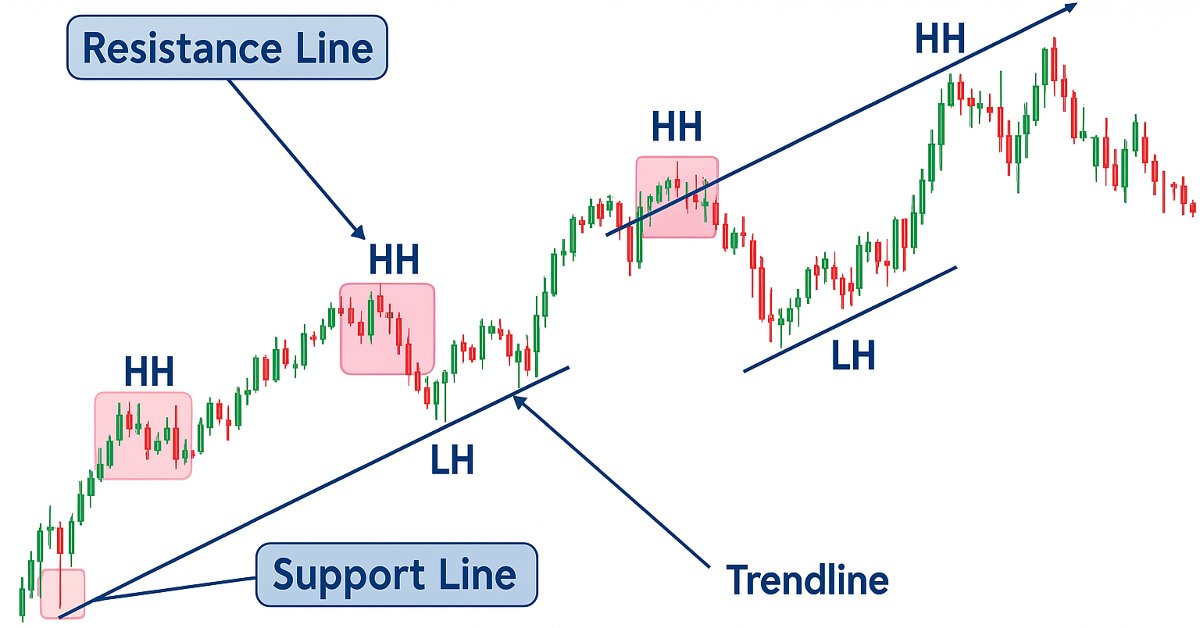
Introduction to MQL5 (Part 15): A Beginner's Guide to Building Custom Indicators (IV)
In this article, you'll learn how to build a price action indicator in MQL5, focusing on key points like low (L), high (H), higher low (HL), higher high (HH), lower low (LL), and lower high (LH) for analyzing trends. You'll also explore how to identify the premium and discount zones, mark the 50% retracement level, and use the risk-reward ratio to calculate profit targets. The article also covers determining entry points, stop loss (SL), and take profit (TP) levels based on the trend structure.

Developing a Trading System Based on the Order Book (Part I): Indicator
Depth of Market is undoubtedly a very important element for executing fast trades, especially in High Frequency Trading (HFT) algorithms. In this series of articles, we will look at this type of trading events that can be obtained through a broker on many tradable symbols. We will start with an indicator, where you can customize the color palette, position and size of the histogram displayed directly on the chart. We will also look at how to generate BookEvent events to test the indicator under certain conditions. Other possible topics for future articles include how to store price distribution data and how to use it in a strategy tester.
Price Action Analysis Toolkit Development (Part 19): ZigZag Analyzer
Every price action trader manually uses trendlines to confirm trends and spot potential turning or continuation levels. In this series on developing a price action analysis toolkit, we introduce a tool focused on drawing slanted trendlines for easy market analysis. This tool simplifies the process for traders by clearly outlining key trends and levels essential for effective price action evaluation.

Simple solutions for handling indicators conveniently
In this article, I will describe how to make a simple panel to change the indicator settings directly from the chart, and what changes need to be made to the indicator to connect the panel. This article is intended for novice MQL5 users.

Introduction to MQL5 (Part 14): A Beginner's Guide to Building Custom Indicators (III)
Learn to build a Harmonic Pattern indicator in MQL5 using chart objects. Discover how to detect swing points, apply Fibonacci retracements, and automate pattern recognition.

Price Action Analysis Toolkit Development (Part 18): Introducing Quarters Theory (III) — Quarters Board
In this article, we enhance the original Quarters Script by introducing the Quarters Board, a tool that lets you toggle quarter levels directly on the chart without needing to revisit the code. You can easily activate or deactivate specific levels, and the EA also provides trend direction commentary to help you better understand market movements.

From Novice to Expert: Support and Resistance Strength Indicator (SRSI)
In this article, we will share insights on how to leverage MQL5 programming to pinpoint market levels—differentiating between weaker and strongest price levels. We will fully develop a working, Support and Resistance Strength Indicator (SRSI).

Price Action Analysis Toolkit Development (Part 17): TrendLoom EA Tool
As a price action observer and trader, I've noticed that when a trend is confirmed by multiple timeframes, it usually continues in that direction. What may vary is how long the trend lasts, and this depends on the type of trader you are, whether you hold positions for the long term or engage in scalping. The timeframes you choose for confirmation play a crucial role. Check out this article for a quick, automated system that helps you analyze the overall trend across different timeframes with just a button click or regular updates.

Cycles and Forex
Cycles are of great importance in our lives. Day and night, seasons, days of the week and many other cycles of different nature are present in the life of any person. In this article, we will consider cycles in financial markets.

Introduction to MQL5 (Part 13): A Beginner's Guide to Building Custom Indicators (II)
This article guides you through building a custom Heikin Ashi indicator from scratch and demonstrates how to integrate custom indicators into an EA. It covers indicator calculations, trade execution logic, and risk management techniques to enhance automated trading strategies.

William Gann methods (Part II): Creating Gann Square indicator
We will create an indicator based on the Gann's Square of 9, built by squaring time and price. We will prepare the code and test the indicator in the platform on different time intervals.

William Gann methods (Part I): Creating Gann Angles indicator
What is the essence of Gann Theory? How are Gann angles constructed? We will create Gann Angles indicator for MetaTrader 5.

Price Action Analysis Toolkit Development (Part 13): RSI Sentinel Tool
Price action can be effectively analyzed by identifying divergences, with technical indicators such as the RSI providing crucial confirmation signals. In the article below, we explain how automated RSI divergence analysis can identify trend continuations and reversals, thereby offering valuable insights into market sentiment.

Building a Keltner Channel Indicator with Custom Canvas Graphics in MQL5
In this article, we build a Keltner Channel indicator with custom canvas graphics in MQL5. We detail the integration of moving averages, ATR calculations, and enhanced chart visualization. We also cover backtesting to evaluate the indicator’s performance for practical trading insights.

Introduction to MQL5 (Part 12): A Beginner's Guide to Building Custom Indicators
Learn how to build a custom indicator in MQL5. With a project-based approach. This beginner-friendly guide covers indicator buffers, properties, and trend visualization, allowing you to learn step-by-step.

Custom Indicator: Plotting Partial Entry, Exit and Reversal Deals for Netting Accounts
In this article, we will look at a non-standard way of creating an indicator in MQL5. Instead of focusing on a trend or chart pattern, our goal will be to manage our own positions, including partial entries and exits. We will make extensive use of dynamic matrices and some trading functions related to trade history and open positions to indicate on the chart where these trades were made.

Chaos theory in trading (Part 2): Diving deeper
We continue our dive into chaos theory in financial markets. This time I will consider its applicability to the analysis of currencies and other assets.

Price Action Analysis Toolkit Development (Part 10): External Flow (II) VWAP
Master the power of VWAP with our comprehensive guide! Learn how to integrate VWAP analysis into your trading strategy using MQL5 and Python. Maximize your market insights and improve your trading decisions today.

Introduction to MQL5 (Part 11): A Beginner's Guide to Working with Built-in Indicators in MQL5 (II)
Discover how to develop an Expert Advisor (EA) in MQL5 using multiple indicators like RSI, MA, and Stochastic Oscillator to detect hidden bullish and bearish divergences. Learn to implement effective risk management and automate trades with detailed examples and fully commented source code for educational purposes!

Price Action Analysis Toolkit Development (Part 6): Mean Reversion Signal Reaper
While some concepts may seem straightforward at first glance, bringing them to life in practice can be quite challenging. In the article below, we'll take you on a journey through our innovative approach to automating an Expert Advisor (EA) that skillfully analyzes the market using a mean reversion strategy. Join us as we unravel the intricacies of this exciting automation process.

Mastering File Operations in MQL5: From Basic I/O to Building a Custom CSV Reader
This article focuses on essential MQL5 file-handling techniques, spanning trade logs, CSV processing, and external data integration. It offers both conceptual understanding and hands-on coding guidance. Readers will learn to build a custom CSV importer class step-by-step, gaining practical skills for real-world applications.

Price Action Analysis Toolkit Development (Part 3): Analytics Master — EA
Moving from a simple trading script to a fully functioning Expert Advisor (EA) can significantly enhance your trading experience. Imagine having a system that automatically monitors your charts, performs essential calculations in the background, and provides regular updates every two hours. This EA would be equipped to analyze key metrics that are crucial for making informed trading decisions, ensuring that you have access to the most current information to adjust your strategies effectively.

Price Action Analysis Toolkit Development (Part 1): Chart Projector
This project aims to leverage the MQL5 algorithm to develop a comprehensive set of analysis tools for MetaTrader 5. These tools—ranging from scripts and indicators to AI models and expert advisors—will automate the market analysis process. At times, this development will yield tools capable of performing advanced analyses with no human involvement and forecasting outcomes to appropriate platforms. No opportunity will ever be missed. Join me as we explore the process of building a robust market analysis custom tools' chest. We will begin by developing a simple MQL5 program that I have named, Chart Projector.

From Novice to Expert: Collaborative Debugging in MQL5
Problem-solving can establish a concise routine for mastering complex skills, such as programming in MQL5. This approach allows you to concentrate on solving problems while simultaneously developing your skills. The more problems you tackle, the more advanced expertise is transferred to your brain. Personally, I believe that debugging is the most effective way to master programming. Today, we will walk through the code-cleaning process and discuss the best techniques for transforming a messy program into a clean, functional one. Read through this article and uncover valuable insights.

Example of new Indicator and Conditional LSTM
This article explores the development of an Expert Advisor (EA) for automated trading that combines technical analysis with deep learning predictions.

Building A Candlestick Trend Constraint Model (Part 6): All in one integration
One major challenge is managing multiple chart windows of the same pair running the same program with different features. Let's discuss how to consolidate several integrations into one main program. Additionally, we will share insights on configuring the program to print to a journal and commenting on the successful signal broadcast on the chart interface. Find more information in this article as we progress the article series.

Eigenvectors and eigenvalues: Exploratory data analysis in MetaTrader 5
In this article we explore different ways in which the eigenvectors and eigenvalues can be applied in exploratory data analysis to reveal unique relationships in data.

Angle-based operations for traders
This article will cover angle-based operations. We will look at methods for constructing angles and using them in trading.

Building A Candlestick Trend Constraint Model (Part 4): Customizing Display Style For Each Trend Wave
In this article, we will explore the capabilities of the powerful MQL5 language in drawing various indicator styles on Meta Trader 5. We will also look at scripts and how they can be used in our model.

Master MQL5 from beginner to pro (Part II): Basic data types and use of variable
This is a continuation of the series for beginners. In this article, we'll look at how to create constants and variables, write dates, colors, and other useful data. We will learn how to create enumerations like days of the week or line styles (solid, dotted, etc.). Variables and expressions are the basis of programming. They are definitely present in 99% of programs, so understanding them is critical. Therefore, if you are new to programming, this article can be very useful for you. Required programming knowledge level: very basic, within the limits of my previous article (see the link at the beginning).
DRAW_ARROW drawing type in multi-symbol multi-period indicators
In this article, we will look at drawing arrow multi-symbol multi-period indicators. We will also improve the class methods for correct display of arrows showing data from arrow indicators calculated on a symbol/period that does not correspond to the symbol/period of the current chart.
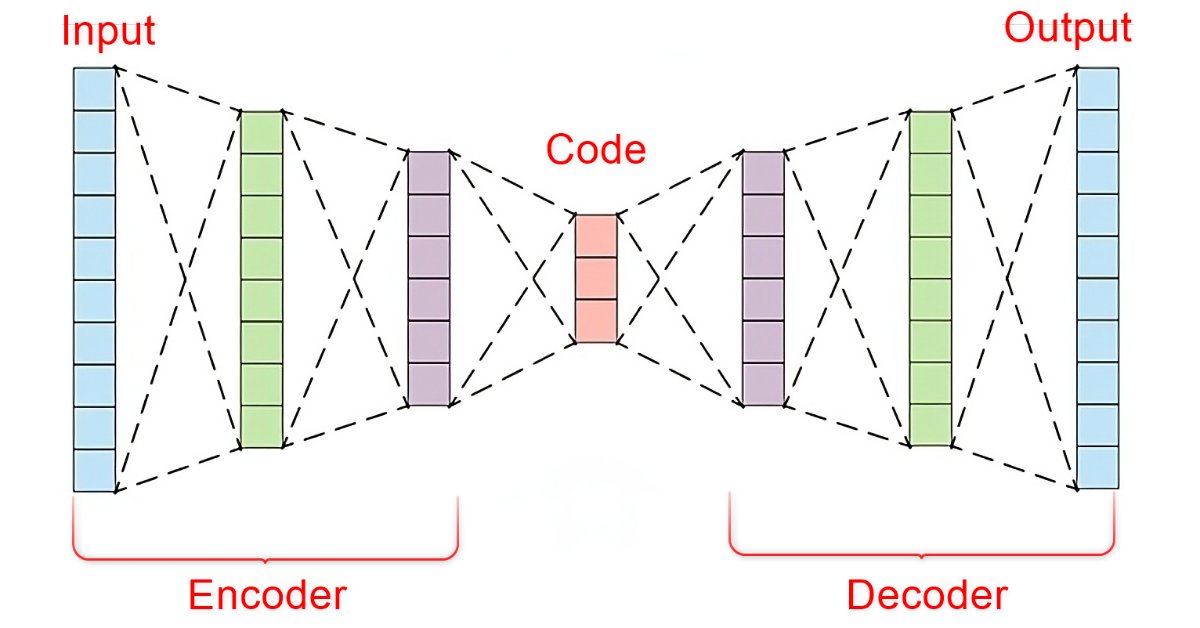
Data Science and Machine Learning (Part 22): Leveraging Autoencoders Neural Networks for Smarter Trades by Moving from Noise to Signal
In the fast-paced world of financial markets, separating meaningful signals from the noise is crucial for successful trading. By employing sophisticated neural network architectures, autoencoders excel at uncovering hidden patterns within market data, transforming noisy input into actionable insights. In this article, we explore how autoencoders are revolutionizing trading practices, offering traders a powerful tool to enhance decision-making and gain a competitive edge in today's dynamic markets.

Custom Indicators (Part 1): A Step-by-Step Introductory Guide to Developing Simple Custom Indicators in MQL5
Learn how to create custom indicators using MQL5. This introductory article will guide you through the fundamentals of building simple custom indicators and demonstrate a hands-on approach to coding different custom indicators for any MQL5 programmer new to this interesting topic.

How to build and optimize a volatility-based trading system (Chaikin Volatility - CHV)
In this article, we will provide another volatility-based indicator named Chaikin Volatility. We will understand how to build a custom indicator after identifying how it can be used and constructed. We will share some simple strategies that can be used and then test them to understand which one can be better.

Indicator of historical positions on the chart as their profit/loss diagram
In this article, I will consider the option of obtaining information about closed positions based on their trading history. Besides, I will create a simple indicator that displays the approximate profit/loss of positions on each bar as a diagram.

Color buffers in multi-symbol multi-period indicators
In this article, we will review the structure of the indicator buffer in multi-symbol, multi-period indicators and organize the display of colored buffers of these indicators on the chart.

Master MQL5 from beginner to pro (Part I): Getting started with programming
This article is an introduction to a series of articles about programming. It is assumed here that the reader has never dealt with programming before. So, this series starts from the very basics. Programming knowledge level: Absolute Beginner.

Creating multi-symbol, multi-period indicators
In this article, we will look at the principles of creating multi-symbol, multi-period indicators. We will also see how to access the data of such indicators from Expert Advisors and other indicators. We will consider the main features of using multi-indicators in Expert Advisors and indicators and will see how to plot them through custom indicator buffers.

Experiments with neural networks (Part 7): Passing indicators
Examples of passing indicators to a perceptron. The article describes general concepts and showcases the simplest ready-made Expert Advisor followed by the results of its optimization and forward test.