
An Analysis of Why Expert Advisors Fail
Introduction
Expert advisors (EAs) may perform well over a period of months and even a few years, but there are always periods of time where performance is poor. EAs rarely show a steady profit over an extended period of time, such as ten years. If an EA has past periods of poor performance, then how can it be expected to always perform well in the future?
In this analysis, two questions arise: What changes occur in the time series data that strongly affect the performance of the EA? Is there a technical indicator that can predict when an EA will have poor performance and when it will have good performance? Such an indicator would be most valuable!
Moving Average Crossover Triggers
To study these issues, 15 minute currency data over a period of sixteen years is used along with a test-bed strategy, the Moving Average Crossover. For the Moving Average Crossover (MAC) trigger, a buy signal is generated when the fast Simple Moving Average (SMA) crosses up over the slow SMA and a sell signal is generated when the fast SMA crosses down over the slow SMA. The MAC strategy should provide a good test-bed for study. Key input parameters for the MAC strategy are the fast and slow SMA periods. The fast SMA period is typically 1 to 4 in these studies and the slow SMA period is 10 to 150 and both are assumed to be fixed during the test period.
Figure 1 shows the profit return behavior of the SMA Crossover trigger for the EURUSD currency pair from January 2006 through December 2021. For the optimized SMA fast and slow periods of 2 and 80, the EA has a positive return for some intervals and negative return for other intervals. The period of 1/2008 – 6/2013 has a steady profit growth. Figure 2 shows the profit return behavior of the SMA Crossover trigger for the GBPUSD currency pair for the same interval for the optimized SMA periods of 1 and 80. The GBPUSD chart shows only brief periods of positive profit performance.

Figure 1. EURUSD SMA Cross Trigger Profit (0.1 Lot)

Figure 2. GBPUSD SMA Cross Trigger Profit (0.1 Lot)
Given the time behaviors shown in Figures 1 and 2, we can examine the time behavior of common technical indicators to determine if there is any relationship between technical indicator time behavior and moving average crossover profit return time behavior.
Behavior of Traditional Technical Indicators
Several standard technical indicators can be examined to see if their behavior is different in time regions of positive and negative return. Figure 3 shows the monthly Average True Range (ATR) indicator over a sixteen year period for EURUSD. The ATR indicator provides a measure of the currency pair volatility. It exhibits definite time dependent behavior but nothing corresponding to the profit time behavior in Figure 1. Interestingly, Figure 3 shows the extreme volatility around the economic crisis of late 2008 and again in early 2020. It also suggests that using absolute thresholds of price change for triggering logic is unwise and that the smoothed ATR value should be considered. Another common technical indicator is the spread of the upper and lower Bollinger Bands. This indicator should be influenced by both volatility and trend strength. Surprisingly, its long term monthly behavior, as shown in Figure 4, is nearly identical to the ATR indicator. Like the ATR indicator, it has no behavior corresponding to positive and negative return time regions in the EURUSD data of Figure 1. Similar results are seen for the GBPUSD data. Long-term volatility does not account for the time behavior seen in figures 1 and 2.
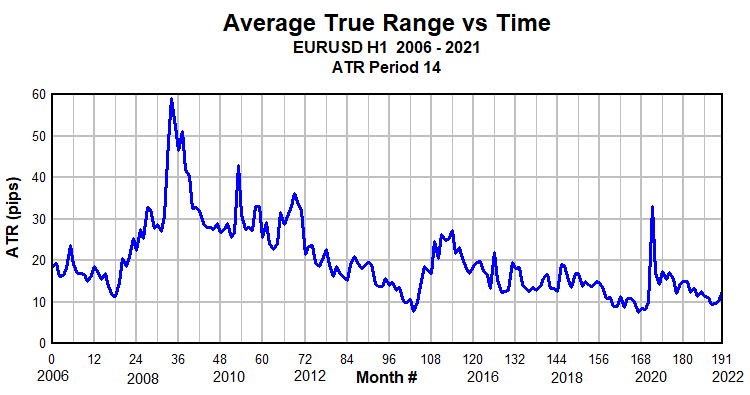
Figure 3. EURUSD ATR, Monthly Average
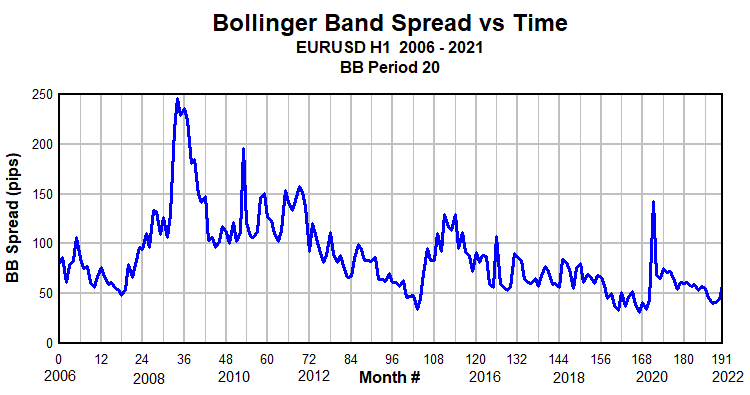
Figure 4. EURUSD Bollinger Band Spread, Monthly Average
Autocorrelation Function as an Indicator
Unlike the ATR and Bollinger Bands indicators, the AutoCorrelation Function (ACF) does not have a dependence on volatility. The ACF is a helpful tool to find patterns in time series data. The ACF measures the correlation of elements in a time series with elements in this time series delayed by a lag time. When a trend is present in the data, the ACF, for small lags, will have positive values. In this analysis, the Yi element in the time series is defined as the (Close Price - Open Price) of bar i.
For a time series of N elements Yi , i =1...N, the ACF is defined as:

The autocorrelation function for a series of price data is much different than the autocorrelation of a series of bar to bar price change data. For instance, for a series of numbers {1,2,3..14} the ACF is 0.786. For a series of differences between consecutive elements of that array, the ACF will be close to zero (assuming a little noise in the values to avoid divide by zero).
Computation of the ACF is implemented in the following code snippet:
 double GetAtCorrVal(double &ClsOpn[],int CorrPer, int LagPer,int joff ) {
   double corr;
   double AIn[],BIn[];
   double XMean,XNum,XDen;
   int jj;
   ArrayResize(AIn,CorrPer);
   ArrayResize(BIn,CorrPer);
   XMean = 0.;
   XNum = 0.;
   XDen = 0.;
   corr = 0.;
   if(CorrPer<2)
    {
     Print("No AutoCorr Processing Allowed ");
     return(corr);
    }
   // mean
   for(jj=0;jj<CorrPer;jj++)
    {
     XMean +=ClsOpn[jj+joff];
    }
   XMean = XMean/CorrPer;
  // variances
   for(jj=0;jj<CorrPer;jj++)
    {
     if(jj<(CorrPer-LagPer))
       XNum  += (ClsOpn[jj+joff]-XMean)*(ClsOpn[jj+LagPer+joff]-XMean);
     XDen += (ClsOpn[jj+joff]-XMean)*(ClsOpn[jj+joff]-XMean);
    }
    if(XDen==0.)
     {
      corr = 0.;
     }
    else
    corr = XNum/XDen;
   return(corr);
  }
//----------------------------------------------------------------
Figure 5 shows the monthly average of the ACF over the sixteen year period for EURUSD data with a smoothing period of six months. Figure 1 shows a profitable performance between 2008 and the end of 2012, while Figure 5 also shows a slightly higher ACF value in this time region, suggesting possible relationship between profit performance of the MAC strategy and the value of the ACF.
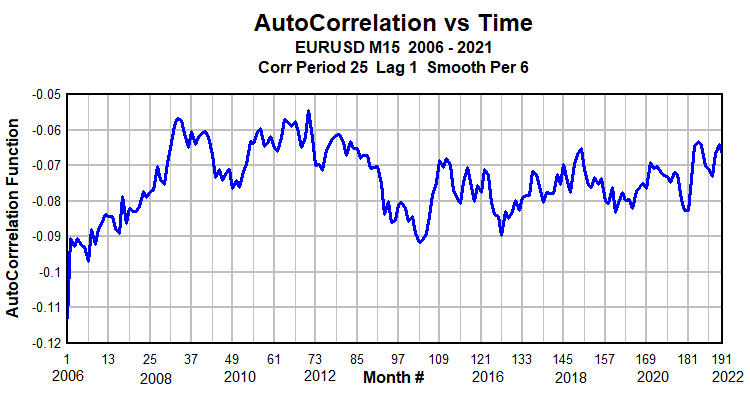
Figure 5. EURUSD AutoCorrelation Function Monthly Average
For the GBUUSD data shown in Figure 6, a weak linkage between profit performance (shown in Figure 2) and the ACF value can be seen.
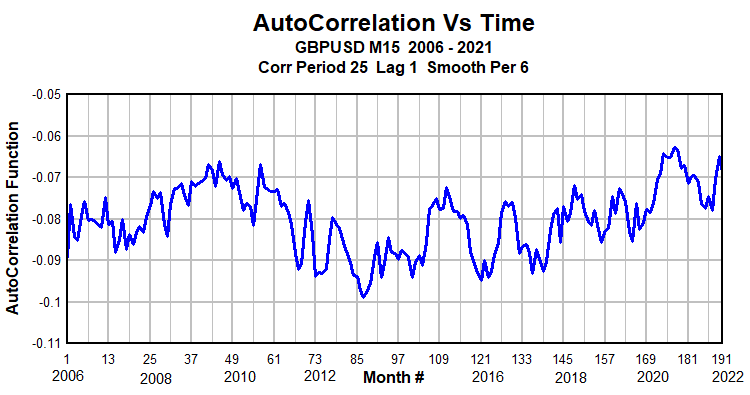
Figure 6. GBPUSD AutoCorrelation Function Monthly Average
The AutoCorrelation Function can be used as an indicator (AutoCorr.mq5), but as seen from Figure 7, it is not a good trend identification indicator.
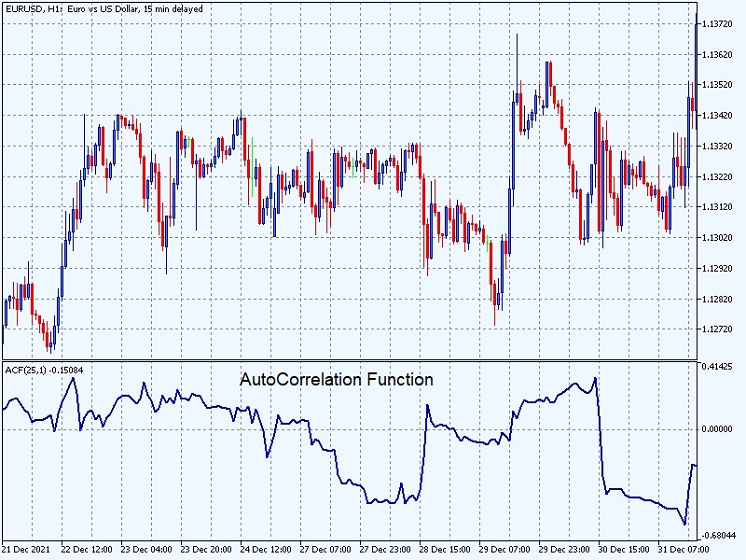
Figure 7. ACF Indicator, Lag=1
ACF Time Behavior and the SMA Crossover Strategy
More information can be found by looking at the time behavior of the ACF just prior to the SMA crossover point (Trigger ACF) and also, just after the crossover point, while the trade is still open (Trade ACF). The two types of ACFs, Trade ACF and Trigger ACF have distinct properties. Figures 8 and 9 show the Trade ACF for the EURUSD and GBPUSD data. Using the Strategy Tester, the ACF value can be plotted separately for profit trades and for loss trades as a function of time. Both charts show a time varying separation of the ACF between profit and loss trades. The profitable region 1/2008-6/2013 in Figure 1 (EURUSD) roughly matches a region in Figure 8 where the separation of the ACF is also large. Starting at 1/2018, there is little separation between ACF values for profit and loss trades. In Figure 1, this corresponds to a flat region in profit returns.
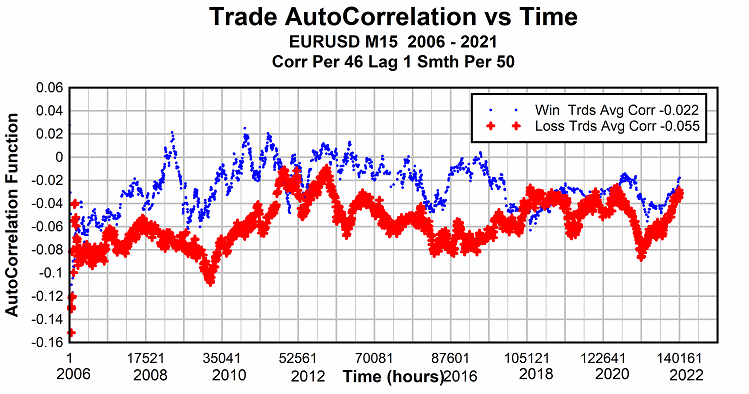
Figure 8. Trade AutoCorrelation for EURUSD for SMA Cross Triggers
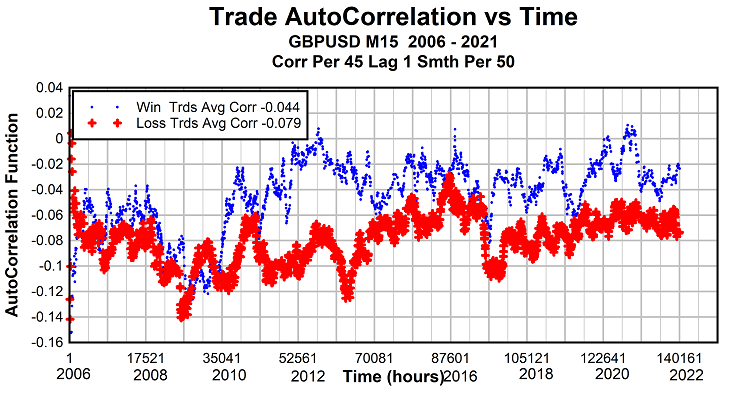
Figure 9. Trade AutoCorrelation for GBPUSD for SMA Cross Triggers
Figures 10 and 11 show the Trigger ACF for the EURUSD and GBPUSD data. The purpose of these two charts is to investigate whether the Trigger ACF value can be used as a filter in an expert advisor to improve the profitability of the SMA Crossover strategy. Compared to the Trade ACF data, the trigger ACF data shows less separation between positive and negative profit returns. This weakens its value as a trigger filter. However, the ACF value is largely flat in time indicating that a fixed threshold for the ACF could be used as a trigger filter. The profit/loss curves are largely bouncing across each other which means there are regions in time that trades would not be profitable. 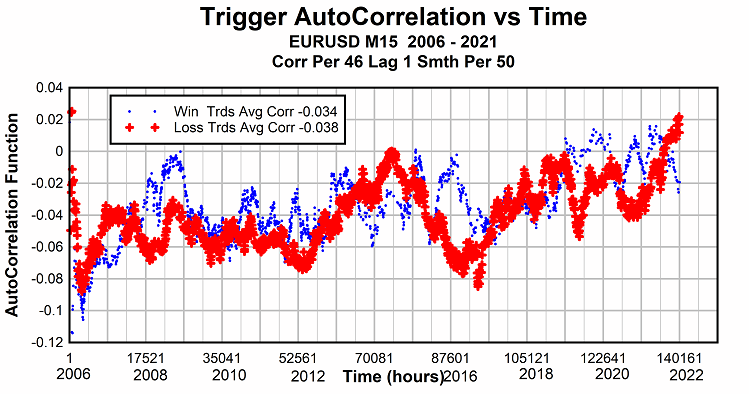
Figure 10. Trigger AutoCorrelation for EURUSD for SMA Cross Triggers
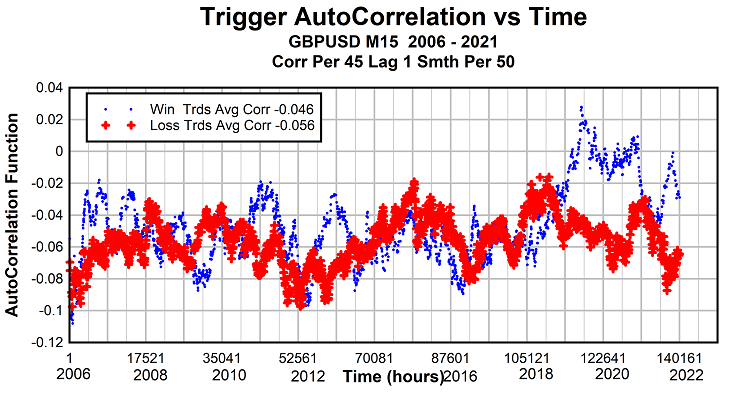
Figure 11. Trigger AutoCorrelation for GBPUSD for SMA Cross Triggers
ACF Filter for the SMA Crossover Trigger
Despite the small ACF differences between trades with positive and negtive returns (Figures 10 and 11), if an autocorrelation threshold requirement is added to the SMA Crossover trigger, the return performance of the expert advisor is much improved in regions of poor profit performance. Figures 12 and 13 show the profit return of the EA with an additional ACF filter for EURUSD and GBPUSD data. The full sixteen year duration is used. Comparing figures 1 and 2 with figures 12 and 13, the return performance for both the EURUSD and GBPUSD data is greatly improved when a autocorrelation threshold requirement is applied.

Figure 12. EURUSD Crossover Trigger With ACF Filter

Figure 13. GBPUSD Crossover Trigger With ACF Filter
Figure 14 shows a table of performance results from the Strategy Tester. A significant improvement is seen for both EURUSD and GBPUSD data. In both cases, the total profit increases by approximately 50% when the ACF filter is enabled and the profit per trade (PO) is also greatly improved.
| Trigger Type | # Trades | Profit $ (0.1 Lot) | Profit/Loss (PF) | Prof/Trade (PO) |
| EURUSD SMA Cross | 3160 | 5830. | 1.10 | 1.85 |
| EURUSD SMA Cross + ACF | 1548 | 8511. | 1.33 | 5.50 |
| GBPUSD SMA Cross | 3672 | 5352. | 1.07 | 1.46 |
| GBPUSD SMA Cross + ACF | 3096 | 8317. | 1.13 | 2.69 |
Figure 14. Test Performance Table for EURUSD and GBPUSD Data
Dependence of ACF on SMA Slow Period for SMA Crossover Strategy
It is also of interest to examine the dependence of the average autocorrelation function on choice of SMA slow period for winning and losing trades. This is shown for EURUSD M15 data in Figure 15. No correlation threshold is used as part of the trade opening strategy. Without regard to the ACF value, the optimal slow period for the SMA Crossover strategy was determined to be 80. Figure 15 shows that the largest separation of average ACF value, between winning and losing trades, occurs for SMA slow periods between 65 and 80. Further analysis may lead to using the ACF information to determine the optimal slow period based on measured autocorrelation value at the time of trade opening.
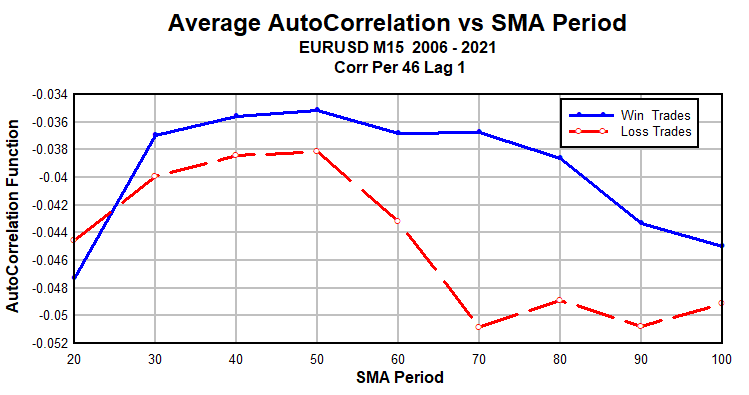
Figure 15. Average ACF versus SMA Slow Period for EURUSD
Conclusion
The autocorrelation function is a valuable indicator for improving expert advisor performance. It improves the performance of the test-bed trigger by filtering out regions where performance is poor.
In general, correlation coefficients, including the autocorrelation function, provide a fruitful area of research for improving trading efficiency. They are immune to volatility effects and are sensitive to price patterns including trend formation and reversal.
Warning: All rights to these materials are reserved by MetaQuotes Ltd. Copying or reprinting of these materials in whole or in part is prohibited.
This article was written by a user of the site and reflects their personal views. MetaQuotes Ltd is not responsible for the accuracy of the information presented, nor for any consequences resulting from the use of the solutions, strategies or recommendations described.
 Learn how to design a trading system by Bollinger Bands
 Developing a trading Expert Advisor from scratch
- Free trading apps
- Over 8,000 signals for copying
- Economic news for exploring financial markets
You agree to website policy and terms of use
Traders and programmers follow a parallel course. An attempt to cross from either side is the reason for failure.
If there were a forum here only for professionals of both sides, we could discuss it in detail. But here it is far from that. So I will decipher briefly. Passion for one thing harms another and vice versa. This is a natural process...
For example, can we say that we may not show the same performance in pairs such as other major parities, USDJPY, USDCHF, AUDUSD etc.?
Best.
Cenk
My experience with autocorrelation functions is that they work well with most currency pairs.