Articles with examples of indicators developed in MQL5
The articles contain detailed explanation of the attached codes. Download and open them in MetaEditor and program together with the author while reading the article.
Add a new article

You are missing trading opportunities:
- Free trading apps
- Over 8,000 signals for copying
- Economic news for exploring financial markets
Registration
Log in
You agree to website policy and terms of use
If you do not have an account, please register

Benefiting from Forex market seasonality
We are all familiar with the concept of seasonality, for example, we are all accustomed to rising prices for fresh vegetables in winter or rising fuel prices during severe frosts, but few people know that similar patterns exist in the Forex market.

Introduction to MQL5 (Part 4): Mastering Structures, Classes, and Time Functions
Unlock the secrets of MQL5 programming in our latest article! Delve into the essentials of structures, classes, and time functions, empowering your coding journey. Whether you're a beginner or an experienced developer, our guide simplifies complex concepts, providing valuable insights for mastering MQL5. Elevate your programming skills and stay ahead in the world of algorithmic trading!

Implementing the Generalized Hurst Exponent and the Variance Ratio test in MQL5
In this article, we investigate how the Generalized Hurst Exponent and the Variance Ratio test can be utilized to analyze the behaviour of price series in MQL5.

Ready-made templates for including indicators to Expert Advisors (Part 3): Trend indicators
In this reference article, we will look at standard indicators from the Trend Indicators category. We will create ready-to-use templates for indicator use in EAs - declaring and setting parameters, indicator initialization and deinitialization, as well as receiving data and signals from indicator buffers in EAs.

Ready-made templates for including indicators to Expert Advisors (Part 2): Volume and Bill Williams indicators
In this article, we will look at standard indicators of the Volume and Bill Williams' indicators category. We will create ready-to-use templates for indicator use in EAs - declaring and setting parameters, indicator initialization and deinitialization, as well as receiving data and signals from indicator buffers in EAs.

Introduction to MQL5 (Part 3): Mastering the Core Elements of MQL5
Explore the fundamentals of MQL5 programming in this beginner-friendly article, where we demystify arrays, custom functions, preprocessors, and event handling, all explained with clarity making every line of code accessible. Join us in unlocking the power of MQL5 with a unique approach that ensures understanding at every step. This article sets the foundation for mastering MQL5, emphasizing the explanation of each line of code, and providing a distinct and enriching learning experience.

ALGLIB numerical analysis library in MQL5
The article takes a quick look at the ALGLIB 3.19 numerical analysis library, its applications and new algorithms that can improve the efficiency of financial data analysis.
Making a dashboard to display data in indicators and EAs
In this article, we will create a dashboard class to be used in indicators and EAs. This is an introductory article in a small series of articles with templates for including and using standard indicators in Expert Advisors. I will start by creating a panel similar to the MetaTrader 5 data window.

Introduction to MQL5 (Part 1): A Beginner's Guide into Algorithmic Trading
Dive into the fascinating realm of algorithmic trading with our beginner-friendly guide to MQL5 programming. Discover the essentials of MQL5, the language powering MetaTrader 5, as we demystify the world of automated trading. From understanding the basics to taking your first steps in coding, this article is your key to unlocking the potential of algorithmic trading even without a programming background. Join us on a journey where simplicity meets sophistication in the exciting universe of MQL5.

Discrete Hartley transform
In this article, we will consider one of the methods of spectral analysis and signal processing - the discrete Hartley transform. It allows filtering signals, analyzing their spectrum and much more. The capabilities of DHT are no less than those of the discrete Fourier transform. However, unlike DFT, DHT uses only real numbers, which makes it more convenient for implementation in practice, and the results of its application are more visual.

Elastic net regression using coordinate descent in MQL5
In this article we explore the practical implementation of elastic net regression to minimize overfitting and at the same time automatically separate useful predictors from those that have little prognostic power.
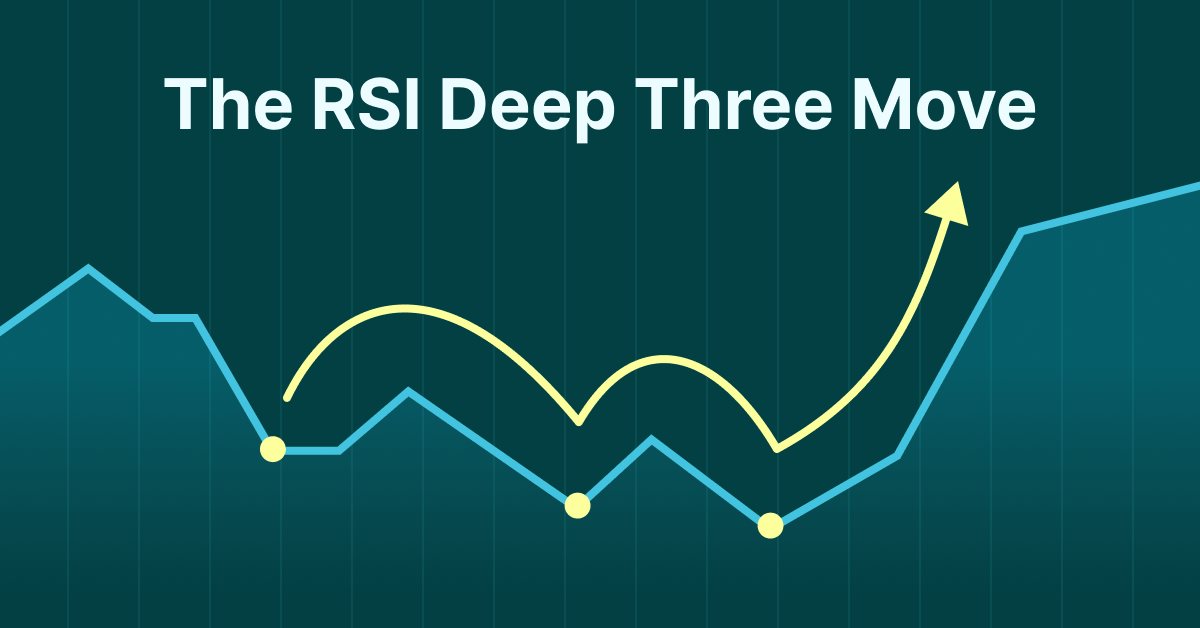
The RSI Deep Three Move Trading Technique
Presenting the RSI Deep Three Move Trading Technique in MetaTrader 5. This article is based on a new series of studies that showcase a few trading techniques based on the RSI, a technical analysis indicator used to measure the strength and momentum of a security, such as a stock, currency, or commodity.
How to create a custom indicator (Heiken Ashi) using MQL5
In this article, we will learn how to create a custom indicator using MQL5 based on our preferences, to be used in MetaTrader 5 to help us read charts or to be used in automated Expert Advisors.

Implementing the Janus factor in MQL5
Gary Anderson developed a method of market analysis based on a theory he dubbed the Janus Factor. The theory describes a set of indicators that can be used to reveal trends and assess market risk. In this article we will implement these tools in mql5.

Category Theory in MQL5 (Part 5): Equalizers
Category Theory is a diverse and expanding branch of Mathematics which is only recently getting some coverage in the MQL5 community. These series of articles look to explore and examine some of its concepts & axioms with the overall goal of establishing an open library that provides insight while also hopefully furthering the use of this remarkable field in Traders' strategy development.
Canvas based indicators: Filling channels with transparency
In this article I'll introduce a method for creating custom indicators whose drawings are made using the class CCanvas from standard library and see charts properties for coordinates conversion. I'll approach specially indicators which need to fill the area between two lines using transparency.

Creating a ticker tape panel: Improved version
How do you like the idea of reviving the basic version of our ticker tape panel? The first thing we will do is change the panel to be able to add an image, such as an asset logo or some other image, so that the user could quickly and easily identify the displayed symbol.
Creating a ticker tape panel: Basic version
Here I will show how to create screens with price tickers which are usually used to display quotes on the exchange. I will do it by only using MQL5, without using complex external programming.
Non-linear indicators
In this article, I will make an attempt to consider some ways of building non-linear indicators and their use in trading. There are quite a few indicators in the MetaTrader trading platform that use non-linear approaches.


Mountain or Iceberg charts
How do you like the idea of adding a new chart type to the MetaTrader 5 platform? Some people say it lacks a few things that other platforms offer. But the truth is, MetaTrader 5 is a very practical platform as it allows you to do things that can't be done (or at least can't be done easily) in many other platforms.

Developing a trading Expert Advisor from scratch (Part 31): Towards the future (IV)
We continue to remove separate parts from our EA. This is the last article within this series. And the last thing to be removed is the sound system. This can be a bit confusing if you haven't followed these article series.

Adaptive indicators
In this article, I will consider several possible approaches to creating adaptive indicators. Adaptive indicators are distinguished by the presence of feedback between the values of the input and output signals. This feedback allows the indicator to independently adjust to the optimal processing of financial time series values.

DIY technical indicator
In this article, I will consider the algorithms allowing you to create your own technical indicator. You will learn how to obtain pretty complex and interesting results with very simple initial assumptions.

CCI indicator. Upgrade and new features
In this article, I will consider the possibility of upgrading the CCI indicator. Besides, I will present a modification of the indicator.

Complex indicators made easy using objects
This article provides a method to create complex indicators while also avoiding the problems that arise when dealing with multiple plots, buffers and/or combining data from multiple sources.

Developing a trading Expert Advisor from scratch (Part 15): Accessing data on the web (I)
How to access online data via MetaTrader 5? There are a lot of websites and places on the web, featuring a huge amount information. What you need to know is where to look and how best to use this information.

Developing a trading Expert Advisor from scratch (Part 14): Adding Volume At Price (II)
Today we will add some more resources to our EA. This interesting article can provide some new ideas and methods of presenting information. At the same time, it can assist in fixing minor flaws in your projects.
Indicators with on-chart interactive controls
The article offers a new perspective on indicator interfaces. I am going to focus on convenience. Having tried dozens of different trading strategies over the years, as well as having tested hundreds of different indicators, I have come to some conclusions I want to share with you in this article.

Developing a trading Expert Advisor from scratch (Part 13): Time and Trade (II)
Today we will construct the second part of the Times & Trade system for market analysis. In the previous article "Times & Trade (I)" we discussed an alternative chart organization system, which would allow having an indicator for the quickest possible interpretation of deals executed in the market.

Developing a trading Expert Advisor from scratch (Part 12): Times and Trade (I)
Today we will create Times & Trade with fast interpretation to read the order flow. It is the first part in which we will build the system. In the next article, we will complete the system with the missing information. To implement this new functionality, we will need to add several new things to the code of our Expert Advisor.

Developing a trading Expert Advisor from scratch (Part 10): Accessing custom indicators
How to access custom indicators directly in an Expert Advisor? A trading EA can be truly useful only if it can use custom indicators; otherwise, it is just a set of codes and instructions.

Developing a trading Expert Advisor from scratch (Part 9): A conceptual leap (II)
In this article, we will place Chart Trade in a floating window. In the previous part, we created a basic system which enables the use of templates within a floating window.

Multiple indicators on one chart (Part 03): Developing definitions for users
Today we will update the functionality of the indicator system for the first time. In the previous article within the "Multiple indicators on one chart" we considered the basic code which allows using more than one indicator in a chart subwindow. But what was presented was just the starting base of a much larger system.
Multiple indicators on one chart (Part 02): First experiments
In the previous article "Multiple indicators on one chart" I presented the concept and the basics of how to use multiple indicators on one chart. In this article, I will provide the source code and will explain it in detail.
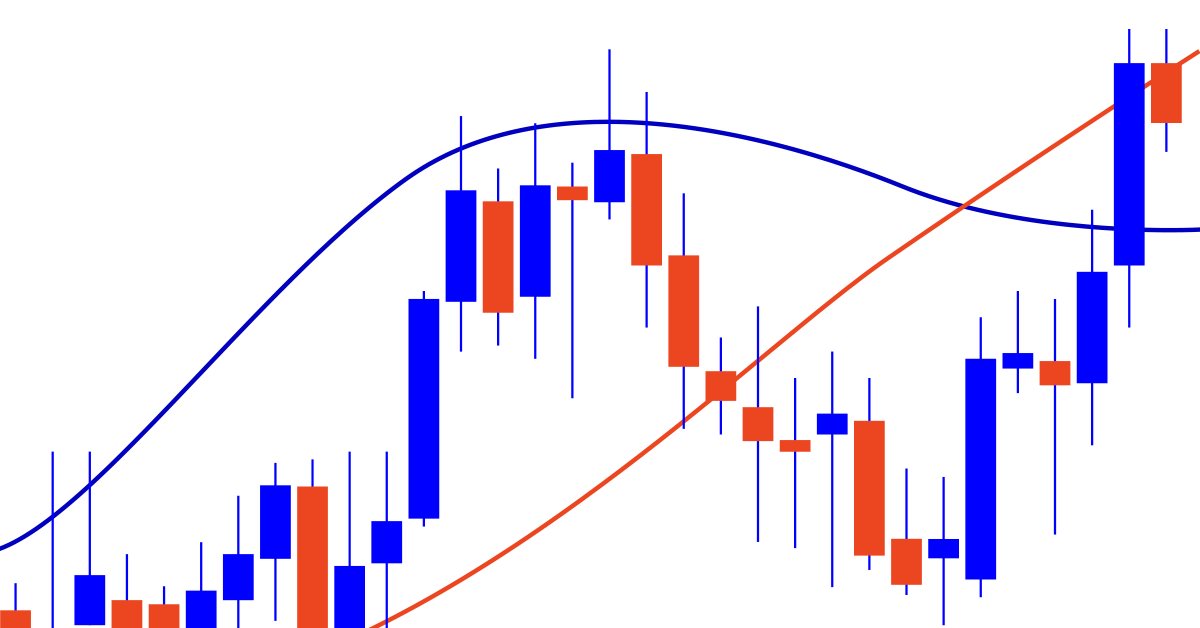
What you can do with Moving Averages
The article considers several methods of applying the Moving Average indicator. Each method involving a curve analysis is accompanied by indicators visualizing the idea. In most cases, the ideas shown here belong to their respected authors. My sole task was to bring them together to let you see the main approaches and, hopefully, make more reasonable trading decisions. MQL5 proficiency level — basic.
Multiple indicators on one chart (Part 01): Understanding the concepts
Today we will learn how to add multiple indicators running simultaneously on one chart, but without occupying a separate area on it. Many traders feel more confident if they monitor multiple indicators at a time (for example, RSI, STOCASTIC, MACD, ADX and some others), or in some cases even at different assets which an index is made of.

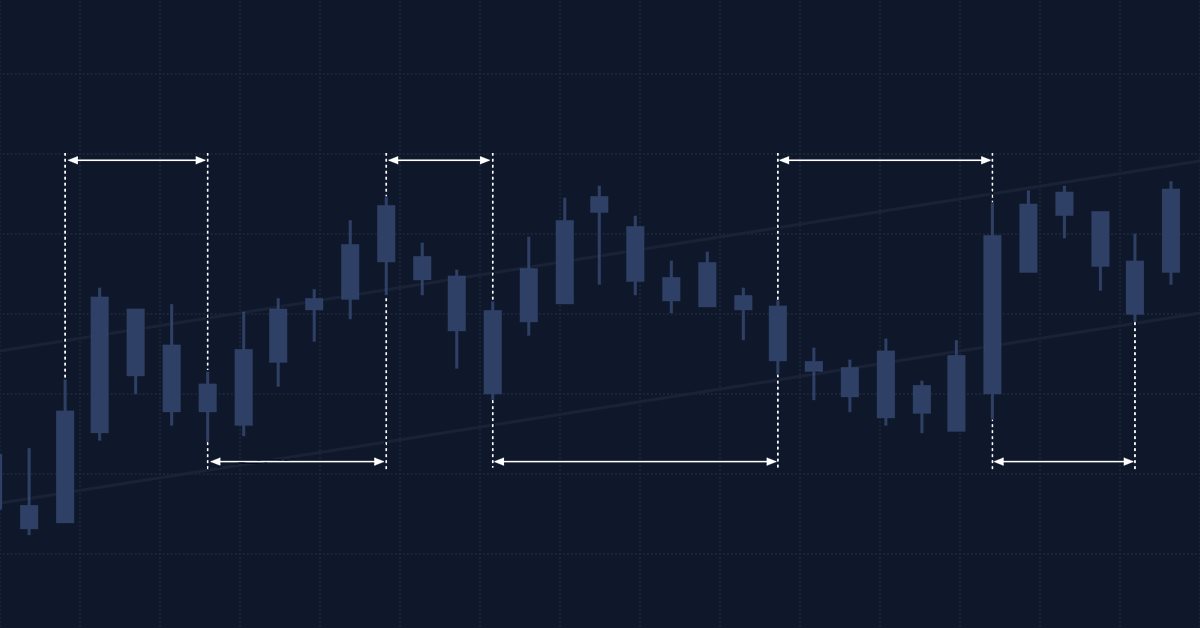
An Analysis of Why Expert Advisors Fail
This article presents an analysis of currency data to better understand why expert advisors can have good performance in some regions of time and poor performance in other regions of time.

Manual charting and trading toolkit (Part III). Optimization and new tools
In this article, we will further develop the idea of drawing graphical objects on charts using keyboard shortcuts. New tools have been added to the library, including a straight line plotted through arbitrary vertices, and a set of rectangles that enable the evaluation of the reversal time and level. Also, the article shows the possibility to optimize code for improved performance. The implementation example has been rewritten, allowing the use of Shortcuts alongside other trading programs. Required code knowledge level: slightly higher than a beginner.

Exploring options for creating multicolored candlesticks
In this article I will address the possibilities of creating customized indicators with candlesticks, pointing out their advantages and disadvantages.

Bid/Ask spread analysis in MetaTrader 5
An indicator to report your brokers Bid/Ask spread levels. Now we can use MT5s tick data to analyze what the historic true average Bid/Ask spread actually have recently been. You shouldn't need to look at the current spread because that is available if you show both bid and ask price lines.