MQL5 Wizard Techniques you should know (Part 72): Using Patterns of MACD and the OBV with Supervised Learning
Introduction
In our last article, where we introduced the indicator pair of the MACD and On-Balance-Volume oscillator (OBV) we examined 10 possible signals that could be generated from the complimentary pairing of these indicators. We always test 10 signal patterns as derived from a 2-indicator-pairing by performing a forward walk test for 1-year, having done training or optimization over the previous year. With the last article, only one signal pattern, pattern-7, was able to forward walk profitably. We went over some of the reasons why this indicator pairing performed dismally when compared to other indicators we have covered, however this also presented an ‘opportunity’ for us to explore machine learning in enhancing some of these signal patterns.
We therefore follow up that article by examining how, if at all, a CNN network that uses the rational quadratic kernel, could help and perhaps improve indicator signal interpretation and application. The Rational Quadratic (RQ) kernel is defined by the following formula:

Where:
- k(x,x′) is the kernel similarity value between two inputs x and x′. It ranges between 0 and 1, with values closer to 1 indicating higher similarity.
- x and x′ are two input vectors (e.g., slices of a 1D signal, feature vectors, or positions in time). They can be scalar values (of dim=1) or vectors with multiple dimensions.
- ∥x−x′∥2 is the squared Euclidean distance between the two input vectors. It measures how far apart x and x′ are in a feature space. This distance can be got from this formula:
-

- l is the length scale (or characteristic scale) of the kernel. It determines how quickly similarity decays with distance:
- Small l: sharp decay (local sensitivity).
- Large l: slow decay (broad similarity).
- α or alpha is the scale-mixture parameter (sometimes called shape parameter). It controls the weighting of large vs. small scales of variation:
- As α → infinity, the kernel becomes equivalent to the Squared Exponential (RBF) kernel.
- A Small α means the kernel has heavier tails, allowing for longer-range interactions.
In our implementation of the Rational Quadratic Kernel (RQK) in a CNN, we are using it to set the sizes of the kernels and channels of the CNN. There are however alternative uses and applications of this kernel within a CNN that can be considered by the reader.
Alternate RQ-Kernel applications and benefits
First up among these is adaptive attention masking. In this use-case, the RQ-Kernel builds spatial or temporal attention masks within the CNN. This helps with segmentation or time-series forecasting. It works by emphasizing regions with high similarity to a reference, such as a centroid window. Another possible use of the RQ-kernel could be in distance aware pooling. In this scenario, only network activations within a set similarity threshold under the RQ-Kernel are pooled instead of averaging everything. This allows distance-aware, adaptive pooling that respects feature closeness.
Another application can be in feature importance scaling. Here weighting would be applied to the CNN channels, in a learned smooth manner. Finally, the RQ-Kernel could be used to reduce or ‘prune’ weights of the CNN whose effect as measured by the kernel is minimal within the network’s input space. The reasons why this kernel can and should be applied within CNNs are also multi-faceted. Below, we present a table that tries to summarise this.
| Robust to outliers | The long tails of RQ-kernels make the architecture less susceptible to spatial or temporal anomalies. |
| Smooth transitions | Smooth decay of the kernel provides less abrupt representation shifts between layers. This is good for gradient flow. |
| Dynamic architecture | The kernel uses data-aware selection of CNN-kernel sizes or channel expansion by using similarity measures. |
This CNN (conv-1d) design that uses the RQ-kernel is ideal with 1-dim sized inputs where localized similarity is important, such as the financial time series we are looking at in this article. Other possible suitable data types include audio signals, and binary pattern detection. When using this CNN, it is important to have the input vectors normalized or standardized to the 0–1 range, as we have been doing with our networks in past articles. The shape of the input is typically (batch_size, input_length) with the input vectors filled with 0s or 1s.
The RQ-Kernel has a number of important hyperparameters, as noted in its formula above. First among these is alpha that as mentioned in the formula notes regulates the tail decay. With higher values, the kernel acts more like a monolith radial basis function kernel. However, as this value is reduced, then the RQ-Kernel acts as a combination of multiple RBFs at different scales as managed by alpha. Another hyperparameter is the length-scale, which determines sensitivity of similarity to distance.
If our network is a classifier with a probability distribution output, then the BCE loss-function can be used in training. Proper initialization and learning rate scheduling can also be important here given our unconventional architecture. Further extensions can also be made by adding residual connections between layers for better gradient propagation. In addition, integrating the RQ-Kernel can be done as a gating mechanism. Similarity based drop-outs can also be used between the layer stacks.
Research does point to RQ-Kernels defining Conv1D weights and thus grabbing particular data patterns. This application of the kernel clearly reduces the total parameter requirement and also enhances interpretability, however it could limit adaptability when in comparison to learned kernels. Evidence for better results also leans towards using this kernel in Gaussian Process layers and hyperparameter optimization in broader CNN design, such as covered in this piece on Deep Gaussian processes with convolutional kernels.
Using kernels of definitive size does reduce learnable parameters and mitigates overfitting, particularly in cases where data is limited. This was illustrated in a cassava disease classification as covered here. However, even though interpretability from using pre-set kernels helps provide insight into the extraction of features, a marked contrast with black-box learned kernels; there are a few concerns with adaptability. Kernels that are fixed tend to not adapt as well to data like learned kernels, and this can potentially lead to under performance in complex tasks. This is suggested in the above linked cassava study, where hybrid kernels outperformed single RQ-Kernels. Part of the study results are presented below:
| Kernel Type | Accuracy |
|---|---|
| RQ-Kernel | 88.5% |
| Squared Exponential Kernel | 88.0% |
| Hybrid Kernel | 90.1% |
Our table above from the cassava disease study shows the slight performance trade-offs in learned vs fixed kernels. A hybrid approach is recommended. In earlier times, the RQ-Kernel served an ambiguous role. However, as shared in some links above, this study and this study, and this one, helped reveal its application in Deep-Gaussian-Process especially for image data and adaptation to Conv1D. The cassava disease study informed the decision to dwell on predefined weights as a means of balancing between fixed and learned approaches.
In designing the used networks, the kernel size was taken in relation to the hyperparameter length-scale l. With multiple channels capturing different scales, which aligns with CNN practices of varying receptive fields, the final implementation used global average pooling for flexibility. This ensured output independence from any sequence length and was also well suited for the scalar, 0-1, range bound output.
The Network
Our network implementation is in Python because, as we have argued in past articles, coding and training it in Python is more efficient than performing the same tasks in MQL5. We implement a CNN in Python that scales its kernels and channels with the RQ-Kernel as follows:
import torch
import torch.nn as nn
import torch.nn.functional as F

import pandas as pd
import numpy as np

class RationalQuadraticConv1D(nn.Module):
    def __init__(self, alpha=1.0, length_scale=1.0, input_length=100):
        super(RationalQuadraticConv1D, self).__init__()
        self.alpha = alpha
        self.length_scale = length_scale
        self.input_length = input_length

        # Deeper and wider design
        self.kernel_sizes, self.channels = self._design_architecture()

        self.conv_layers = nn.ModuleList()
        in_channels = 1

        for i, (out_channels, kernel_size) in enumerate(zip(self.channels, self.kernel_sizes)):
            layer = nn.Sequential(
                nn.Conv1d(in_channels, out_channels, kernel_size=kernel_size, padding=kernel_size // 2),
                nn.BatchNorm1d(out_channels),
                nn.ReLU(),
                nn.Dropout(0.2)
            )
            self.conv_layers.append(layer)
            in_channels = out_channels

        # Fully connected head to increase parameter count
        self.head = nn.Sequential(
            nn.AdaptiveAvgPool1d(1),
            nn.Flatten(),
            nn.Linear(in_channels, 128),
            nn.ReLU(),
            nn.Dropout(0.2),
            nn.Linear(128, 64),
            nn.ReLU(),
            nn.Linear(64, 1),
            nn.Sigmoid()
        )

    def _rq_kernel(self, x, x_prime):
        dist_sq = (x - x_prime) ** 2
        return (1 + dist_sq / (2 * self.alpha * self.length_scale ** 2)) ** -self.alpha

    def _design_architecture(self):
        x = torch.linspace(0, 1, self.input_length)
        center = 0.5
        responses = self._rq_kernel(x, center)
        thresholded = responses[responses > 0.01]  # allow more spread

        num_layers = 10
        kernel_sizes = [3 + (i % 4) * 2 for i in range(num_layers)]  # cyclic 3, 5, 7, 9
        channels = [32 * (i + 1) for i in range(num_layers)]  # 32, 64, ..., 320

        return kernel_sizes, channels

    def forward(self, x):
        x = x.unsqueeze(1)  # (B, 1, L)
        for layer in self.conv_layers:
            x = layer(x)
        return self.head(x)
We start off by defining a custom PyTorch module that has, as inputs, some of the key parameters we have highlighted above in the RQ-Kernel formula. Our class that we are labelling ‘RationalQuadraticConv1D’ inherits from the ‘nn.Module’, which is, as we have seen in our past articles, the base class for all PyTorch neural network modules. The constructor does initialize three important RQ-Kernel parameters; alpha, length-scale, and input-length. Alpha as mentioned above controls the shape of the kernel, the length-scale determines the distance over which the kernel decays, and the input-length is meant to capture the expected size/ length of the input vector.
These first steps are important as they establish the model’s foundation and allowing customization of the kernel’s behaviour. This also ensures the architecture does match the input vector dimensions. Tuning alpha and the length-scale should be performed to adjust the kernel’s sensitivity to differences in inputs. For instance, a smaller length-scale would focus on local patterns, while a larger value would capture broader similarities. As always, the input-length should be checked to match the size of input data.
After initialization, we dynamically assign the kernel sizes and number of channels for the convolutional layers. This code line calls the ‘_design_architecture’ method (covered later) to calculate the kernel sizes and channels while basing on the RQ-Kernel’s similarity profile across the input space. This is our gist for the network because unlike traditional CNNs with fixed architectures, this approach adapts the model structure to the data’s characteristics. This potentially can improve feature extraction efficiency and effectiveness. Our adaptability approach here makes this model suitable for datasets with varying similarity structures. Monitoring of the output from the method ‘_design_architecture’ is important to ensure the architecture aligns with the task's complexity.
After this, in our subsequent code lines, we build a flexible stack of convolutional layers with dynamic properties. The ‘nn.ModuleList()’ function does create a container for a variable number of convolutional layers. The loop iterates over pairs of ‘out-channels’ i.e. the number of output channels, with the ‘kernel-size’ which in this case refers to the size of the convolutional kernel; as read from ‘self.channels’ and ‘self.kernel-size’ respectively. Every ‘nn.Conv1D’ layer takes ‘in-channels’ starting at 1 for the first layer. It outputs to ‘out-channels’ and uses ‘kernel-size’ with padding to establish the next size of kernel in order to preserve the input length. The ‘in-channels’ then gets updated to ‘out-channels’ for the next layer, thus forming a chain.
This is important as the dynamic construction does allow the model to have a tailored number of layers and parameters. In tandem with this, the padding will ensure that the output length matches the input length, a critical underpinning when dealing with sequential data. Larger ‘kernel-size’ values tend to capture broader patterns of the input data, while higher numbers of ‘out-channels’ increase the diversity in features captured from the data. Adjustments to padding can be made if full length preservation is not important, such as 0 when downsampling.
We then proceed to define the ‘final’ network, which processes convolutional outputs into a single probability-like value. It defines a sequence of operations that encompass ‘nn.AdaptiveAvgPool1D’; ‘nn.Flatten’; ‘nn.Linear’; and ‘nn.Sigmoid’. These are responsible for: reducing spatial dimension to 1 by averaging across the sequence; converting the tensor into a 1D vector; mapping flattened features to a single output; and outputting a value between 0 and 1 which is suited for binary classification or regression, respectively.
This final step brings together features and produces a task-specific output. This makes the model usable for purposes like binary classification or probability estimation. In case of multi-class tasks, replacing of the linear and sigmoid layers can be done with `nn.Linear(in_channels, num_classes)’ and `nn.Softmax()’ respectively. Regression would necessitate removal of Sigmoid, as it better serves classification.
Within our class, we have a function that computes similarity between data points or vectors. This is the ‘_rq_kernel’ function. This similarity is calculated, as one would expect, with the RQ-kernel. The calculations capture the Euclidean distance between x and x-prime. The RQ-Kernel formula that we have shared above is used, and it decreases as the distance increases under the moderation of alpha and length-scale hyperparameters. The RQ-Kernel quantifies similarity across the input data, which acts as the basis for designing the CNN architecture.
It is flexible in that it can capture both local and global patterns. A larger alpha approximates a Gaussian kernel, while a smaller while a smaller alpha affords more flexibility. Adjusting length-scale to control decay is also important, with smaller values emphasizing local similarities.
This leads us to the ‘_design_architecture’ function that we introduced in the notes above. It designs or establishes the CNN architecture dynamically by using the RQ-Kernel’s decay profile. First up in this function is the creation of a normalized range of input positions. This is the ‘x’. Then we set the reference point for similarity calculations, which we define as ‘center’. Following this, we compute, ‘responses’, the RQ-Kernel response for every position relative to the center. Next, we filter positions for kernel responses that exceed 0.2, while at the same time focusing on significant regions.
With this done, we then scale the kernel sizes basing on position and starting at 3. We increase this with the distance from the ‘center’. We penultimately assign more channels to regions with lower similarity, starting at 4. Finally, we return architecture settings that limit the design to three layers.
This function tailors the CNN to the data’s similarity structure. Using larger kernels is good for broader patterns, and more channels allow more complex feature extraction. The threshold of 0.2 and scaling factors of 4 for kernels and 60 for channels are tuneable. The number of layers, for tasks that demand deeper feature extraction, can be done, however this should be balanced with computational cost.
Finally, the forward pass method concludes our ‘ RationalQuadraticConv1D’ class. It executes the model’s computation from input to output. It starts by adding a channel dimension to the input in order to make it compatible with ‘nn.Conv1D’. We then apply each convolutional layer followed by a ReLU activation to introduce non-linearity. We then pass the result through the final layers to get the final output. Our forward pass function defines the model’s data flow by leveraging dynamically designed architecture to get features used in forecasting.
It is key to ensure that the input shape is in the format (batch_size, input_length) and that the used activation type is suitable to the task at hand. Shape mismatches can be common with this network, that's why it is key to debug by printing input data shape at each step. We can now look at how we set the network inputs by considering the indicator implementations in Python for the MACD and OBV.
The MACD
Our indicators are coded from the basics in Python, even though there are libraries and modules that can address some of them. This is for smoother/ less memory-intense compilation and execution. The MACD computes the MACD line, signal line and histogram; all of which help analyse the asset's price. We implement it in Python as follows:
def MACD(df, fast_period: int = 12, slow_period: int = 26, signal_period: int = 9) -> pd.DataFrame:
    """
    Calculate Moving Average Convergence Divergence (MACD) and append it to the input DataFrame.

    The MACD line is the difference between a fast and slow EMA.
    The Signal line is an EMA of the MACD line.
    The Histogram is the difference between the MACD and Signal lines.

    Args:
        df (pd.DataFrame): DataFrame with a 'close' column.
        fast_period (int): Lookback period for the fast EMA. Default is 12.
        slow_period (int): Lookback period for the slow EMA. Default is 26.
        signal_period (int): Lookback period for the Signal line EMA. Default is 9.

    Returns:
        pd.DataFrame: Input DataFrame with new 'MACD', 'Signal_Line', and 'MACD_Histogram' columns.
    """
    # Input validation
    if 'close' not in df.columns:
        raise ValueError("DataFrame must contain a 'close' column")
    if not all(p > 0 for p in [fast_period, slow_period, signal_period]):
        raise ValueError("All period values must be positive integers")
    if fast_period >= slow_period:
        raise ValueError("fast_period must be less than slow_period")

    # Create a copy to avoid modifying the original DataFrame
    result_df = df.copy()

    # Calculate Fast and Slow Exponential Moving Averages (EMA)
    ema_fast = result_df['close'].ewm(span=fast_period, adjust=False).mean()
    ema_slow = result_df['close'].ewm(span=slow_period, adjust=False).mean()

    # Calculate MACD line
    result_df['MACD'] = ema_fast - ema_slow

    # Calculate Signal line (EMA of MACD)
    result_df['Signal_Line'] = result_df['MACD'].ewm(span=signal_period, adjust=False).mean()

    # Calculate MACD Histogram
    result_df['MACD_Histogram'] = result_df['MACD'] - result_df['Signal_Line']

    return result_df
Our function format follows what we have been using of taking a pandas data frame with a close price column and three optional integer parameters of: fast-period default assigned 12; slow-period default assigned 26; and the signal period, which is assigned 9. Use of a data frame in the inputs, as we have been doing, follows importing of price data with the MT5 Python module. Our function returns a copy of the input data frame with added columns for values of MACD, MACD line, and the Signal line.
The opening lines of code check that our input data frame has a close price column, which provides the closing prices needed for the EMA calculations. In addition, we validate that all period parameters are positive integers as they point to look back periods. In addition, validation checks the fast period to ensure it is less than the slow period, ensuring the MACD reflects differences between short term and long term trends. This validation step averts runtime errors and sees to it, we maintain logical consistency. It is always important to avoid misinterpretations that could result in unsavoury trading decisions.
We then create a copy of the input data frame that serves to store our outputs while preserving the original data. This practice does preserve integrity of input frame that could be used across multiple functions, whose analyses do not need to be corrupted. In Python, it ensures modularity and reusability. With a copy of the input frame created, we proceed to use the pandas exponential weighted moving average function to compute EMA of the close prices over the fast and slow periods. In doing so, we assign the parameter adjust to False and this ensures the standard EMA formula is used and ‘span’ sets the window size. The choice of ‘span’ directly influences sensitivity, with smaller values making EMA more responsive while larger values smooth out noise.
Once we finish computing the fast and slow EMAs, we assign our first new pandas' series to the output data frame, that we’re aptly labelling ‘MACD’. This in essence computes the MACD line as the difference between the fast and slow EMAs. The MACD line is the core indicator that shows convergence or divergence of long-term and short-term price movements. To recap, a positive value marks bullish trend, while a negative one indicates bearish trend. Monitoring MACD line’s direction and magnitude can serve as a check on the trend strength. Crossovers can signal trend changes.
Next, we calculate the signal line pandas series for our output data frame. This is a computation of the signal-line as an EMA of the MACD line over the ‘signal-period’. It smoothes the MACD and signal lines to provide a reference for trading signals. Crossovers between MACD and signal lines are also crucial decision points. With default period of 9, this buffer balances responsiveness and smoothing but could still be fine-tuned depending on the traded asset’s conditions.
The final pandas series that we append to the output data frame is the MACD histogram. This computes the difference between the MACD buffer and the signal line buffer. This calculation helps visualize momentum strength, with positive values being bullish while negative ones are bearish. Also, sign changes in the histogram can point to reversals. With these three pandas’ series appended to the output data frame, our function’s work is complete and it simply returns this data frame.
The OBV
This function calculates the On-Balance-Volume, a volume indicator that draws analogy between price changes and volume. We implement it in Python as follows:
def OBV(df) -> pd.DataFrame:
    """
    Calculate On-Balance Volume (OBV) and append it as an 'OBV' column
    to the input DataFrame.

    OBV is a momentum indicator that uses volume flow to predict changes in stock price.

    Args:
        df (pd.DataFrame): DataFrame with 'close' and 'volume' columns.

    Returns:
        pd.DataFrame: Input DataFrame with a new 'OBV' column.
    """
    # Input validation
    if not all(col in df.columns for col in ['close', 'tick_volume']):
        raise ValueError("DataFrame must contain 'close' and 'volume' columns")

    # Create a copy to avoid modifying the original DataFrame
    result_df = df.copy()
    # print(result_df.columns)

    # Calculate the direction of price change
    # np.sign returns 1 for positive, -1 for negative, and 0 for zero change
    direction = np.sign(result_df['close'].diff())

    # Calculate the OBV
    # Multiply the volume by the direction of price movement
    # Then calculate the cumulative sum
    obv = (result_df['tick_volume'] * direction).cumsum()

    # The first value of diff() is NaN, so the first OBV will be NaN.
    # We can fill it with the first day's volume or 0. A common practice is to start at 0.
    result_df['OBV'] = obv.fillna(0)

    return result_df
Our source code above starts by validating the data frame to ensure it has the requisite columns of the ‘close’ price and the volume of ‘tick-volume’. We are relying on tick volume since this is bound to be more readily available across most asset classes, unlike real volume that is hard to come by for forex pairs given their decentralized nature. Once this validation is complete, we create a copy of the input data frame, since we intend to append the input and it may be prudent to preserve the integrity of the input as already argued above with the MACD function.
With this, we proceed to calculate the ‘direction’ of close price changes. These calculations are performed over consecutive periods. The np.sign function is used to mark either -1, or +1 or 0; for price decreases, price-increases, or no-price changes respectively. This step is important in establishing the direction of price movement, which does dictate how volume is accumulated in the OBV. This step also simplifies price-trend analysis by converting it into a binary format that allows easier integration with volume data.
With the direction vector defined, we proceed to compute the OBV, that is, a product between volume and this direction with a cumulative sum to track OBV over time. OBV accumulates volume-based price moves by adding up volume in bullish times and deducting it when bearish. The OBV value thus can reflect buying or selling pressure. The OBV trend is more important than its absolute value. Comparison of its sign and price direction can help with trend confirmation.
Our next line of code fills the NaN value in the first OBV entry that is a result of the diff() calculations, since this would prevent comparison. This line also adds this OBV value to a new OBV pandas series in our output pandas data frame. The choice of OBV in the particular case of this indicator is practical because 0 is a neutral value that represents no volume swing in either direction. It is not the same as assigning 0 to the buffer of Moving Average prices.
Previous Notes
A lot of the signal patterns in the last article that introduced this indicator pairing of the MACD and OBV did not forward walk profitably. It was only pattern 7 that walked forward, which is a huge under-performance considering typically we have at least 6 out of the usual 10 patterns tested being able to forward walk profitably. We thus select some of the very poor performers in that last article, and see if when we apply supervised learning, we can get better results. For this article, we are therefore choosing 3 patterns of the previous 9 laggards. These are pattern-2, pattern-3, and pattern-5.
Pattern-2
We implement pattern-2 in Python as follows;
def feature_2(macd_df, obv_df, price_df):
    """

    """
    feature = np.zeros((len(macd_df), 2))

    feature[:, 0] = ((price_df['low'] < price_df['low'].shift(1)) &
                     (macd_df['MACD_Histogram'] > macd_df['MACD_Histogram'].shift(1)) &
                     (obv_df['OBV'] > obv_df['OBV'].shift(1))).astype(int)

    feature[:, 1] = ((price_df['high'] > price_df['high'].shift(1)) &
                     (macd_df['MACD_Histogram'] < macd_df['MACD_Histogram'].shift(1)) &
                     (obv_df['OBV'] < obv_df['OBV'].shift(1))).astype(int)

    feature[0, :] = 0
    feature[1, :] = 0

    return feature
To recap, it relies on price-trend divergence where a lower low price and rising MACD imply a hidden bullish divergence while a higher high price that’s coupled with a falling MACD is also indicative of a hidden bearish divergence. This is combined with volume confirmation, where a rising OBV confirms accumulation which is a bullish signal whereas a declining OBV marks distribution which is a bearish indicator. In summary, this pattern aims to validate divergence, that are picked up from weakening momentum despite price extremes, with signals with volume flow.
This pattern thus serves to identify continuation patterns in trends. It is most reliable in established trends like bullish uptrends and bearish downtrends. It also often requires 2 bars of confirmation before it can be fully embarked on. We perform tests on a CNN network that engages the RQ-Kernel in defining its architecture while taking input signals from this pattern from the period 2023.01.01 to 2025.01.01 having performed training and optimizations over the period 2023.01.01 to 2024.01.01 on the pair GBP JPY on the 4-hour time frame. Our test report is as follows:


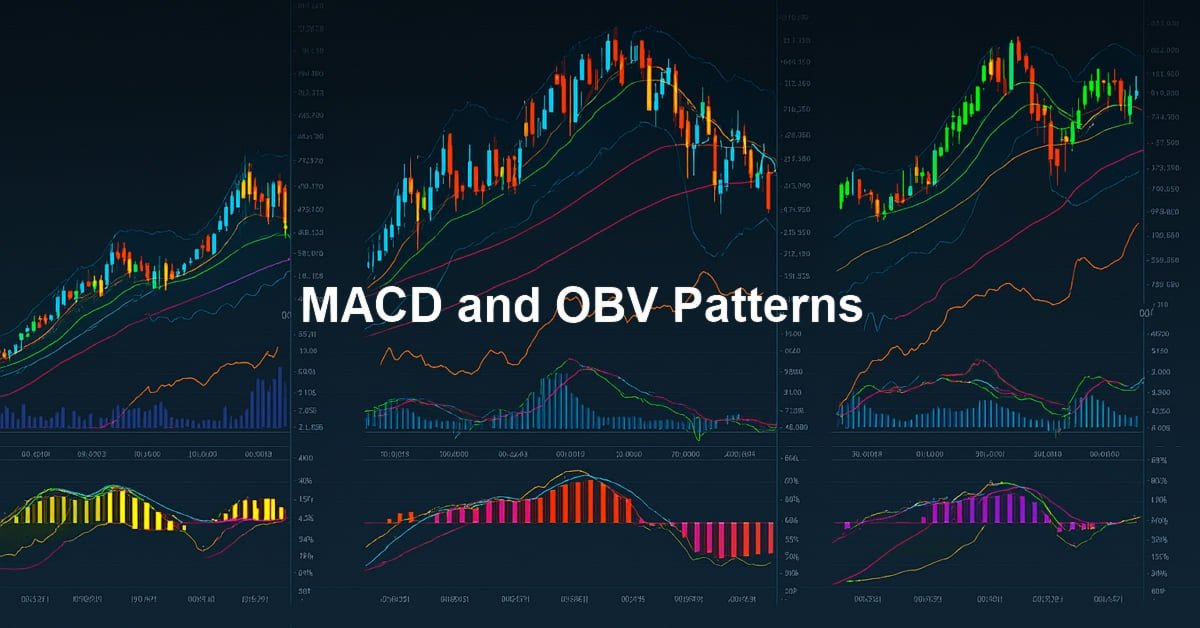
There is clearly some improvement from the results we had in the last article, therefore we can say our supervised learning model has made a difference. As always, extra diligence and independent testing is always expected on the part of the reader before any ideas presented here can be applied to live accounts. Even though these articles are targeted towards automated trading, it might be insightful to some in getting a sense of what the patters we describe actually look like on a chart. To that end, below is the bullish signal for this pattern, pattern-2.

Pattern-3
We implement this pattern in Python as follows:
def feature_3(macd_df, obv_df, price_df):
    """
    """
    feature = np.zeros((len(macd_df), 2))

    feature[:, 0] = ((macd_df['MACD_Histogram'] > macd_df['MACD_Histogram'].shift(1)) &
                     (macd_df['MACD_Histogram'].shift(1) < macd_df['MACD_Histogram'].shift(2)) &
                     (obv_df['OBV'] > obv_df['OBV'].shift(1))).astype(int)

    feature[:, 1] = ((macd_df['MACD_Histogram'] < macd_df['MACD_Histogram'].shift(1)) &
                     (macd_df['MACD_Histogram'].shift(1) > macd_df['MACD_Histogram'].shift(2)) &
                     (obv_df['OBV'] < obv_df['OBV'].shift(1))).astype(int)

    feature[0, :] = 0
    feature[1, :] = 0

    return feature
This pattern looks for reversals in the MACD histogram, with a bullish signal being confirmed with a trough, as marked by a rise in the histogram following a decline. The bearish signal on the other hand is a peak confirmation with a declining histogram that had been rising in the last bars. The histogram is meant to grab momentum inflection points. It also requires 3 bars in order to properly define the trough/peak pattern and reduce false signals.
In tandem to this, the OBV would provide trend alignment where the volume direction should match the price trend with positive values confirming bullish signals and negative values confirming the bearish. This on paper confirms institutional participation. Testing with similar conditions to pattern 2 above presents us with the following report that appears to indicate a forward walk:


This signal pattern is suited for trend reversals and can be effective at overbought/ oversold pivots. It does require at least 3 bars of price history, and therefore the first 2 bars in the series are zeroed since they have no comparison data. Its depiction on a chart can be as follows for a bullish signal.

Pattern-5
We code this pattern in python as follows:
def feature_5(macd_df, obv_df, price_df):
    """

    """
    feature = np.zeros((len(macd_df), 2))

    feature[:, 0] = ((macd_df['MACD_Histogram'] > macd_df['MACD_Histogram'].shift(1)) &
                     (macd_df['MACD_Histogram'] < 0.0) &
                     (obv_df['OBV'] > obv_df['OBV'].shift(1))).astype(int)

    feature[:, 1] = ((macd_df['MACD_Histogram'] < macd_df['MACD_Histogram'].shift(1)) &
                     (macd_df['MACD_Histogram'] > 0.0) &
                     (obv_df['OBV'] < obv_df['OBV'].shift(1))).astype(int)

    feature[0, :] = 0
    feature[1, :] = 0

    return feature
Pattern-5 is based on the zero-line context of the MACD. It targets early entries with a bullish signal being marked when the MACD is below zero in bear territory and similarly the bearish being taken when MACD is above the zero. Use of a 3rd party indicator to signal a shift in momentum as this pattern in signalled can help avert false signals. The volume direction filter should also align with volume momentum shift, as a confirmation of institution interest.
For this pattern the bullish signals tend to fade in oversold conditions with rising momentum while bearish indication fades in overbought situations also with weakening momentum. This pattern is better effective in ranging markets and needs the MACD to be pivoting or in a recovery. Testing this pattern after training and optimization as we’ve done with the 2 other patterns above gives us the following test report:


It appears this of the 3 tested here, this is the one still struggling to forward walk. This could be down to false MACD readings given the early timing without independent momentum pivots being confirmed. Its pattern on chart is also indicated as follows:

Conclusion
To sum up, we have revisited the indicator pairing of the MACD and OBV that we introduced in the last article with the intent of seeing if we could remedy the dismal performance for some of its signal patterns. With a supervised learning CNN that uses the rational quadratic kernel to set its kernel and channel sizes, that appears to be the case for 2 of the 3 re-examined patterns. We are putting the 3rd pattern, pattern-5’s, dismal run to weak entry points that require more confirmation.
| Name | Description |
|---|---|
| WZ-72.mq5 | Wizard Assembled Expert Advisor whose header describes files included. |
| SignalWZ_72.mqh | Custom Signal Class file for the wizard assembly |
| 72_2.onnx | Python Exported network for signal pattern-2 |
| 72_3.onnx | Python Exported network for signal pattern-3 |
| 72_5.onnx | Pythion Exported network for signal pattern-5 |
Warning: All rights to these materials are reserved by MetaQuotes Ltd. Copying or reprinting of these materials in whole or in part is prohibited.
This article was written by a user of the site and reflects their personal views. MetaQuotes Ltd is not responsible for the accuracy of the information presented, nor for any consequences resulting from the use of the solutions, strategies or recommendations described.
- Free trading apps
- Over 8,000 signals for copying
- Economic news for exploring financial markets
You agree to website policy and terms of use