
Trading with the MQL5 Economic Calendar (Part 3): Adding Currency, Importance, and Time Filters
Introduction
In this article, we build upon our previous work on the MetaQuotes Language 5 (MQL5) Economic Calendar, where we developed a News dashboard panel for displaying economic events in real time. Now, we will enhance this dashboard by implementing specific filters for currency, importance, and time, allowing traders to focus only on the news events most relevant to their strategies. These filters will provide a targeted view of market-moving events, helping to streamline decision-making and improve trading efficiency. The topics we will cover include:
- Introduction
- Understanding Filter Types in Economic Calendars
- Implementing the Filters in MQL5
- Conclusion
With these additions, our dashboard will become a powerful tool for monitoring and filtering economic news within the MQL5 environment, tailored to traders’ needs for timely and relevant information.
Understanding Filter Types in Economic Calendars
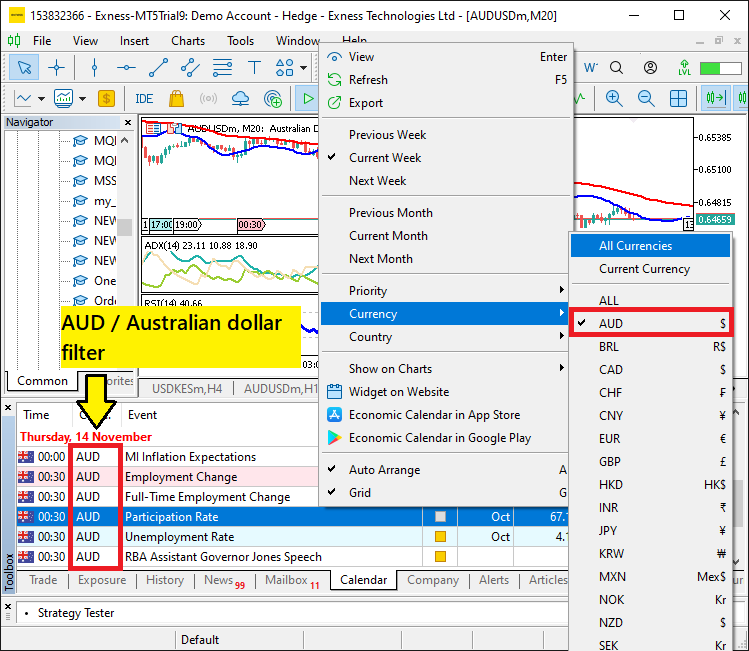
To refine our dashboard’s functionality, we must understand the purpose and benefits of each filter type: currency, importance, and time. The currency filter allows us to view economic events that specifically affect the currencies we are trading, making it easier to pinpoint relevant events that could impact our open positions. This filter helps streamline the dashboard by reducing information overload, focusing on only the currencies in our trading portfolio. In the trading terminal, MetaTrader 5, we can access and filter the news based on the currency by hovering over the Calendar tab, right-clicking inside it, and selecting either the preferred currency or country. Here is an illustration.
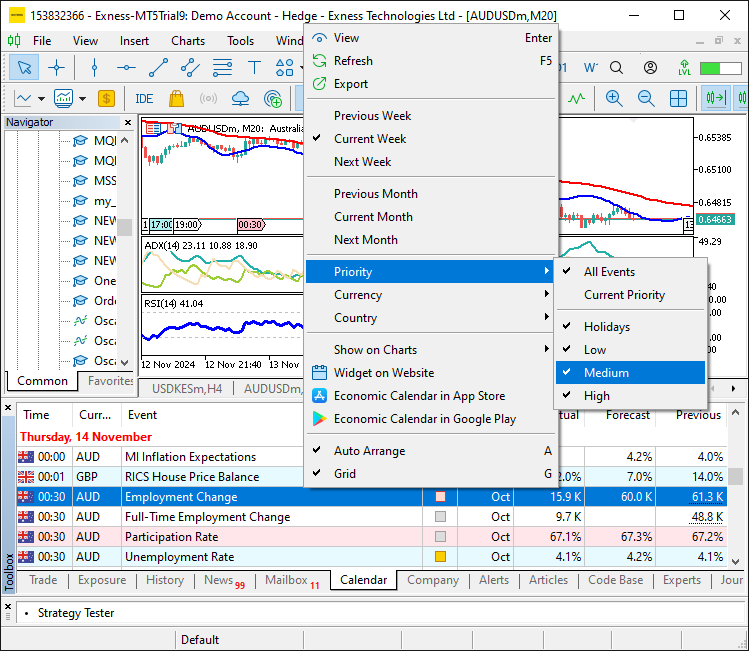
The importance filter categorizes events based on their anticipated impact, typically defined as low, medium, or high importance. High-impact events, such as central bank announcements or unemployment figures, can lead to market volatility. By filtering based on importance, we can quickly assess which events might have the most significant impact on our trading decisions, enhancing responsiveness. To filter the news based on the impact level, you can again right-click on the Calendar tab and select based on priority. Here is an illustration.
Finally, the time filter allows us to specify the timeframe for relevant economic events, which is particularly useful for those trading within specific sessions or preparing for upcoming news. With this filter, we can see events happening within a defined period—such as the next hour, day, or week—providing a timeline that aligns with our trading strategies and time preferences. Together, these filters create a customizable experience that tailors economic news data to individual trading needs, forming the backbone of a responsive and efficient MQL5 dashboard.
Implementing the Filters in MQL5
To implement the filters in MQL5, the first step we need to take is to define the boolean variables in a global scope. These variables will control whether the filters for currency, importance, and time are enabled or disabled. By defining them globally, we will ensure that the filters can be accessed and modified throughout the entire code, providing flexibility in the way the news dashboard operates. This step will set the foundation for implementing the filter logic and allow us to tailor the dashboard's functionality according to our trading needs. To achieve this, this is the logic we use.
//--- Define flags to enable/disable filters
bool enableCurrencyFilter = true;  // Set to 'true' to enable currency filter, 'false' to disable
bool enableImportanceFilter = true; // Set to 'true' to enable importance filter, 'false' to disable
bool enableTimeFilter = true; // Set to 'true' to enable time filter, 'false' to disable
Here, we define three boolean variables, namely "enableCurrencyFilter", "enableImportanceFilter", and "enableTimeFilter", which we will use to control whether the respective filters for currency, importance, and time are enabled or disabled. Each variable is set to a default value of "true", meaning that, by default, all filters will be active. By changing these values to "false", we can disable any of the filters we do not wish to use, allowing us to customize the functionality of the news dashboard based on our trading preferences.
From here, in the initialization logic when counting the valid news events, we will start with the currency filter. First, we need to define the currency codes to which we wish to apply the filter. Thus, we will define them as below.
string curr_filter[] = {"AUD","CAD","CHF","EUR","GBP","JPY","NZD","USD"};
int news_filter_count = 0;
Here, we define the "curr_filter" "string" array, which contains a list of currency pairs—"AUD", "CAD", "CHF", "EUR", "GBP", "JPY", "NZD", and "USD"—that we want to use to filter the news based on specific currencies. This array will help us narrow down the news events displayed on the dashboard, focusing only on those that are relevant to the selected currencies. We also define the "news_filter_count" variable, which we use to keep track of the number of filtered news events that match our selected criteria, ensuring we only display the most pertinent information. Then we can jump to the filter logic as below.
//--- Check if the event’s currency matches any in the filter array (if the filter is enabled)
bool currencyMatch = false;
if (enableCurrencyFilter) {
   for (int j = 0; j < ArraySize(curr_filter); j++) {
      if (country.currency == curr_filter[j]) {
         currencyMatch = true;
         break;
      }
   }

   //--- If no match found, skip to the next event
   if (!currencyMatch) {
      continue;
   }
}
Here, we check whether the event's currency matches any currency in the "curr_filter" array, but only if the currency filter is enabled, as indicated by the "enableCurrencyFilter" flag. If the filter is enabled, we loop through the "curr_filter" array using a for loop, and for each iteration, we compare the event's currency with the currencies in the filter.
If a match is found, we set the "currencyMatch" flag to true and break out of the loop. If no match is found (meaning the "currencyMatch" remains false), we use the continue statement to skip the current event and move on to the next one, ensuring that only relevant events are processed. We then use the same logic to filter the events based on importance.
//--- Check importance level if importance filter is enabled
bool importanceMatch = false;
if (enableImportanceFilter) {
   for (int k = 0; k < ArraySize(allowed_importance_levels); k++) {
      if (event.importance == allowed_importance_levels[k]) {
         importanceMatch = true;
         break;
      }
   }

   //--- If importance does not match the filter criteria, skip the event
   if (!importanceMatch) {
      continue;
   }
}
Here, we check the event's importance level against the predefined "allowed_importance_levels" array, but only if the importance filter is enabled, as indicated by the "enableImportanceFilter" flag. If the filter is enabled, we loop through the "allowed_importance_levels" array using a for loop, comparing the event's importance with the levels in the array.
If a match is found, we set the "importanceMatch" flag to true and break out of the loop. If no match is found (meaning the "importanceMatch" remains false), we use the continue statement to skip the current event, ensuring that only events with the desired importance level are processed. We used another array to define the importance levels as follows:
// Define the levels of importance to filter (low, moderate, high)
ENUM_CALENDAR_EVENT_IMPORTANCE allowed_importance_levels[] = {CALENDAR_IMPORTANCE_LOW, CALENDAR_IMPORTANCE_MODERATE, CALENDAR_IMPORTANCE_HIGH};
Here, we have added all the importance levels, meaning that we technically allow all the news based on priority, but you can choose the ones that are of best fit for your trading decisions. Next, we need to define the time filter ranges.
//--- Define time range for filtering news events based on daily period
datetime timeRange = PeriodSeconds(PERIOD_D1);
datetime timeBefore = TimeTradeServer() - timeRange;
datetime timeAfter = TimeTradeServer() + timeRange;
We define a time range for filtering news events based on the daily period. We use the function PeriodSeconds with constant PERIOD_D1 to determine the number of seconds in a day, which we then assign to the "timeRange" datetime variable. The "timeBefore" and "timeAfter" variables are set to calculate the time range around the current server time, retrieved by using the TimeTradeServer function, by subtracting and adding the "timeRange" respectively. This ensures that only events falling within the specified time range (within one day before or after the current server time) are considered for processing. Ensure to adjust this according to your needs. Armed with this logic, we can then apply the time filter.
//--- Apply time filter and set timeMatch flag (if the filter is enabled)
bool timeMatch = false;
if (enableTimeFilter) {
   datetime eventTime = values[i].time;

   if (eventTime <= TimeTradeServer() && eventTime >= timeBefore) {
      timeMatch = true;  //--- Event is already released
   }
   else if (eventTime >= TimeTradeServer() && eventTime <= timeAfter) {
      timeMatch = true;  //--- Event is yet to be released
   }

   //--- Skip if the event doesn't match the time filter
   if (!timeMatch) {
      continue;
   }
}
Here, we apply the time filter by checking if the event’s time falls within the specified time range, and we use the "timeMatch" flag to track whether the event meets the criteria. If the "enableTimeFilter" is true, we first retrieve the event's time from the "values[i].time" variable. We then check if the event's time is either in the past (between the current server time and "timeBefore") or in the future (between the current server time and "timeAfter"). If the event time falls within either range, the "timeMatch" flag is set to true, indicating that the event matches the time filter. If no match is found, we skip the event by using the continue statement.
That is all for the filters. If we reach here, it means that we have passed all the tests and we have some news events. Thus, we update the news filter count by one.
//--- If we reach here, the currency matches the filter
news_filter_count++; //--- Increment the count of filtered events
It is now with the news filter count data that we use to create the data holder sections because we are not considering all the selected events this time round. This ensures that we create just enough data holders that are relevant to us in the dashboard.
//--- Set alternating colors for each data row holder
color holder_color = (news_filter_count % 2 == 0) ? C'213,227,207' : clrWhite;

//--- Create rectangle label for each data row holder
createRecLabel(DATA_HOLDERS+string(news_filter_count),62,startY-1,716,26+1,holder_color,1,clrNONE);
Here, we set alternating colors for each data row holder to improve the visual distinction between rows. The "holder_color" is determined using a ternary operator, where if the "news_filter_count" is even (i.e., "news_filter_count % 2 == 0"), the color is set to a light green shade (C'213,227,207'), and if it is odd, the color is set to white. This ensures that each row alternates in color, making the data easier to read.
We then create a rectangle label for each data row holder using the "createRecLabel" function, which places a colored rectangle at the specified coordinates. The label is uniquely identified by combining "DATA_HOLDERS" with the string representation of "news_filter_count" to ensure each row has a unique name, and the rectangle dimensions are set to fit the content. The rectangle's border is set to a thickness of 1, while we set the fill color to the alternating "holder_color" and the border color is set to "clrNONE" for no border color.
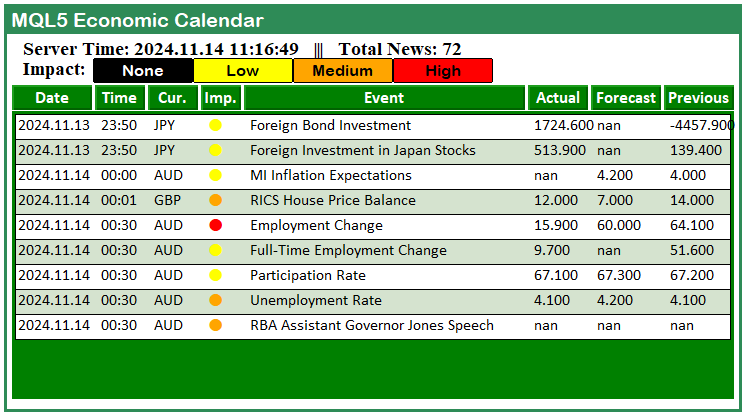
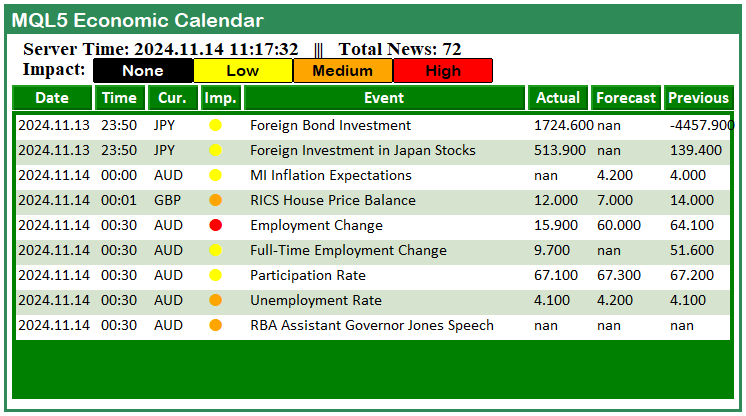
However, notice that we added 1 pixel to the y displacement of the holders as highlighted in yellow color, to get rid of the borders. Here is a comparison result.
Before the addition of 1 pixel:
After the addition of 1 pixel:
That was a success. The next thing that we need to do is update the total news as displayed in the dashboard when the filters are applied.
updateLabel(TIME_LABEL,"Server Time: "+TimeToString(TimeCurrent(),
           TIME_DATE|TIME_SECONDS)+"   |||   Total News: "+
           IntegerToString(news_filter_count)+"/"+IntegerToString(allValues));
Here, we use the "updateLabel" function to update the label that displays the current server time and the total number of filtered news events. We update the label identified by "TIME_LABEL" with a new string that combines the current server time and the count of news events. To get the current server time, we use the TimeCurrent function and format it using the TimeToString function with the "TIME_DATE | TIME_SECONDS" flags.
We then display the total number of filtered news events, stored in "news_filter_count," alongside the total number of available news events, represented by "allValues." By updating this label, we provide real-time information on both the server time and the status of the news filter, helping us stay informed of the current market news that is of importance to us.
The code snippet of the custom function that we use to update the label is as follows.
//+------------------------------------------------------------------+
//|     Function to create text label                                |
//+------------------------------------------------------------------+

bool updateLabel(string objName,string txt) {
    // Reset any previous errors
    ResetLastError();

    if (!ObjectSetString(0,objName,OBJPROP_TEXT,txt)) {
        Print(__FUNCTION__, ": failed to update the label! Error code = ", _LastError);
        return (false);
    }

    ObjectSetString(0, objName, OBJPROP_TEXT, txt); // Text displayed on the label

    // Redraw the chart to display the label
    ChartRedraw(0);

    return (true); // Label creation successful
}
Here, we define the "updateLabel" function, which we use to update an existing label on the chart. The function takes two parameters: "objName" (the name of the label object) and "txt" (the text to be displayed on the label). We begin by resetting any previous errors using the ResetLastError function to ensure a clean slate. Next, we attempt to update the label's text with the provided string "txt" using the ObjectSetString function. If the update fails, we print an error message using the Print function along with the error code retrieved from _LastError and return "false".
If the label update is successful, we call the ChartRedraw function to refresh the chart and display the updated label, and finally, we return "true" to indicate the operation was successful. This is the function that allows us to dynamically update the content of labels on the chart, providing a flexible method for displaying information such as the server time or news event counts. Upon running the program, this is what we have.
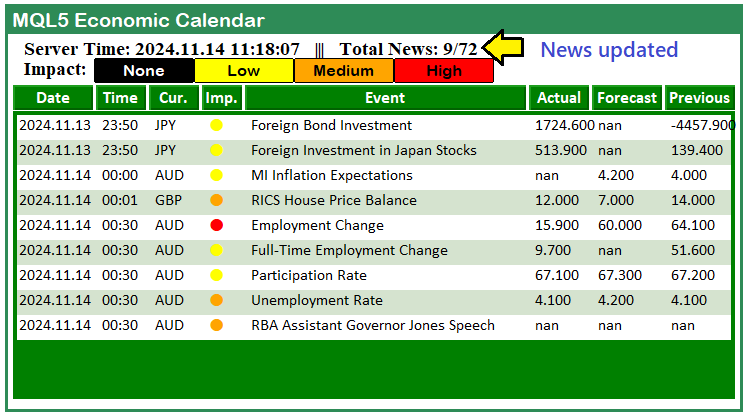
With the implementation, we are now sure that we only consider the news that is relevant to us and ignore the others. We also display the total passed news out of all the selected news, showing both the available and considered news events. The full initialization code snippet responsible for the application of the filters is as below.
string curr_filter[] = {"AUD","CAD","CHF","EUR","GBP","JPY","NZD","USD"};
int news_filter_count = 0;

// Define the levels of importance to filter (low, moderate, high)
ENUM_CALENDAR_EVENT_IMPORTANCE allowed_importance_levels[] = {CALENDAR_IMPORTANCE_LOW, CALENDAR_IMPORTANCE_MODERATE, CALENDAR_IMPORTANCE_HIGH};

//--- Loop through each calendar value up to the maximum defined total
for (int i = 0; i < valuesTotal; i++){

   MqlCalendarEvent event; //--- Declare event structure
   CalendarEventById(values[i].event_id,event); //--- Retrieve event details by ID

   MqlCalendarCountry country; //--- Declare country structure
   CalendarCountryById(event.country_id,country); //--- Retrieve country details by event's country ID

   MqlCalendarValue value; //--- Declare calendar value structure
   CalendarValueById(values[i].id,value); //--- Retrieve actual, forecast, and previous values


   //--- Check if the event’s currency matches any in the filter array (if the filter is enabled)
   bool currencyMatch = false;
   if (enableCurrencyFilter) {
      for (int j = 0; j < ArraySize(curr_filter); j++) {
         if (country.currency == curr_filter[j]) {
            currencyMatch = true;
            break;
         }
      }

      //--- If no match found, skip to the next event
      if (!currencyMatch) {
         continue;
      }
   }

   //--- Check importance level if importance filter is enabled
   bool importanceMatch = false;
   if (enableImportanceFilter) {
      for (int k = 0; k < ArraySize(allowed_importance_levels); k++) {
         if (event.importance == allowed_importance_levels[k]) {
            importanceMatch = true;
            break;
         }
      }

      //--- If importance does not match the filter criteria, skip the event
      if (!importanceMatch) {
         continue;
      }
   }

   //--- Apply time filter and set timeMatch flag (if the filter is enabled)
   bool timeMatch = false;
   if (enableTimeFilter) {
      datetime eventTime = values[i].time;

      if (eventTime <= TimeTradeServer() && eventTime >= timeBefore) {
         timeMatch = true;  //--- Event is already released
      }
      else if (eventTime >= TimeTradeServer() && eventTime <= timeAfter) {
         timeMatch = true;  //--- Event is yet to be released
      }

      //--- Skip if the event doesn't match the time filter
      if (!timeMatch) {
         continue;
      }
   }

   //--- If we reach here, the currency matches the filter
   news_filter_count++; //--- Increment the count of filtered events

   //--- Set alternating colors for each data row holder
   color holder_color = (news_filter_count % 2 == 0) ? C'213,227,207' : clrWhite;

   //--- Create rectangle label for each data row holder
   createRecLabel(DATA_HOLDERS+string(news_filter_count),62,startY-1,716,26+1,holder_color,1,clrNONE);

   //--- Initialize starting x-coordinate for each data entry
   int startX = 65;

   //--- Loop through calendar data columns
   for (int k=0; k<ArraySize(array_calendar); k++){

      //--- Print event details for debugging
      //Print("Name = ",event.name,", IMP = ",EnumToString(event.importance),", COUNTRY = ",country.name,", TIME = ",values[i].time);

      //--- Skip event if currency does not match the selected country code
      // if (StringFind(_Symbol,country.currency) < 0) continue;

      //--- Prepare news data array with time, country, and other event details
      string news_data[ArraySize(array_calendar)];
      news_data[0] = TimeToString(values[i].time,TIME_DATE); //--- Event date
      news_data[1] = TimeToString(values[i].time,TIME_MINUTES); //--- Event time
      news_data[2] = country.currency; //--- Event country currency

      //--- Determine importance color based on event impact
      color importance_color = clrBlack;
      if (event.importance == CALENDAR_IMPORTANCE_LOW){importance_color=clrYellow;}
      else if (event.importance == CALENDAR_IMPORTANCE_MODERATE){importance_color=clrOrange;}
      else if (event.importance == CALENDAR_IMPORTANCE_HIGH){importance_color=clrRed;}

      //--- Set importance symbol for the event
      news_data[3] = ShortToString(0x25CF);

      //--- Set event name in the data array
      news_data[4] = event.name;

      //--- Populate actual, forecast, and previous values in the news data array
      news_data[5] = DoubleToString(value.GetActualValue(),3);
      news_data[6] = DoubleToString(value.GetForecastValue(),3);
      news_data[7] = DoubleToString(value.GetPreviousValue(),3);

      //--- Create label for each news data item
      if (k == 3){
         createLabel(ARRAY_NEWS+IntegerToString(i)+" "+array_calendar[k],startX,startY-(22-12),news_data[k],importance_color,22,"Calibri");
      }
      else {
         createLabel(ARRAY_NEWS+IntegerToString(i)+" "+array_calendar[k],startX,startY,news_data[k],clrBlack,12,"Calibri");
      }

      //--- Increment x-coordinate for the next column
      startX += buttons[k]+3;
   }
   //--- Increment y-coordinate for the next row of data
   startY += 25;
   //Print(startY); //--- Print current y-coordinate for debugging
}

//Print("Final News = ",news_filter_count);
updateLabel(TIME_LABEL,"Server Time: "+TimeToString(TimeCurrent(),
           TIME_DATE|TIME_SECONDS)+"   |||   Total News: "+
           IntegerToString(news_filter_count)+"/"+IntegerToString(allValues));
That was a success. In the end, we want to get rid of the dashboard when the program is removed from the chart to leave a clean environment. To easily achieve that more professionally, we can define a function where we add all the control logic.
//+------------------------------------------------------------------+
//|      Function to destroy the Dashboard panel                     |
//+------------------------------------------------------------------+

void destroy_Dashboard(){

   //--- Delete main rectangle panel
   ObjectDelete(0, MAIN_REC);

   //--- Delete first sub-rectangle in the dashboard
   ObjectDelete(0, SUB_REC1);

   //--- Delete second sub-rectangle in the dashboard
   ObjectDelete(0, SUB_REC2);

   //--- Delete header label text
   ObjectDelete(0, HEADER_LABEL);

   //--- Delete server time label text
   ObjectDelete(0, TIME_LABEL);

   //--- Delete label for impact/importance
   ObjectDelete(0, IMPACT_LABEL);

   //--- Delete all objects related to the calendar array
   ObjectsDeleteAll(0, ARRAY_CALENDAR);

   //--- Delete all objects related to the news array
   ObjectsDeleteAll(0, ARRAY_NEWS);

   //--- Delete all data holder objects created in the dashboard
   ObjectsDeleteAll(0, DATA_HOLDERS);

   //--- Delete all impact label objects
   ObjectsDeleteAll(0, IMPACT_LABEL);

   //--- Redraw the chart to update any visual changes
   ChartRedraw(0);
}
Here, we define the custom function "destroy_Dashboard", which we will use to handle the complete removal of all elements created for our dashboard panel on the chart, returning the chart to its initial state. This involves deleting each object, label, and holder used within the dashboard. First, we delete the main panel rectangle by calling the ObjectDelete function on "MAIN_REC", which represents the primary container of our dashboard. We then proceed to remove any sub-rectangles, such as "SUB_REC1" and "SUB_REC2", which we have used to organize various sections of the dashboard.
Following this, we delete labels that display information such as the dashboard header ("HEADER_LABEL"), server time ("TIME_LABEL"), and impact level ("IMPACT_LABEL"). Each of these labels is removed to ensure that any textual information displayed on the chart is cleared. Next, we delete all the objects in "ARRAY_CALENDAR" and "ARRAY_NEWS", which store information about the calendar and news data, respectively. We perform this action using the ObjectsDeleteAll function, which allows us to clear out any dynamically created objects associated with these arrays.
We then delete all objects related to "DATA_HOLDERS", which represent individual rows or containers displaying data points in the dashboard, followed by another call to delete "IMPACT_LABEL" instances to ensure no visual elements remain.
Finally, we call the ChartRedraw function, which refreshes the chart and clears any remnants of the dashboard, providing a blank canvas for any further drawing or dashboard reset. This function essentially dismantles the entire dashboard display, preparing the chart for fresh updates or other visual elements as needed after we remove the program. At last, we just call the function on the OnDeinit event handler to effect the dashboard removal.
//+------------------------------------------------------------------+
//| Expert deinitialization function                                 |
//+------------------------------------------------------------------+
void OnDeinit(const int reason){
//---

   destroy_Dashboard();
}
After calling the custom function on the OnDeinit event handler, we make sure to get rid of the dashboard from the chart. That is all that is needed to add the filters to our dashboard.
Conclusion
In conclusion, we have successfully enhanced our MQL5 Economic Calendar dashboard by integrating essential filtering capabilities, which we use to view only the most relevant news events based on currency, importance, and time. These filters provide a more streamlined and focused interface, allowing us to concentrate on economic events that align with our specific trading strategy and goals.
By refining the dashboard with these filters, we make it a more powerful and efficient tool for informed decision-making. In the next part, we will expand on this foundation by adding live updates to the calendar dashboard logic, enabling it to constantly refresh with the latest economic news directly within our MQL5 dashboard.
Warning: All rights to these materials are reserved by MetaQuotes Ltd. Copying or reprinting of these materials in whole or in part is prohibited.
This article was written by a user of the site and reflects their personal views. MetaQuotes Ltd is not responsible for the accuracy of the information presented, nor for any consequences resulting from the use of the solutions, strategies or recommendations described.
 MQL5 Wizard Techniques you should know (Part 50): Awesome Oscillator
 Neural Networks Made Easy (Part 94): Optimizing the Input Sequence
 Price Action Analysis Toolkit Development (Part 3): Analytics Master — EA
 Mastering Log Records (Part 1): Fundamental Concepts and First Steps in MQL5
- Free trading apps
- Over 8,000 signals for copying
- Economic news for exploring financial markets
You agree to website policy and terms of use