Mastering Log Records (Part 1): Fundamental Concepts and First Steps in MQL5
Introduction
Welcome to the beginning of another journey! This article opens a special series where we will create, step by step, a library for handling logs, tailored for those who develop in the MQL5 language. The idea is simple, but ambitious: to offer a robust, flexible and high-quality tool, capable of making the recording and analysis of logs in Expert Advisors (EAs) something more practical, efficient and powerful.
Today, we have MetaTrader 5's native logs, which even fulfill their role of monitoring the basics: terminal startup, server connections, environment details. But let's be honest, these logs were not designed for the particularities of developing EAs. When we want to understand the specific behavior of an EA in execution, limitations appear. There is a lack of precision, control, and that customization that makes all the difference.
This is where the proposal of this series comes in: to go further. We will build a tailored log system from scratch, completely customizable. Imagine having complete control over what to log: critical events, error tracking, performance analysis, or even storing specific information for future investigations. All of this, of course, in an organized manner and with the efficiency that the scenario demands.
But it's not just about code. This series goes beyond the keyboard. We'll explore the fundamentals of logging, understand the "why" before the "how", discuss best design practices, and together build something that's not only functional, but also elegant and intuitive. After all, creating software isn't just about solving problems, it's also an art.
What are Logs?
Functionally, logs are chronological records of events that systems and applications constantly generate. They are like eyewitness accounts of every request made, every error thrown, and every decision made by the expert advisor. If a developer wants to track down why a flow broke, logs are his starting point. Without them, interpreting what happens would be equivalent to exploring a maze in the dark.
The truth is that we are increasingly surrounded by a digital universe where systems are not just tools, but essential gears in a world that breathes code. Think about instant communications, fractional-second financial transactions, or the automated control of an industrial plant. Reliability here is not a luxury, it is a prerequisite. But... what happens when things go wrong? Where does the search for what broke begin? Logs are the answer. They are the eyes and ears inside the black box we call systems.
Imagine the following: an expert advisor, in an automated negotiation, starts failing to send mass requests to the server. Suddenly, rejections appear. Without structured logs, you're left throwing hypotheses into the air: is the server overloaded? Maybe an expert advisor configuration is wrong? With well-designed logs, you can not only find the "haystack", but also locate the exact needle, an authentication error, a timeout or even an excessive volume of requests.
But not everything is perfect in logs. Using them without criteria can end up shooting yourself in the foot: irrelevant data accumulates, storage costs explode and, in the worst case scenario, sensitive information can leak. Furthermore, having logs is not enough; you need to know how to configure them clearly and interpret them accurately. Otherwise, what should be a map turns into chaotic noise, more confusion than solution.
To see logs in depth is to understand that they are not just tools. They are silent partners that reveal, at the right time, what the systems have to say. And as in any good partnership, the value lies in knowing how to listen.
In a slightly more practical way, logs consist of lines of text that document specific events within a system. They can contain information such as:
- Event date and time: to track when something happened.
- Event type: error, warning, information, debug, among others.
- Descriptive message: explanation of what happened.
- Additional context: technical details, such as variable values at the time, data about the chart, such as timeframe or symbol, or even some value of a parameter that was used.
Advantages of Using Logs
Below, we detail some of the main advantages that using logs offers, highlighting how they can optimize operations and ensure the efficiency of expert advisors.
1.Debugging and Troubleshooting
With well-structured logs, everything changes. They provide not only a view of what went wrong, but also of the why and the how. An error, which previously seemed like a fleeting shadow, becomes something that you can track, understand and correct. It's like having a magnifying glass that magnifies every critical detail of the moment the problem occurred.
Imagine, for example, that a request fails unexpectedly. Without logs, the problem could be attributed to chance, and the solution would be left to guesswork. But with clear logs, the scenario changes. The error message appears as a beacon, accompanied by valuable data about the request in question: parameters sent, server response or even an unexpected timeout. This context not only reveals the origin of the error but also illuminates the path to solving it.
Practical example of an error log:
[2024-11-18 14:32:15] ERROR : Limit Buy Trade Request Failed - Invalid Price in Request [10015 | TRADE_RETCODE_INVALID_PRICE]
This log reveals exactly what the error was, the attempt to send a request to the server, showing that the error code was 10015, which represents an invalid price error in the request, so the expert advisor developer can know exactly in which order the error is, in this example it is when sending a limit buy order.
2.Auditing and Compliance
Logs play an essential role when it comes to auditing and compliance with security standards and policies. In sectors that deal with sensitive data, such as finance, the requirement for detailed records goes beyond mere organization: it is a matter of being aligned with the laws and regulations that govern the operation.
They serve as a reliable trail that documents every relevant action: who accessed the information, at what time and what was done. This not only brings transparency to the environment, but also becomes a powerful tool in the investigation of security incidents or questionable practices. With well-structured logs, identifying irregular activities ceases to be a nebulous challenge and becomes a direct and efficient process, strengthening trust and security in the system.
3.Performance Monitoring
The use of logs is also crucial for performance monitoring of systems. In production environments, where response time and efficiency are crucial, logs allow you to track the health of your expert advisor in real time. Performance logs can include information about order response time, resource usage (such as CPU, memory, and disk), and error rates. From there, corrective actions can be taken, such as code optimization.
Example of performance log:
[2024-11-18 16:45:23] INFO - Server response received, EURUSD purchase executed successfully | Volume: 0.01 | Price: 1.01234 | Duration: 49 ms
4. Automation and Alerts
Automation stands out as one of the great advantages of logs, especially when integrated with monitoring and analysis tools. With the right configuration, logs can trigger automatic alerts as soon as critical events are detected, ensuring that the developer is immediately informed about failures, errors or even major losses generated by the Expert Advisor.
These alerts go beyond simple warnings: they can be sent by email, SMS or integrated into management platforms, allowing for a quick and accurate reaction. This level of automation not only protects the system against problems that can escalate quickly, but also gives the developer the power to act proactively, minimizing impacts and ensuring the stability of the environment.
Example of a log with an alert:
[2024-11-18 19:15:50] FATAL - CPU usage exceeded 90%, immediate attention required.
In short, the benefits of using logs go far beyond simply recording information about what is happening in your Expert Advisor. They provide a powerful tool for debugging, performance monitoring, security auditing, and alert automation, making them an indispensable component in efficiently managing your experts' infrastructure.
Defining the Library Requirements
Before starting development, it is essential to establish a clear vision of what we want to achieve. This way, we avoid rework and ensure that the library will meet the real needs of those who will use it. With this in mind, I have listed the main features that this log handling library should offer:
-
Singleton
The library should implement the Singleton design pattern to ensure that all instances access the same log object. This ensures consistency in log management across different parts of the code and avoids unnecessary duplication of resources. In the next article I will cover this in more detail.
-
Database Storage
I want all logs to be stored in a database, allowing queries on the data. This is a key feature for analyzing history, audits and even identifying behavior patterns.
-
Different Outputs
The library should offer flexibility to display logs in various ways, such as:
- Console
- Terminal
- Files
- Database
This diversity allows logs to be accessed in the most convenient format for each situation.
-
Log Levels
We should support different log levels to classify messages according to their severity. Levels include:
- DEBUG : Detailed messages for debugging.
- INFO : General information about the system's operation.
- ALERT : Alerts for situations that require attention, but are not critical.
- ERROR : Errors that affect parts of the system, but allow continuity.
- FATAL : Serious problems that interrupt the system's execution.
-
Custom Log Format
It is important to allow the format of log messages to be customizable. An example would be:
([{timestamp}] {level} : {origin} {message})This provides flexibility to adapt the output to the specific needs of each project.
-
Rotating Log
To avoid uncontrolled growth of log files, the library should implement a rotation system, saving logs to different files each day or after reaching a certain size.
-
Dynamic Data Columns
An essential feature is the ability to store dynamic metadata in JSON format. This data can include information specific to the Expert Advisor at the time the message was logged, enriching the context of the logs.
-
Automatic Notifications
The library should be able to send notifications at specific severity levels, such as FATAL . These alerts can be sent by:
- SMS
- Terminal alerts
This ensures that responsible parties are informed immediately about critical issues.
-
Code Length Measurement
Finally, it is essential to include a feature to measure the length of code snippets. This will allow us to identify performance bottlenecks and optimize processes.
These requirements will be the foundation for the development of this library. As we move forward with the implementation, we will explore how each functionality will be built and integrated into the whole. This structured approach not only helps us stay focused, but also ensures that the final product is robust, flexible, and adaptable to the needs of Expert Advisor developers in the MQL5 environment.
Structuring the project base
Now that we have the requirements well defined, the next step is to start structuring the base of our project. The correct organization of files and folders is crucial to keep the code modular, easy to understand and maintain. With this in mind, let's start creating the initial structure of directories and files for our log library.
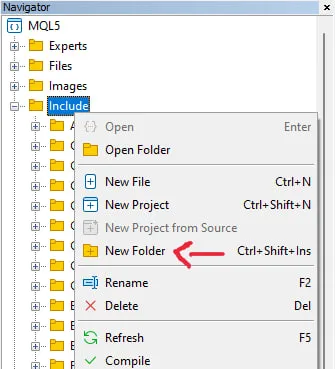
The first step is to create a new folder inside the Includes folder, which will be responsible for storing all the files related to the log library. To do this, simply right-click on the Includes folder in the navigation tab as shown in the image and select the “New folder” option:


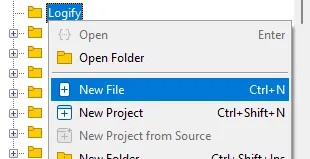
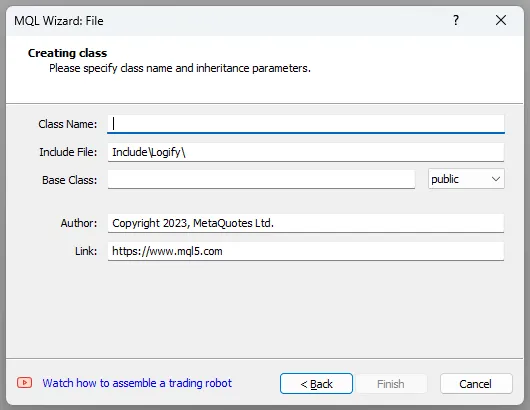
A window will appear with the options for the new file, select the “New class” option and press “Next“, when you do this you will see this window:

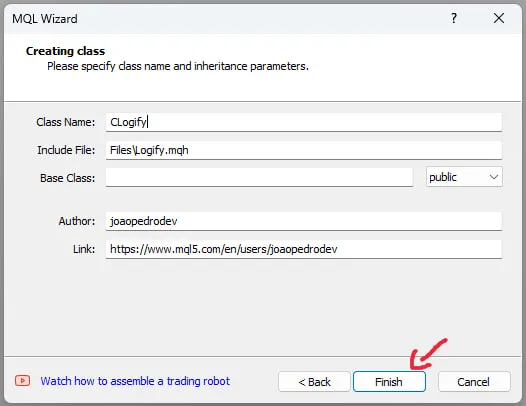
Fill in the parameters, the class name will be CLogify, after that I changed the author name and link, but these parameters are not relevant to the class. In the end it will look like this:

//+------------------------------------------------------------------+
//|                                                       Logify.mqh |
//|                                                     joaopedrodev |
//|                       https://www.mql5.com/en/users/joaopedrodev |
//+------------------------------------------------------------------+
#property copyright "joaopedrodev"
#property link      "https://www.mql5.com/en/users/joaopedrodev"
#property version   "1.00"
class CLogify
  {
private:

public:
                     CLogify();
                    ~CLogify();
  };
//+------------------------------------------------------------------+
//|                                                                  |
//+------------------------------------------------------------------+
CLogify::CLogify()
  {
  }
//+------------------------------------------------------------------+
//|                                                                  |
//+------------------------------------------------------------------+
CLogify::~CLogify()
  {
  }
//+------------------------------------------------------------------+
Following this same step by step, create two other files:
- LogifyLevel.mqh → Defines an enum with the log levels that will be used.
- LogifyModel.mqh → Data structure to store detailed information about each log
In the end, we will have this folder and file structure:
|--- Logify
|--- Logify.mqh
|--- LogifyLevel.mqh
|--- LogifyModel.mqh
With the basic structure and initial files created, we will have a functional skeleton of the log library.
Creating severity levels
Here we will use the LogifyLevel.mqh file, this file defines the different severity levels that a log can have, encapsulated in an enum . This is the code of the enum that will be used:
enum ENUM_LOG_LEVEL
  {
   LOG_LEVEL_DEBUG = 0,    // Debug
   LOG_LEVEL_INFOR,        // Infor
   LOG_LEVEL_ALERT,        // Alert
   LOG_LEVEL_ERROR,        // Error
   LOG_LEVEL_FATAL,        // Fatal
  };
Explanation
- Enumeration: Each value of the enum represents a severity level for the logs, ranging from LOG_LEVEL_DEBUG (least severe) to LOG_LEVEL_FATAL (most severe).
- Usability: This enum will be used to categorize the logs into different levels, facilitating filtering or specific actions based on severity.
Creating the Data Model
Now, let's create a data structure to store the log information that will be handled by the library. This structure will be stored in the LogifyModel.mqh file and will serve as the basis for storing all the logs captured by the system.
Below is the code for defining the structure MqlLogifyModel , which will be responsible for storing the essential data of each log entry, such as the timestamp (date and time of the event), the source (where the log was generated from), the log message, and any additional metadata.
//+------------------------------------------------------------------+
//|                                                  LogifyModel.mqh |
//|                                                     joaopedrodev |
//|                       https://www.mql5.com/en/users/joaopedrodev |
//+------------------------------------------------------------------+
#property copyright "joaopedrodev"
#property link      "https://www.mql5.com/en/users/joaopedrodev"
//+------------------------------------------------------------------+
//|                                                                  |
//+------------------------------------------------------------------+
#include "LogifyLevel.mqh"
//+------------------------------------------------------------------+
//|                                                                  |
//+------------------------------------------------------------------+
struct MqlLogifyModel
  {
   ulong timestamp;        // Date and time of the event
   ENUM_LOG_LEVEL level;   // Severity level
   string origin;          // Log source
   string message;         // Log message
   string metadata;        // Additional information in JSON or text

   MqlLogifyModel::MqlLogifyModel(void)
     {
      timestamp = 0;
      level = LOG_LEVEL_DEBUG;
      origin = "";
      message = "";
      metadata = "";
     }
   MqlLogifyModel::MqlLogifyModel(ulong _timestamp,ENUM_LOG_LEVEL _level,string _origin,string _message,string _metadata)
     {
      timestamp = _timestamp;
      level = _level;
      origin = _origin;
      message = _message;
      metadata = _metadata;
     }
  };
//+------------------------------------------------------------------+
Data Structure Explanation
- timestamp: A ulong value that stores the date and time of the event. This field will be populated with the timestamp of the log at the time the log entry was created.
- level: Severity level of the message
- origin: A string field that identifies the origin of the log. This can be useful for determining which part of the system generated the log message (e.g. the name of the module or function).
- message: The log message itself, also of string type, that describes the event or action that occurred in the system.
- metadata: An additional field that stores extra information about the log. This can be a JSON object or a simple text string that contains additional data related to the event. This is useful for storing contextual information, such as execution parameters or system-specific data.
Constructors
- The default constructor initializes all fields with empty values or zero.
- The parameterized constructor allows you to create an instance of MqlLogifyModel by directly filling in the fields with specific values, such as timestamp, source, message, and metadata.
Implementing the Main Class CLogify
Now we will implement the main class of the logging library, CLogify , which will serve as the core for managing and displaying logs. This class includes methods for different log levels and a generic method called Append that is used by all other methods.
The class will be defined in the Logify.mqh file and will contain the following methods:
//+------------------------------------------------------------------+
//| class : CLogify                                                  |
//|                                                                  |
//| [PROPERTY]                                                       |
//| Name        : Logify                                             |
//| Heritage    : No heritage                                        |
//| Description : Core class for log management.                     |
//|                                                                  |
//+------------------------------------------------------------------+
class CLogify
  {
private:

public:
                     CLogify();
                    ~CLogify();

   //--- Generic method for adding logs
   bool              Append(ulong timestamp, ENUM_LOG_LEVEL level, string message, string origin = "", string metadata = "");

   //--- Specific methods for each log level
   bool              Debug(string message, string origin = "", string metadata = "");
   bool              Infor(string message, string origin = "", string metadata = "");
   bool              Alert(string message, string origin = "", string metadata = "");
   bool              Error(string message, string origin = "", string metadata = "");
   bool              Fatal(string message, string origin = "", string metadata = "");
  };
//+------------------------------------------------------------------+
//| Constructor                                                      |
//+------------------------------------------------------------------+
CLogify::CLogify()
  {
  }
//+------------------------------------------------------------------+
//| Destructor                                                       |
//+------------------------------------------------------------------+
CLogify::~CLogify()
  {
  }
//+------------------------------------------------------------------+
The class methods will be implemented to display logs on the console, using the Print function. Later, these logs can be directed to other outputs, such as files, databases or graphs.
//+------------------------------------------------------------------+
//| Generic method for adding logs                                   |
//+------------------------------------------------------------------+
bool CLogify::Append(ulong timestamp,ENUM_LOG_LEVEL level,string message,string origin="",string metadata="")
  {
   MqlLogifyModel model(timestamp,level,origin,message,metadata);
   string levelStr = "";
   switch(level)
     {
      case LOGIFY_DEBUG: levelStr = "DEBUG"; break;
      case LOGIFY_INFO:  levelStr = "INFO";  break;
      case LOGIFY_ALERT: levelStr = "ALERT"; break;
      case LOGIFY_ERROR: levelStr = "ERROR"; break;
      case LOGIFY_FATAL: levelStr = "FATAL"; break;
     }

   Print("[" + TimeToString(timestamp) + "] [" + levelStr + "] [" + origin + "] - " + message + " " + metadata);
   return(true);
  }
//+------------------------------------------------------------------+
//| Debug level message                                              |
//+------------------------------------------------------------------+
bool CLogify::Debug(string message,string origin="",string metadata="")
  {
   return(this.Append(TimeCurrent(),LOG_LEVEL_DEBUG,message,origin,metadata));
  }
//+------------------------------------------------------------------+
//| Infor level message                                              |
//+------------------------------------------------------------------+
bool CLogify::Infor(string message,string origin="",string metadata="")
  {
   return(this.Append(TimeCurrent(),LOG_LEVEL_INFOR,message,origin,metadata));
  }
//+------------------------------------------------------------------+
//| Alert level message                                              |
//+------------------------------------------------------------------+
bool CLogify::Alert(string message,string origin="",string metadata="")
  {
   return(this.Append(TimeCurrent(),LOG_LEVEL_ALERT,message,origin,metadata));
  }
//+------------------------------------------------------------------+
//| Error level message                                              |
//+------------------------------------------------------------------+
bool CLogify::Error(string message,string origin="",string metadata="")
  {
   return(this.Append(TimeCurrent(),LOG_LEVEL_ERROR,message,origin,metadata));
  }
//+------------------------------------------------------------------+
//| Fatal level message                                              |
//+------------------------------------------------------------------+
bool CLogify::Fatal(string message,string origin="",string metadata="")
  {
   return(this.Append(TimeCurrent(),LOG_LEVEL_FATAL,message,origin,metadata));
  }
//+------------------------------------------------------------------+
Now that we have the main structure and methods for displaying basic logs, the next step will be to create tests to ensure that they work correctly. Again, we will add support for different types of output later, such as files, databases, and graphs.
Tests
To perform tests on the Logify library, we will create a dedicated Expert Advisor. First, create a new folder called Logify inside the experts directory, which will contain all the test files. Then, create the LogifyTest.mq5 file with the initial structure: //+------------------------------------------------------------------+ //| LogifyTest.mq5 | //| Copyright 2023, MetaQuotes Ltd. | //| https://www.mql5.com | //+------------------------------------------------------------------+ #property copyright "Copyright 2023, MetaQuotes Ltd." #property link "https://www.mql5.com" #property version "1.00" //+------------------------------------------------------------------+ //| Expert initialization function | //+------------------------------------------------------------------+ int OnInit() { //--- //--- return(INIT_SUCCEEDED); } //+------------------------------------------------------------------+ //| Expert deinitialization function | //+------------------------------------------------------------------+ void OnDeinit(const int reason) { //--- } //+------------------------------------------------------------------+ //| Expert tick function | //+------------------------------------------------------------------+ void OnTick() { //--- } //+------------------------------------------------------------------+
Include the main library file and instantiate the CLogify class:
//+------------------------------------------------------------------+
//|                                                                  |
//+------------------------------------------------------------------+
#include <Logify/Logify.mqh>
CLogify logify;
In the OnInit function, add logging calls to test all available levels:
//+------------------------------------------------------------------+
//| Expert initialization function                                   |
//+------------------------------------------------------------------+
int OnInit()
  {
//---
   logify.Debug("RSI indicator value calculated: 72.56", "Indicators", "Period: 14");
   logify.Infor("Buy order sent successfully", "Order Management", "Symbol: EURUSD, Volume: 0.1");
   logify.Alert("Stop Loss adjusted to breakeven level", "Risk Management", "Order ID: 12345678");
   logify.Error("Failed to send sell order", "Order Management", "Reason: Insufficient balance");
   logify.Fatal("Failed to initialize EA: Invalid settings", "Initialization", "Missing or incorrect parameters");
//---
   return(INIT_SUCCEEDED);
  }
//+------------------------------------------------------------------+
When executing the code, the expected messages in the MetaTrader 5 terminal will be displayed as below:

Conclusion
The Logify library has been successfully tested, correctly displaying log messages for all available levels. This basic structure allows for organized and extensible log management, providing a solid foundation for future improvements, such as integration with databases, files, or charts.
With a modular implementation and easy-to-use methods, Logify provides flexibility and clarity in log management in MQL5 applications. Next steps may include creating alternative outputs and adding dynamic settings to customize the library behavior. See you in the next article!
Warning: All rights to these materials are reserved by MetaQuotes Ltd. Copying or reprinting of these materials in whole or in part is prohibited.
This article was written by a user of the site and reflects their personal views. MetaQuotes Ltd is not responsible for the accuracy of the information presented, nor for any consequences resulting from the use of the solutions, strategies or recommendations described.
 Neural Networks Made Easy (Part 94): Optimizing the Input Sequence
 Creating a Trading Administrator Panel in MQL5 (Part VII): Trusted User, Recovery and Cryptography
 Trading with the MQL5 Economic Calendar (Part 3): Adding Currency, Importance, and Time Filters
 MQL5 Wizard Techniques you should know (Part 49): Reinforcement Learning with Proximal Policy Optimization
- Free trading apps
- Over 8,000 signals for copying
- Economic news for exploring financial markets
You agree to website policy and terms of use