Trading with the MQL5 Economic Calendar (Part 2): Creating a News Dashboard Panel

Introduction
In this article, we build upon our previous exploration in Part 1 of the MetaQuotes Language 5 (MQL5) Economic Calendar, where we focused on mastering the functions necessary to retrieve and analyze economic news events. Now, we will take the next step by creating a News dashboard panel that provides traders with a convenient interface for accessing critical economic data in real-time. This dashboard will help streamline decision-making processes by highlighting relevant news events that could influence market movements. The topics we will cover include:
- Designing the Dashboard Panel
- Setting Up the Panel in MQL5
- Conclusion
With these components, we aim to enhance the trading experience by providing an effective tool for monitoring economic events in real-time for the Economic news in MQL5.
Designing the Dashboard Panel
Designing the dashboard panel is a crucial step in creating an effective tool for monitoring economic news events using the MQL5 Economic Calendar. Our objective is to create a user-friendly and visually appealing interface that presents important information clearly and concisely. A well-structured dashboard will allow us to quickly assess the relevance and impact of economic events on our trading strategies.
When designing the dashboard panel, we will need to start by identifying the key components that need to be displayed. These components typically include the event name, scheduled time, currency affected, importance level, and a brief description of the event. To enhance usability, we will organize this information in a table format, with each row representing a different economic event. We intend to make the table easily readable, utilizing contrasting colors for different importance levels to allow for quick identification of high-impact events.
To make the panel more appealing, we will choose visual elements, such as borders, backgrounds, and fonts to create a clean and professional appearance. The layout will allow for easy navigation, ensuring we can swiftly locate the information we need without overwhelming us with excessive details. By keeping the design intuitive and straightforward, we will enable traders to focus on making informed decisions based on the economic events displayed in the dashboard panel. The panel will be arranged as aforementioned and feature the components illustrated below:

With a clear understanding of our objectives, let's dive into the automation process. In the previous article, we focused on mastering the functions of the MQL5 Economic Calendar to effectively retrieve and analyze economic news events. If you haven't already, please refer to that content to ensure you're well-prepared to follow along as we proceed with creating our news dashboard panel. Let's get started!
Setting Up the Panel in MQL5
In this section, we will focus on setting up the dashboard panel by creating the necessary panel elements using MQL5. First, we will need to create functions for the three elements that we will need: the rectangle label, the button, and the text labels. This approach will be immensely beneficial as it allows us to reuse the same functions when creating similar features, eliminating the need to repeat the entire process for each new object. By doing so, we save time and space, making the process quick, and straightforward, and keeping our code snippets concise.
To create the rectangle label, we will create a function that takes ten arguments or parameters. This function will define the properties of the rectangle, such as its position, size, color, and style, enabling us to customize the visual appearance of the label according to our dashboard's design requirements.
//+------------------------------------------------------------------+
//|     Function to create rectangle label                           |
//+------------------------------------------------------------------+

bool createRecLabel(string objName, int xD, int yD, int xS, int yS,
                    color clrBg, int widthBorder, color clrBorder = clrNONE,
                    ENUM_BORDER_TYPE borderType = BORDER_FLAT, ENUM_LINE_STYLE borderStyle = STYLE_SOLID) {

...
}
The function signature illustrates everything. It is a boolean function that has the name "createRecLabel", meaning that it will return two boolean flags, true or false, in case of success or failure respectively. To easily understand its parameters, let us outline and explain them individually below.
- "objName:" This parameter represents the unique name of the rectangle label object. It serves as an identifier for the graphical element being created.
- "xD and yD:" These parameters determine the X and Y distances from the corner where the rectangle label will be positioned. Think of them as the coordinates that define the top-left corner of the rectangle relative to the chart.
- "xS and yS:" These parameters specify the width and height of the rectangle. The "xS" value determines how wide the rectangle will be horizontal, while "yS" controls its vertical height.

- "clrBg:" The "clrBg" parameter represents the background color of the rectangle label. Choose a color that contrasts well with the chart background or complements other elements.
- "widthBorder:" This parameter defines the width of the border around the rectangle. If you want a border, set a positive value; otherwise, use zero for no border.
- "clrBorder:" Optional parameter for the border color. If you want a border, specify a color (e.g., "clrNONE" for no border color).
- "borderType:" Specify the type of border for the rectangle. Options include flat, raised, or other styles. For a simple flat border, use BORDER_FLAT.
- "borderStyle:" If you choose a flat border, this parameter determines the line style (e.g., solid, dashed). Use STYLE_SOLID for a continuous line.
On the function signature, you should have noticed that some of the arguments are already initialized to some value. The initialization value represents the default value that will be assigned to that parameter in case it is ignored during the function call. For example, our default border color is none, meaning that if the color value is not specified during the function call, no color will be applied to the border of our rectangle label.
Inside the function body, housed by the curly brackets ({}), we define our object creation procedures.
// Create a rectangle label object
if (!ObjectCreate(0, objName, OBJ_RECTANGLE_LABEL, 0, 0, 0)) {
  Print(__FUNCTION__, ": failed to create rec label! Error code = ", _LastError);
  return (false); // Return false if object creation fails
}
We start by using an if statement to check whether the object is not created. ObjectCreate function, a boolean which takes 6 arguments, is used. This function creates an object with the specified name, type, and initial coordinates in the specified chart subwindow. First, we specify the chart window, 0 means the object is to be created on the main window. Then, we provide the object name. This is the name that will be uniquely assigned to a specific object. The type of object we want to create is of type OBJ_RECTANGLE_LABEL, signifying an object for creating and designing the custom graphical interface. We then proceed to provide the subwindow, 0 for the current subwindow. Finally, we provide the time and price values as zero (0) since we will not be attaching them to the chart but rather to the chart window coordinates. Pixels are used to set the mapping.
If the creation of the object fails, ultimately the ObjectCreate function returns false, clearly there is no point proceeding, we return with an error. In this case, we inform of the error by printing it to the journal beside the error code and returning false. There could be a previous error, and thus to get the latest error, we need to clear the previous error. This is achieved by calling the "ResetLastError" function, which is an in-built MQL5 function, just before our object creation logic.
ResetLastError(); // Reset any previous error codes
The purpose of the function is to set the value of the predefined variable _LastError, which stores the error code of the last operation that encountered an error, to zero. By calling it, we ensure that any previous error codes are cleared before proceeding with the next operations. This step is essential because it allows us to handle fresh errors independently without interference from previous error states.
If we do not return up to this point, it means we created the object, and thus we can continue with the property update of the object. An in-built function "ObjectSet..." sets the value of the corresponding object property. The object property must be of the datetime, integer, color, boolean, or character type.
// Set properties for the rectangle label
ObjectSetInteger(0, objName, OBJPROP_XDISTANCE, xD); // X distance from the corner
ObjectSetInteger(0, objName, OBJPROP_YDISTANCE, yD); // Y distance from the corner
ObjectSetInteger(0, objName, OBJPROP_XSIZE, xS); // Width of the rectangle
ObjectSetInteger(0, objName, OBJPROP_YSIZE, yS); // Height of the rectangle
ObjectSetInteger(0, objName, OBJPROP_CORNER, CORNER_LEFT_UPPER); // Positioning corner
ObjectSetInteger(0, objName, OBJPROP_BGCOLOR, clrBg); // Rectangle background color
ObjectSetInteger(0, objName, OBJPROP_BORDER_TYPE, borderType); // Border type
ObjectSetInteger(0, objName, OBJPROP_STYLE, borderStyle); // Border style (only if borderType is flat)
ObjectSetInteger(0, objName, OBJPROP_WIDTH, widthBorder); // Border width (only if borderType is flat)
ObjectSetInteger(0, objName, OBJPROP_COLOR, clrBorder); // Border color (only if borderType is flat)
ObjectSetInteger(0, objName, OBJPROP_BACK, false); // Not a background object
ObjectSetInteger(0, objName, OBJPROP_STATE, false); // Not selectable
ObjectSetInteger(0, objName, OBJPROP_SELECTABLE, false); // Not selectable
ObjectSetInteger(0, objName, OBJPROP_SELECTED, false); // Not selected
Let us concentrate on the first property logic.
ObjectSetInteger(0, objName, OBJPROP_XDISTANCE, xD); // X distance from the corner
Here, we use the in-built ObjectSetInteger function and pass the parameters respectively. The parameters are as described below.
- Chart id: This is the chart identifier. "0" refers to the current chart (chart ID). We’re adjusting the properties of an object within this chart.
- Name: This is the name of the object. "objName" represents the unique name assigned to the rectangle label object.
- Property id: This is the ID of the object property and its value can be one of the values of the ENUM_OBJECT_PROPERTY_INTEGER enumeration. OBJPROP_XDISTANCE specifies that we’re modifying the X distance property.
- Property value: This is the value of the property. The value assigned to "xD" determines how far to the right (or left, if negative) the top-left corner of our rectangle label will be positioned horizontally from the left edge of the chart.
Similarly, we set the other properties using the same format. OBJPROP_YDISTANCE configures the Y distance property of the rectangle label. The "yD" value determines how far the top-left corner of the rectangle label will be positioned vertically from the upper edge of the chart. In other words, it controls the vertical placement of the label within the chart area. This sets the Y distance from the corner. The "OBJPROP_XSIZE" and "OBJPROP_YSIZE" sets the width and height of the rectangle respectively.
To position our object, we use the OBJPROP_CORNER property to determine the corner that we want our object to be on the chart window.
ObjectSetInteger(0, objName, OBJPROP_CORNER, CORNER_LEFT_UPPER); // Positioning corner
The property can only be of 4 types:
- CORNER_LEFT_UPPER: Center of coordinates is in the upper left corner of the chart.
- CORNER_LEFT_LOWER: Center of coordinates is in the lower left corner of the chart.
- CORNER_RIGHT_LOWER: Center of coordinates is in the lower right corner of the chart.
- CORNER_RIGHT_UPPER: Center of coordinates is in the upper right corner of the chart.
In a photographic representation, this is what we have.

The rest of the properties are straightforward. We added comments to them for easier understanding. Then, we just redraw the chart using ChartRedraw function to make changes take effect automatically without having to wait for a change in price quotes or chart events.
ChartRedraw(0); // Redraw the chart
Finally, we return true signifying that the creation and update of the object properties was a success.
return (true); // Return true if object creation and property settings are successful
The full function code responsible for the creation of a rectangle object on the chart window is as below.
bool createRecLabel(string objName, int xD, int yD, int xS, int yS,
                    color clrBg, int widthBorder, color clrBorder = clrNONE,
                    ENUM_BORDER_TYPE borderType = BORDER_FLAT, ENUM_LINE_STYLE borderStyle = STYLE_SOLID) {
    ResetLastError(); // Reset any previous error codes

    // Create a rectangle label object
    if (!ObjectCreate(0, objName, OBJ_RECTANGLE_LABEL, 0, 0, 0)) {
        Print(__FUNCTION__, ": failed to create rec label! Error code = ", _LastError);
        return (false); // Return false if object creation fails
    }

    // Set properties for the rectangle label
    ObjectSetInteger(0, objName, OBJPROP_XDISTANCE, xD); // X distance from the corner
    ObjectSetInteger(0, objName, OBJPROP_YDISTANCE, yD); // Y distance from the corner
    ObjectSetInteger(0, objName, OBJPROP_XSIZE, xS); // Width of the rectangle
    ObjectSetInteger(0, objName, OBJPROP_YSIZE, yS); // Height of the rectangle
    ObjectSetInteger(0, objName, OBJPROP_CORNER, CORNER_LEFT_UPPER); // Positioning corner
    ObjectSetInteger(0, objName, OBJPROP_BGCOLOR, clrBg); // Rectangle background color
    ObjectSetInteger(0, objName, OBJPROP_BORDER_TYPE, borderType); // Border type
    ObjectSetInteger(0, objName, OBJPROP_STYLE, borderStyle); // Border style (only if borderType is flat)
    ObjectSetInteger(0, objName, OBJPROP_WIDTH, widthBorder); // Border width (only if borderType is flat)
    ObjectSetInteger(0, objName, OBJPROP_COLOR, clrBorder); // Border color (only if borderType is flat)
    ObjectSetInteger(0, objName, OBJPROP_BACK, false); // Not a background object
    ObjectSetInteger(0, objName, OBJPROP_STATE, false); // Not selectable
    ObjectSetInteger(0, objName, OBJPROP_SELECTABLE, false); // Not selectable
    ObjectSetInteger(0, objName, OBJPROP_SELECTED, false); // Not selected

    ChartRedraw(0); // Redraw the chart

    return (true); // Return true if object creation and property settings are successful
}
To create a button object, the same function approach is used. The code to create a custom button function is as below.
//+------------------------------------------------------------------+
//|     Function to create button                                    |
//+------------------------------------------------------------------+

bool createButton(string objName, int xD, int yD, int xS, int yS,
                  string txt = "", color clrTxt = clrBlack, int fontSize = 12,
                  color clrBg = clrNONE, color clrBorder = clrNONE,
                  string font = "Arial Rounded MT Bold") {
    // Reset any previous errors
    ResetLastError();

    // Attempt to create the button object
    if (!ObjectCreate(0, objName, OBJ_BUTTON, 0, 0, 0)) {
        // Print an error message if creation fails
        Print(__FUNCTION__, ": failed to create the button! Error code = ", _LastError);
        return (false);
    }

    // Set properties for the button
    ObjectSetInteger(0, objName, OBJPROP_XDISTANCE, xD); // X distance from the corner
    ObjectSetInteger(0, objName, OBJPROP_YDISTANCE, yD); // Y distance from the corner
    ObjectSetInteger(0, objName, OBJPROP_XSIZE, xS); // Width of the button
    ObjectSetInteger(0, objName, OBJPROP_YSIZE, yS); // Height of the button
    ObjectSetInteger(0, objName, OBJPROP_CORNER, CORNER_LEFT_UPPER); // Positioning corner
    ObjectSetString(0, objName, OBJPROP_TEXT, txt); // Text displayed on the button
    ObjectSetInteger(0, objName, OBJPROP_COLOR, clrTxt); // Text color
    ObjectSetInteger(0, objName, OBJPROP_FONTSIZE, fontSize); // Font size
    ObjectSetString(0, objName, OBJPROP_FONT, font); // Font name
    ObjectSetInteger(0, objName, OBJPROP_BGCOLOR, clrBg); // Background color
    ObjectSetInteger(0, objName, OBJPROP_BORDER_COLOR, clrBorder); // Border color
    ObjectSetInteger(0, objName, OBJPROP_BACK, false); // Transparent background
    ObjectSetInteger(0, objName, OBJPROP_STATE, false); // Button state (not pressed)
    ObjectSetInteger(0, objName, OBJPROP_SELECTABLE, false); // Not selectable
    ObjectSetInteger(0, objName, OBJPROP_SELECTED, false); // Not selected

    // Redraw the chart to display the button
    ChartRedraw(0);

    return (true); // Button creation successful
}
The differences in the code are that a rectangle object could not take a text in it but a button does include a descriptive text of the button functionality in case it is required. Therefore, for the input parameters, we consider text properties, in our case the text value, color, font size, and font name. The border type for our button is static and thus we get rid of its properties and keep just the border color.
The object type that we create is OBJ_BUTTON, signifying that we create a button graphical object. Its anchor points are set in pixels. The border property that we keep is the border color and replace the rest with the text input properties.
Finally, we need the last element's function which is the text label. The text label eliminates the need for a background object and thus its implementation is quite easier than the rest of the functions. We just need the text and thus we concentrate on the text properties. Its code is as below.
//+------------------------------------------------------------------+
//|     Function to create text label                                |
//+------------------------------------------------------------------+

bool createLabel(string objName, int xD, int yD,
                 string txt, color clrTxt = clrBlack, int fontSize = 12,
                 string font = "Arial Rounded MT Bold") {
    // Reset any previous errors
    ResetLastError();

    // Attempt to create the label object
    if (!ObjectCreate(0, objName, OBJ_LABEL, 0, 0, 0)) {
        // Print an error message if creation fails
        Print(__FUNCTION__, ": failed to create the label! Error code = ", _LastError);
        return (false);
    }

    // Set properties for the label
    ObjectSetInteger(0, objName, OBJPROP_XDISTANCE, xD); // X distance from the corner
    ObjectSetInteger(0, objName, OBJPROP_YDISTANCE, yD); // Y distance from the corner
    ObjectSetInteger(0, objName, OBJPROP_CORNER, CORNER_LEFT_UPPER); // Positioning corner
    ObjectSetString(0, objName, OBJPROP_TEXT, txt); // Text displayed on the label
    ObjectSetInteger(0, objName, OBJPROP_COLOR, clrTxt); // Text color
    ObjectSetInteger(0, objName, OBJPROP_FONTSIZE, fontSize); // Font size
    ObjectSetString(0, objName, OBJPROP_FONT, font); // Font name
    ObjectSetInteger(0, objName, OBJPROP_BACK, false); // Transparent background
    ObjectSetInteger(0, objName, OBJPROP_STATE, false); // Label state (not active)
    ObjectSetInteger(0, objName, OBJPROP_SELECTABLE, false); // Not selectable
    ObjectSetInteger(0, objName, OBJPROP_SELECTED, false); // Not selected

    // Redraw the chart to display the label
    ChartRedraw(0);

    return (true); // Label creation successful
}
The major differences in this code structure from the button's function are the object size and border properties. On the function signature, we get rid of the object sizes as well as the border properties. We define our object type as OBJ_LABEL to signify that we draw labels as per the defined label coordinates to the chart window. Finally, we get rid of the size and border parameters and that is all. As easy as that.
Now that we have the functions that we need to create a Graphical User Interface (GUI), let us use them to create the panel. We will need names of the object and to easily manage the interaction of the object names, it is much easier to define macros.
#define MAIN_REC "MAIN_REC"
We use the #define keyword to define a macro named "MAIN_REC" with the value "MAIN_REC" to easily store our main rectangle base name, instead of having to repeatedly retype the name on every instance we create the level, significantly saving us time and reducing the chances of wrongly providing the name. So basically, macros are used for text substitution during compilation.
Our code will be majorly based on the expert initialization section since we want to create the panel at the initialization instance. Thus, the OnInit event handler will house most of the code structure.
//+------------------------------------------------------------------+
//| Expert initialization function                                   |
//+------------------------------------------------------------------+

int OnInit(){

   ...

   return(INIT_SUCCEEDED);
}
The OnInit function is an event handler that is called on the expert initialization instance to do necessary initializations if necessary.
We then call the function to create a rectangle label by typing its name and providing its parameters.
//--- Create main rectangle label for the dashboard panel
createRecLabel(MAIN_REC,50,50,740,410,clrSeaGreen,1);
Here, our rectangle name is "MAIN_REC" as from the macro definition. Our distance along the x-axis, the time and date scale, from the left upper corner of the chart window is 50 pixels, and the distance along the y-axis, the price scale, is 50 pixels. The width is 740 pixels and the height is 410 pixels respectively. We choose our background color sea green, with a border width of 1, and the rest of the parameters default. To get the pixels to range approximately, you can scale down the chart to 0 and the number of bars between two cross-hair coordinates is equal to the number of pixels on the horizontal scale. In an example, here is what we mean.

The other parameters have been left out, meaning that the default values will be applied automatically. That is, the border type will be flat, and the line style will be a continuous solid line. Upon compilation, this is what we currently have.

To create the subframes, we again declare the respective macros for the same explicitly.
#define SUB_REC1 "SUB_REC1"
#define SUB_REC2 "SUB_REC2"
Then we call the same function to create the subframes. We want our frames to be inside the base panel's frame and thus will require we use a slightly different color. To accomplish this, we used a white and green color and a margin of 3 and 5 pixels.
//--- Create sub-rectangle labels within the main panel for different sections
createRecLabel(SUB_REC1,50+3,50+30,740-3-3,410-30-3,clrWhite,1);
createRecLabel(SUB_REC2,50+3+5,50+30+50+27,740-3-3-5-5,410-30-3-50-27-10,clrGreen,1);
Here, we are setting up two additional sub-sections, "SUB_REC1" and "SUB_REC2", within the main dashboard panel to help organize and separate the content visually. Using the "createRecLabel" function, we position "SUB_REC1" by adding an offset of 3 pixels from the left and right edges and 30 pixels from the top of the main rectangle "MAIN_REC"—effectively creating a framed section inside the main panel. We define its width as "740-3-3" to fit within the reduced margins and its height as "410-30-3" to leave space above and below, allowing it to nest neatly within the main rectangle. This sub-section is set to a white color, establishing a neutral background that contrasts with the main panel’s sea green color to enhance visual clarity.
Next, we use "createRecLabel" to add "SUB_REC2", an additional section within "SUB_REC1", and position it with finer offsets for an organized, layered layout. To achieve this, we set the starting X-coordinate as "50+3+5", positioning it further within "SUB_REC1" to visually define it as a distinct area inside this sub-section. We set the Y-coordinate as "50+30+50+27" to account for the vertical offsets of both the main and first sub-rectangle. The width, "740-3-3-5-5", fits "SUB_REC2" precisely within the remaining horizontal space, while the height, "410-30-3-50-27-10", allows for a balanced and separated region. Setting "SUB_REC2" to green adds a strong contrast, indicating it as an area that will display critical data. This careful layering of rectangles is essential to establishing a structured and visually navigable panel for the dashboard. Upon compilation, we get the following results:

Up to this point, the setup of our frames, margins, and boundaries for our panel is complete. We then proceed to add the other panel utilities, their properties, and effects. To begin with, let us give a title to the panel.
#define HEADER_LABEL "HEADER_LABEL"

//---

//--- Create the header label with text "MQL5 Economic Calendar"
createLabel(HEADER_LABEL,50+3+5,50+5,"MQL5 Economic Calendar",clrWhite,15);
Here, we define the label identifier "HEADER_LABEL" with the value "HEADER_LABEL" for consistency and ease of referencing this specific label throughout our code. This label will serve as the header for our dashboard panel, prominently displaying the title "MQL5 Economic Calendar".
Then, using the "createLabel" function, we create the header label at the specified position. We set its X-coordinate as "50+3+5", positioning it slightly to the right of the main panel’s edge to ensure it aligns within the "SUB_REC1" rectangle and does not overlap with any margins. The Y-coordinate, "50+5", places it a few pixels below the top edge of the main rectangle, ensuring readability. For visibility, we set the text color to white with a font size of "15", creating a bold and noticeable header that marks the purpose of the dashboard. This header will anchor the dashboard's visual design, immediately communicating its purpose to users. Here is what we get.

That was a success. We can now proceed to create the panel headers. For this, we will use the simplest method, which is just defining the header titles, and placing them in an array, and then using a loop to place them dynamically since they are in just one row. However, we will also have to define the button sizes differently since they will have varying widths because of the individual header lengths. Below is the logic we will use to achieve that.
string array_calendar[] = {"Date","Time","Cur.","Imp.","Event","Actual","Forecast","Previous"};
int buttons[] = {80,50,50,40,281,60,70,70};
We define two arrays to organize the labels and dimensions of buttons in the dashboard. The first array, "array_calendar", contains strings for each column header we will display, specifying the type of information: "Date", "Time", "Cur." (Currency), "Imp." (Impact/Importance), "Event", "Actual", "Forecast", and "Previous". Each string represents a label for a data category, helping us understand what each section of the dashboard will display.
The second array, "buttons", contains integers representing the widths (in pixels) for each button associated with the respective columns in "array_calendar". These widths are tailored to each data type to ensure the layout remains aligned and visually organized. For example, "80" pixels for the "Date" column accommodate longer date formats, while narrower widths like "50" pixels are set for "Time" and "Cur." columns, which require less space. Together, these arrays help streamline the creation of the dashboard's column headers and buttons, setting a structured foundation for further User Interface (UI) elements. From here, we then can use a loop to create the headers dynamically.
#define ARRAY_CALENDAR "ARRAY_CALENDAR"

//---

//--- Initialize starting x-coordinate for button positioning
int startX = 59;

//--- Loop through the array_calendar elements to create buttons
for (int i=0; i<ArraySize(array_calendar); i++){
   //--- Create each button for calendar categories
   createButton(ARRAY_CALENDAR+IntegerToString(i),startX,132,buttons[i],25,array_calendar[i],clrWhite,13,clrGreen,clrNONE,"Calibri Bold");
   startX += buttons[i]+3; //--- Update x-coordinate for the next button
}
Here, we initialize and position buttons based on the "array_calendar" elements to label each category in our dashboard panel. First, we define the identifier "ARRAY_CALENDAR" for the calendar button series. Then, we set "startX" to "59" as the initial x-coordinate, which will position the first button horizontally on the panel.
We then use a for loop to iterate through each item in "array_calendar" to create a button. For each iteration, we call the "createButton" function and pass in a unique ID for each button by appending the loop index to "ARRAY_CALENDAR". This ensures every button ID is unique, referencing categories such as "Date", "Time", "Cur.", etc. We specify the "startX" position and use values from "buttons" to define each button’s width, ensuring alignment with the respective data category. Each button also receives styling properties, including a font color (white), font size ("13"), and background colors (green for the button and none for the border), set in the "Calibri Bold" font. After creating each button, we adjust "startX" by adding the width of the current button plus a margin of "3" pixels, spacing out the buttons uniformly for the next iteration. Upon compilation, we have the following output.

After creating the headers, we now need to create the other subsection for displaying the time, number of identified news events, and the impact levels. We will first begin by getting the news events from the previous part of the series.
//--- Declare variables for tracking news events and status
int totalNews = 0;
bool isNews = false;
MqlCalendarValue values[]; //--- Array to store calendar values

//--- Define start and end time for calendar event retrieval
datetime startTime = TimeTradeServer() - PeriodSeconds(PERIOD_H12);
datetime endTime = TimeTradeServer() + PeriodSeconds(PERIOD_H12);

//--- Set a specific country code filter (e.g., "US" for USD)
string country_code = "US";
string currency_base = SymbolInfoString(_Symbol,SYMBOL_CURRENCY_BASE);

//--- Retrieve historical calendar values within the specified time range
int allValues = CalendarValueHistory(values,startTime,endTime,NULL,NULL);

//--- Print the total number of values retrieved and the array size
Print("TOTAL VALUES = ",allValues," || Array size = ",ArraySize(values));
This gives us the historical event values as retrieved from the MQL5 Economic Calendar, and thus instead of just printing them, we can display them on the dashboard. Here is the logic we apply.
#define TIME_LABEL "TIME_LABEL"

//---

//--- Create label displaying server time and total number of news events found
createLabel(TIME_LABEL,70,85,"Server Time: "+TimeToString(TimeCurrent(),
           TIME_DATE|TIME_SECONDS)+"   |||   Total News: "+
           IntegerToString(allValues),clrBlack,14,"Times new roman bold");
Here, we create a label to display the current server time along with the total number of news events retrieved. First, we define the identifier "TIME_LABEL" to uniquely reference this label within our dashboard panel.
Next, we call the "createLabel" function to generate the label itself. We specify the label's position by providing the coordinates "70" and "85", which dictate where the label will appear on the panel. The text for the label is dynamically constructed using the TimeToString function, which formats the current server time retrieved by the TimeCurrent function in the date and seconds format. We concatenate this formatted time with the string "||| Total News: " and convert the variable "allValues", which contains the count of news events, into a string using the IntegerToString function. This creates a comprehensive label that shows both the server time and the total number of news events found. We style the label with black color, a font size of 14, and use the "Times New Roman bold" font for clear visibility. Via the same logic, we create the impact label as well.
#define IMPACT_LABEL "IMPACT_LABEL"

//---

//--- Create label for displaying "Impact" category header
createLabel(IMPACT_LABEL,70,105,"Impact: ",clrBlack,14,"Times new roman bold");
Upon compilation, we get the following output.

That was a success. We now need to graduate to displaying the respective impact buttons with respective labels and colors, so that users can know what each impact level identifies as.
//--- Define labels for impact levels and size of impact display areas
string impact_labels[] = {"None", "Low", "Medium", "High"};
int impact_size = 100;

//--- Loop through impact levels to create buttons for each level
for (int i=0; i<ArraySize(impact_labels); i++){
   color impact_color = clrBlack, label_color = clrBlack; //--- Default colors for label and button

   //--- Assign color based on impact level
   if (impact_labels[i] == "None"){label_color = clrWhite;}
   else if (impact_labels[i] == "Low"){impact_color = clrYellow;}
   else if (impact_labels[i] == "Medium"){impact_color = clrOrange;}
   else if (impact_labels[i] == "High"){impact_color = clrRed;}

   //--- Create button for each impact level
   createButton(IMPACT_LABEL+string(i),140+impact_size*i,105,impact_size,25,impact_labels[i],label_color,12,impact_color,clrBlack);
}
Here, we define the labels for the different impact levels associated with economic events and the size of the display areas for these impact indicators. First, we declare an array called "impact_labels" containing strings that represent the various impact levels: "None", "Low", "Medium", and "High". Additionally, we initialize an integer variable "impact_size" with a value of 100 which determines the width of the buttons that will be created for each impact level.
Next, we enter a loop that iterates over the "impact_labels" array, utilizing the ArraySize function to determine the total number of impact levels. Within this loop, we first set the default colors for the button and label using the black color. We then use conditional statements to assign specific colors based on the current impact level. If the impact level is "None" we change the "label_color" to white. If the level is "Low", we set "impact_color" to yellow. For "Medium" we assign "impact_color" orange, and for "High" we designate "impact_color" as red". Finally, we call the "createButton" function to generate a button for each impact level, positioning it using a dynamic x-coordinate calculated with "140 + impact_size * i," maintaining a fixed y-coordinate of 105, and providing the dimensions and colors accordingly. Here is the current milestone.

That was a success. We can now move on to adding the actual calendar data to the dashboard. However, before that, we will need to partition the second subframe so that we can give the panel a more professional look, rather than just placing data in it. We achieve that via the following logic.
//--- Limit the total number of values to display
int valuesTotal = (allValues <= 11) ? allValues : 11;

//--- Initialize starting y-coordinate for displaying news data
int startY = 162;

//--- Loop through each calendar value up to the maximum defined total
for (int i = 0; i < valuesTotal; i++){

   //--- Set alternating colors for each data row holder
   color holder_color = (i % 2 == 0) ? C'213,227,207' : clrWhite;

   //--- Create rectangle label for each data row holder
   createRecLabel(DATA_HOLDERS+string(i),62,startY-1,716,26,holder_color,1,clrBlack);

   //--- Increment y-coordinate for the next row of data
   startY += 25;
   Print(startY); //--- Print current y-coordinate for debugging
}
We limit the total number of values to display in our dashboard by defining an integer variable called "valuesTotal". We use a conditional (ternary) operator to check if "allValues" is less than or equal to "11". If it is, we set "valuesTotal" to "allValues"; otherwise, we set it to "11". This approach will ensure that we do not attempt to display more than "11" news events, keeping our dashboard tidy and manageable.
Next, we initialize an integer variable "startY" with a value of "162", which serves as the starting y-coordinate for positioning the news data on the panel. We then enter a loop that iterates from "0" to "valuesTotal", effectively processing each calendar value we intend to display. Within this loop, we define the color for each row holder using an alternating pattern based on the current index "i". If "i" is even, we set "holder_color" to a light grey color represented by "C'213,227,207'"; if "i" is odd, we set it to white. After determining the color, we call the "createRecLabel" function to generate a rectangle label for each data row holder, positioned at "62" on the x-axis, "startY - 1" on the y-axis, with a width of "716", a height of "26", and a border black color. Finally, we increment "startY" by "25" to adjust the y-coordinate for the next row of data, ensuring that each entry is displayed sequentially. For debugging purposes, we print the current "startY" value, allowing us to track the vertical positioning of each data row as it is created. Here is the current milestone.

You might have noticed that we used a macro variable "DATA_HOLDERS" during the creation of the holder subframes. Here is how we have defined it.
#define DATA_HOLDERS "DATA_HOLDERS"
#define ARRAY_NEWS "ARRAY_NEWS"
We have also defined the "ARRAY_NEWS" macro to ease the creation of respective data that is to be mapped inside the data holders concerning the column headers. To fill in the data, we will require that for each holder selected, we iterate via all the data for a specific event value and get its data, which we will display. This will thus be done inside the first loop and will have the following logic.
//--- Initialize starting x-coordinate for each data entry
int startX = 65;

//--- Loop through calendar data columns
for (int k=0; k<ArraySize(array_calendar); k++){

   MqlCalendarEvent event; //--- Declare event structure
   CalendarEventById(values[i].event_id,event); //--- Retrieve event details by ID

   MqlCalendarCountry country; //--- Declare country structure
   CalendarCountryById(event.country_id,country); //--- Retrieve country details by event's country ID

   //--- Print event details for debugging
   Print("Name = ",event.name,", IMP = ",EnumToString(event.importance),", COUNTRY = ",country.name,", TIME = ",values[i].time);

   //--- Skip event if currency does not match the selected country code
   // if (StringFind(_Symbol,country.currency) < 0) continue;

   //--- Prepare news data array with time, country, and other event details
   string news_data[ArraySize(array_calendar)];
   news_data[0] = TimeToString(values[i].time,TIME_DATE); //--- Event date
   news_data[1] = TimeToString(values[i].time,TIME_MINUTES); //--- Event time
   news_data[2] = country.currency; //--- Event country currency

   //--- Determine importance color based on event impact
   color importance_color = clrBlack;
   if (event.importance == CALENDAR_IMPORTANCE_LOW){importance_color=clrYellow;}
   else if (event.importance == CALENDAR_IMPORTANCE_MODERATE){importance_color=clrOrange;}
   else if (event.importance == CALENDAR_IMPORTANCE_HIGH){importance_color=clrRed;}

   //--- Set importance symbol for the event
   news_data[3] = ShortToString(0x25CF);

   //--- Set event name in the data array
   news_data[4] = event.name;

   MqlCalendarValue value; //--- Declare calendar value structure
   CalendarValueById(values[i].id,value); //--- Retrieve actual, forecast, and previous values

   //--- Populate actual, forecast, and previous values in the news data array
   news_data[5] = DoubleToString(value.GetActualValue(),3);
   news_data[6] = DoubleToString(value.GetForecastValue(),3);
   news_data[7] = DoubleToString(value.GetPreviousValue(),3);

   //--- Create label for each news data item
   if (k == 3){
      createLabel(ARRAY_NEWS+IntegerToString(i)+" "+array_calendar[k],startX,startY-(22-12),news_data[k],importance_color,22,"Calibri");
   }
   else {
      createLabel(ARRAY_NEWS+IntegerToString(i)+" "+array_calendar[k],startX,startY,news_data[k],clrBlack,12,"Calibri");
   }

   //--- Increment x-coordinate for the next column
   startX += buttons[k]+3;
}
Here, we initialize an integer variable called "startX" with a value of 65, which will serve as the starting x-coordinate for positioning each data entry related to calendar events. We then enter a loop that iterates through each column in the "array_calendar" using the index "k". Within this loop, we declare a structure variable "event" of type MqlCalendarEvent, which will be used to hold the details of a specific calendar event. We retrieve the event details by calling the CalendarEventById function, passing the event ID from the "values" array, and storing the results in "event".
Next, we declare another structure variable "country" of type MqlCalendarCountry to hold information about the country associated with the calendar event. We use the CalendarCountryById function to populate "country" with details based on the event's country ID. For debugging purposes, we print out key event details such as the event's name, its importance level (converted to a string using EnumToString function), the name of the country, and the event time stored in "values[i].time".
We then prepare a string array called "news_data" with a size equal to that of "array_calendar" to store the information related to the event. The first element of "news_data" is set to the event date, formatted as a string using the TimeToString function with the "TIME_DATE" flag. The second element captures the event time, formatted using the "TIME_MINUTES" flag. The third element stores the currency of the event's country.
Next, we determine the importance color for the event based on its impact level, initializing a variable "importance_color" to black. We check the value of "event.importance", and based on its value (low, moderate, or high), we assign the appropriate color: yellow for low, orange for moderate, and red for high.
We also set the fourth element of "news_data" to a symbol representing the importance level of the event, using "ShortToString(0x25CF)" to create a filled circle. The fifth element is assigned the event name retrieved from "event.name".
To fetch actual, forecast, and previous values for the event, we declare another structure variable called "value" of type MqlCalendarValue and use the CalendarValueById function to populate this structure based on the event's ID stored in "values[i].id". The sixth, seventh, and eighth elements of "news_data" are populated with the actual, forecast, and previous values, respectively, formatted to three decimal places using the DoubleToString function.
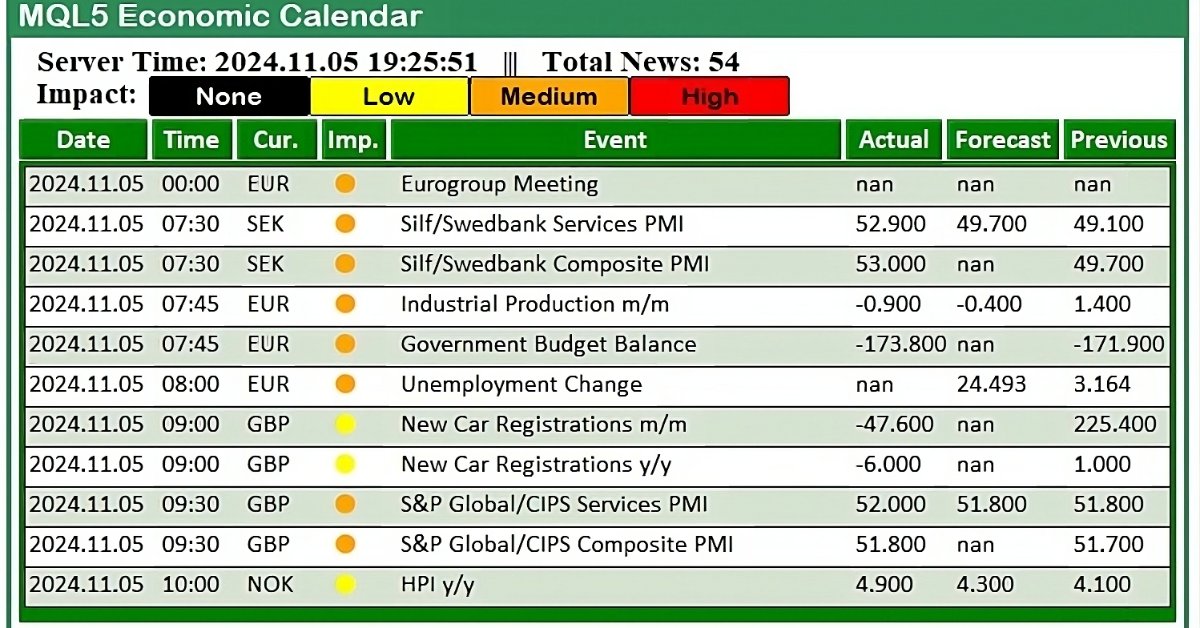
Finally, we create a label for each news data item using the "createLabel" function. If "k" equals "3", we apply the importance color; otherwise, we default to black color. The x-coordinate for each label is determined by "startX", which we then increment by adding the button width from the "buttons" array, ensuring that each column of data is positioned correctly for clear display. Upon compilation, we get the following output.

That was a success. We now created an MQL5 Economic Calendar dashboard that displays the news data on the chart for easier referencing. As for the current milestone, we just get all the data. In the next parts of the series, we will improve the panel by integrating filters, integrating real-time data updates, and using the news data for trading purposes.
Conclusion
In conclusion, we have successfully laid the foundation for our MQL5 Economic Calendar by constructing an interactive dashboard panel that displays crucial economic events in a user-friendly format. By implementing features such as calendar data retrieval, visual categorization of events based on their importance, and intuitive labeling, we can stay informed about significant market movements. This initial setup not only enhances the user experience but also provides a solid base for further enhancements that will take our dashboard to the next level.
In the upcoming parts of this series, we will integrate additional functionalities, such as news filters to help us focus on the most relevant information for our strategies in MQL5. We will also implement real-time updates to ensure that our panel reflects the latest economic data as it becomes available. Additionally, we will focus on making the panel responsive, allowing it to adapt seamlessly to different screen sizes and user interactions. Ultimately, we aim to harness this data to facilitate informed trading decisions, transforming our economic calendar into a powerful tool for traders seeking to capitalize on market volatility. Keep tuned.
Warning: All rights to these materials are reserved by MetaQuotes Ltd. Copying or reprinting of these materials in whole or in part is prohibited.
This article was written by a user of the site and reflects their personal views. MetaQuotes Ltd is not responsible for the accuracy of the information presented, nor for any consequences resulting from the use of the solutions, strategies or recommendations described.

- Free trading apps
- Over 8,000 signals for copying
- Economic news for exploring financial markets
You agree to website policy and terms of use