GARCH Improved Nelder Mead MT5
- Indikatoren
-
Young Ho Seo
 Harmonic Pattern Indicator - Repainting + Japanese Candlestick Pattern Scanner + Automatic Channel + Many more
https://www.mql5.com/en/market/product/4488 - Version: 3.3
- Aktualisiert: 5 Dezember 2021
Einführung in den GARCH-Indikator
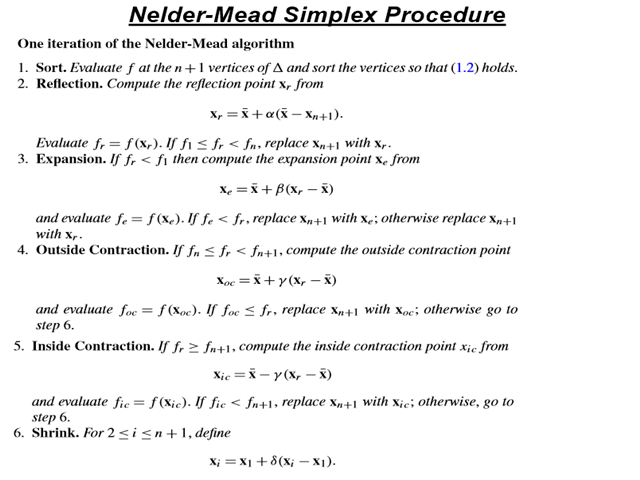
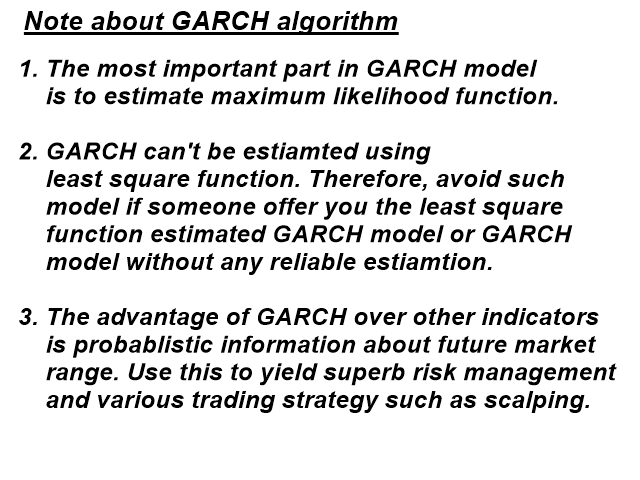
GARCH ist die Abkürzung für Generalized Autoregressive Conditional Heteroskedasticity (verallgemeinerte autoregressive bedingte Heteroskedastizität) und ist ein in der Finanzbranche häufig verwendetes Volatilitätsvorhersagemodell. Das GARCH-Modell wurde erstmals 1986 von dem dänischen Wirtschaftswissenschaftler Tim Peter Bollerslev vorgestellt. Der Nobelpreisträger von 2003, Robert F. Engle, leistete mit Tims Arbeit ebenfalls einen wichtigen Beitrag zur Verfeinerung des GARCH-Modells. Unser GARCH-INM-Prädiktor übernahm die ursprüngliche Methode von Nelder Mead zur Erstellung von GARCH-Modellen. Die ursprüngliche Nelder Mead-Methode verfehlt jedoch gelegentlich die Konvergenz, weshalb wir die ursprüngliche Nelder Mead-Methode verbessert haben, indem wir einen ARMA-Zwischenschritt (Autoregressive Moving Average) vor dem GARCH-Schritt eingefügt haben.
Wie man den GARCH-Indikator verwendet
Der Zweck des GARCH INM Prädiktors ist es, die Handelsleistung zu verbessern. Hier sind einige Tipps.
-
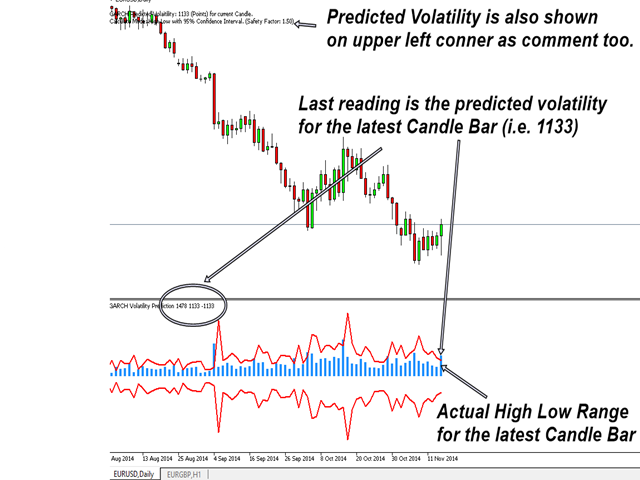
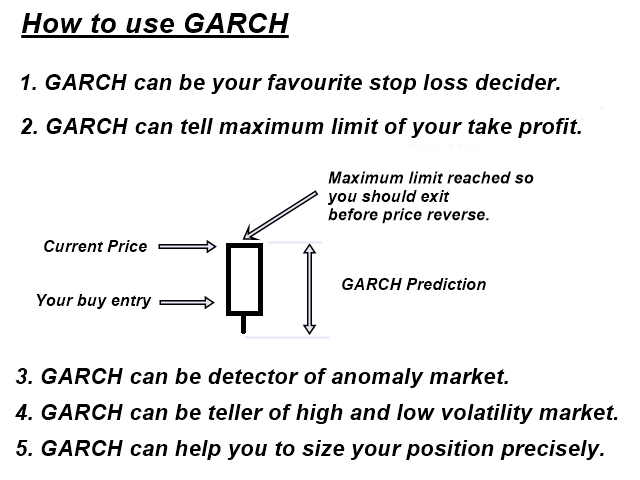
Unser GARCH INM-Prädiktor verwendet Punkte als Basiseinheit. Daher kann die vorhergesagte Volatilität dem Händler eine skalierbare Vorstellung von der zukünftigen Volatilität vermitteln. Wenn GARCH beispielsweise 1120 Punkte (112 Pips) für die aktuelle Kerze mit einem Konfidenzintervall von 95 % vorhersagt, dann können Sie davon ausgehen, dass die Wahrscheinlichkeit, dass der aktuelle Markt innerhalb des Bereichs von 112 Pips bleibt, bei 95 % liegt.
-
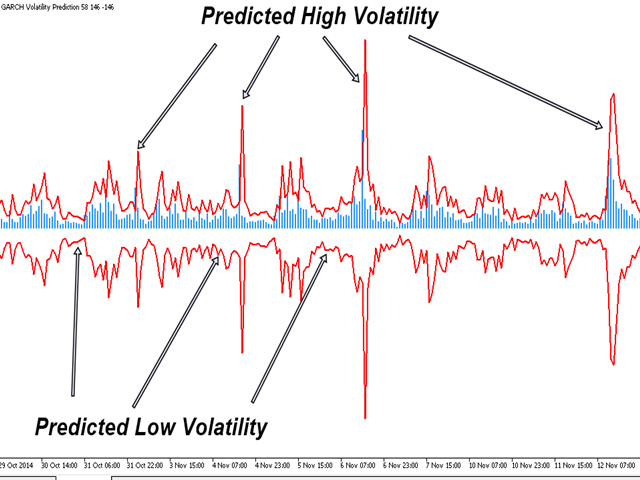
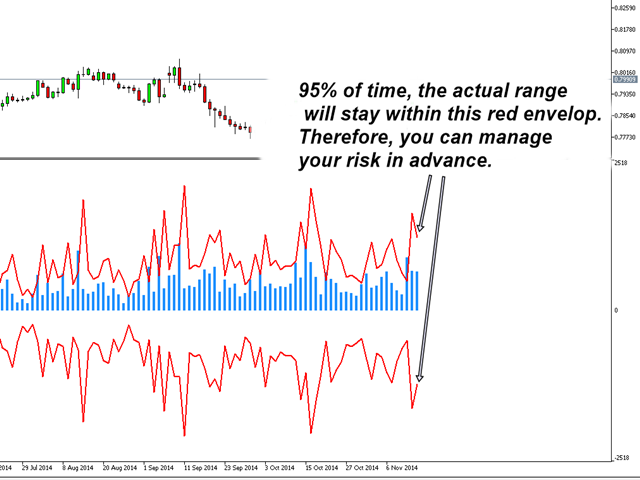
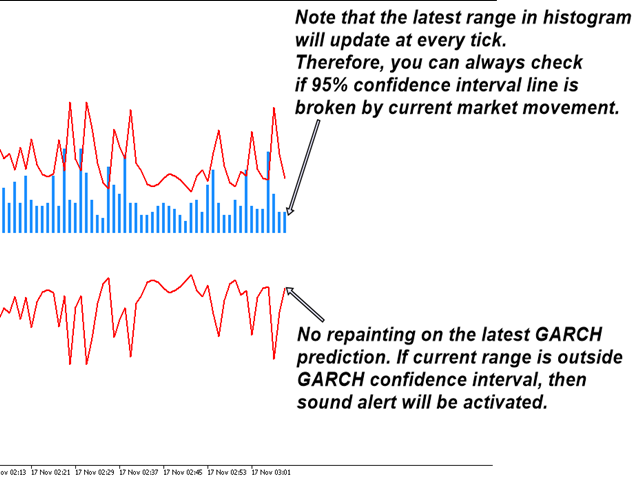
Die Erkennung von Marktanomalien ist eine weitere wichtige Funktion von GARCH. Wenn sich die Preisspanne für den aktuellen Markt außerhalb der vorhergesagten Volatilität (95 % Konfidenzintervall) bewegt, dann ist dies ein anomales Ereignis mit einer Wahrscheinlichkeit von 5 %, dass es auftritt.
-
Die Volatilität ist sehr eng mit dem Trend verbunden. Eine steigende Volatilität zeigt oft den Beginn eines Trends an. Wenn Sie mit unserem GARCH INM Prädiktor einen Markt mit Schwankungsbreite herausfiltern, können Sie auf einen Trendmarkt setzen.
Mathematische Beschreibung von GARCH
Der GARCH-INM-Prädiktor verwendet das Standardmodell GARCH (1, 1). Seine mathematische Beschreibung besteht einfach darin, die Varianz der Zeitreihe mit der vorherigen Varianz und der vorherigen quadrierten Rendite in Beziehung zu setzen. In mathematischer Notation würde dies lauten:
Varianz zum Zeitpunkt t = omega + alpha * quadrierte Rendite zum Zeitpunkt t-1 + beta * Varianz zum Zeitpunkt t-1
Wobei die Zeitreihenrendite y bei t = Mittelwert + Fehler und t = Zeit
- AnzahlOfObs: Anzahl der Beobachtungen (Datenpunkte), die für die Berechnung verwendet werden sollen. Wir empfehlen mindestens 1000 Datenpunkte.
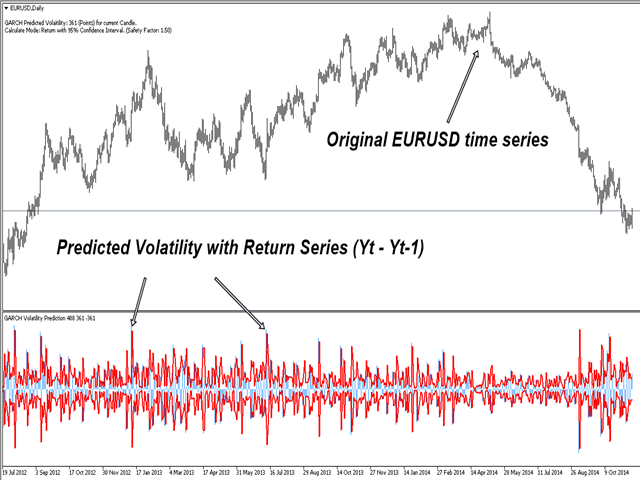
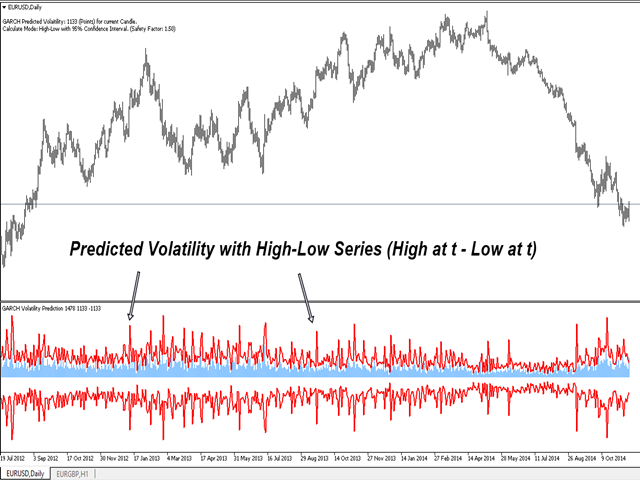
- UseHighLow: Bei Verwendung des High-Low-Modus (true) wird der Bereich anhand von High - Low berechnet. Wenn UseHighLow = false ist, wird die Spanne zwischen Close und vorherigem Close berechnet. Wir empfehlen die Verwendung der Standardeinstellung für Ihren Handel.
- KonfidenzIntervall: Konfidenzintervall für die GARCH-Vorhersage. Wir bieten 90%, 95% und 99% Konfidenzintervall. Dieses Konfidenzintervall gibt Ihnen ein probabilistisches Gefühl für die zukünftige Marktspanne.
- SicherheitsFaktor: Der Sicherheitsfaktor wird für die zusätzliche Sicherheit der Handelsoperationen hinzugefügt. Der Sicherheitsfaktor sollte größer als 1 sein. Wenn der Sicherheitsfaktor = 1 ist, dann entspricht die vorhergesagte Volatilität der ursprünglichen GARCH-Volatilität. Wenn der Sicherheitsfaktor = 1,5 ist, hat die vorhergesagte Volatilität eine Sicherheitsmarge von 50 % gegenüber der ursprünglichen GARCH-Volatilität.
Der Benutzer kann den Sicherheitsfaktor zwischen 1,0 und 3,0 einstellen, um ihn für seinen Handel optimal zu nutzen. Wenn der GARCH-Prognose-Umschlag den Preis überhaupt nicht berührt, können Sie den Sicherheitsfaktor verringern. Wenn der GARCH-Prognoseumschlag den Preis zu oft berührt, können Sie den Sicherheitsfaktor erhöhen. Die Hauptidee besteht darin, die GARCH-Vorhersage so abzustimmen, dass ein extremer bullischer oder bearischer Schock auf dem Markt erkannt wird. Verwenden Sie bei einem solchen Schock den Mean-Reversion-Trading-Stil, um zu profitieren.
Handelsstrategie-Leitfaden
Eine detaillierte Anleitung zur Verwendung des Volatilitätsindikators finden Sie unter dem unten stehenden Link. Wir empfehlen Ihnen, diesen Artikel zu lesen, bevor Sie diesen Volatilitätsindikator für Ihren Handel verwenden.
Leitfaden für Volatilitätsindikator
Außerdem finden Sie hier die Handelsstrategie für Forex.
Leitfaden für Volume Spread Analysis
Leitfaden für Harmonic Pattern Detection Indikator
Leitfaden für den Momentum-Indikator
Leitfaden für den Angebots-Nachfrage-Indikator
Leitfaden für Dreiecksmuster, fallende Keilmuster, steigende Keilmuster und Kanäle
Leitfaden für den Elliott-Wellen-Indikator
Wichtiger Hinweis
Dies ist ein Produkt von der Stange. Daher akzeptieren wir keine Änderungen oder Anpassungswünsche für dieses Produkt. Darüber hinaus bieten wir keine Code-Bibliothek oder Unterstützung für Ihre Codierung für dieses Produkt.


User didn't leave any comment to the rating