Fibonacci Volatility Indicator MT5
- Indikatoren
-
Young Ho Seo
 Harmonic Pattern Indicator - Repainting + Japanese Candlestick Pattern Scanner + Automatic Channel + Many more
https://www.mql5.com/en/market/product/4488 - Version: 6.8
- Aktualisiert: 30 Juli 2020
- Aktivierungen: 5
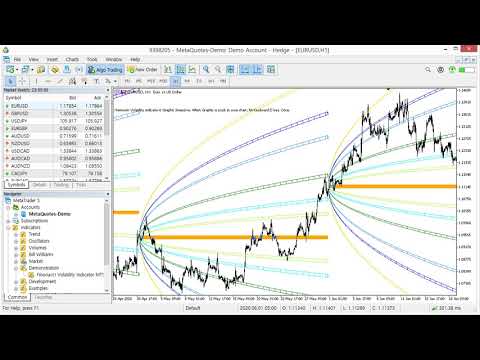
Einführung in den Fibonacci-Volatilitätsindikator
Der Volatilitätsindikator kann Ihnen helfen, einen statistischen Vorteil für Ihren Handel zu erkennen. Insbesondere, wenn Sie mit Price Action und Price Patterns handeln, empfehlen wir Ihnen, den Volatilitätsindikator zusammen mit Ihrer Strategie zu verwenden. Der Fibonacci Volatilitätsindikator kombiniert die Marktvolatilität mit der Fibonacci-Analyse, um Ihnen einen fortgeschrittenen Volatilitätsindikator zu bieten.
Wichtigste Merkmale
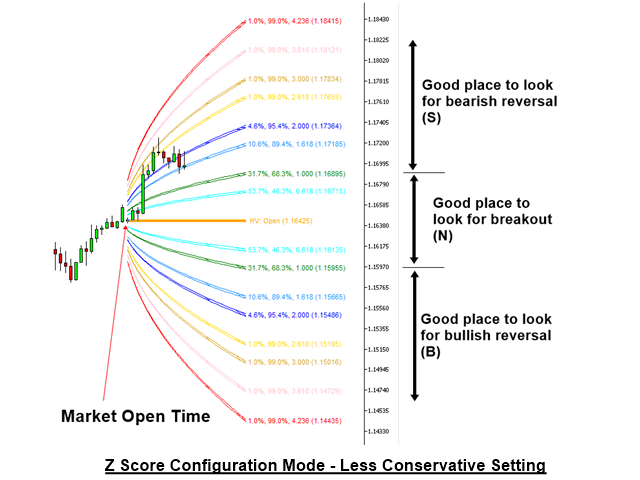
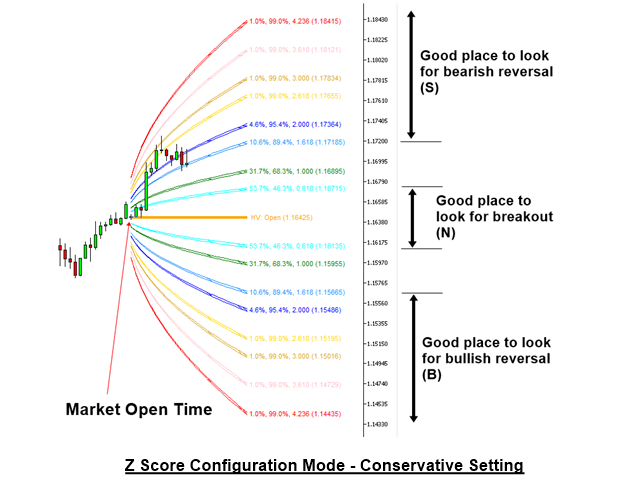
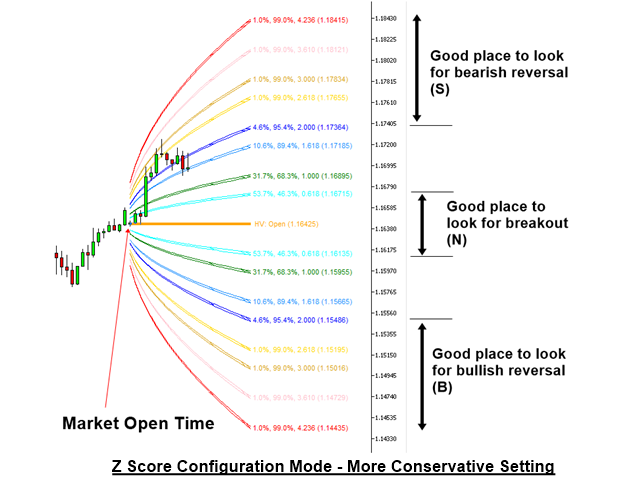
- Fibonacci-Volatilität im Z-Score-Konfigurationsmodus
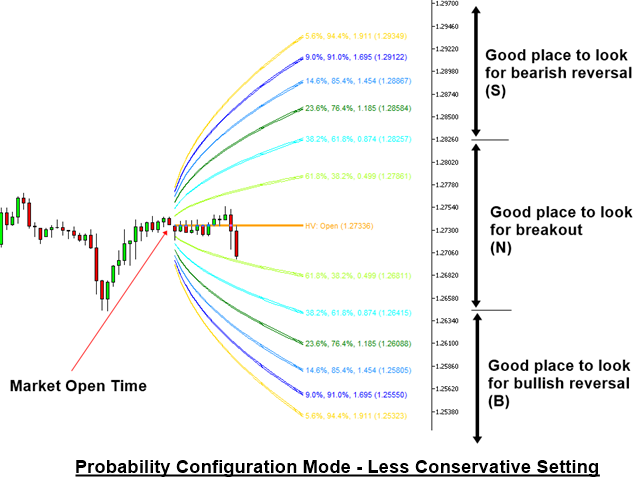
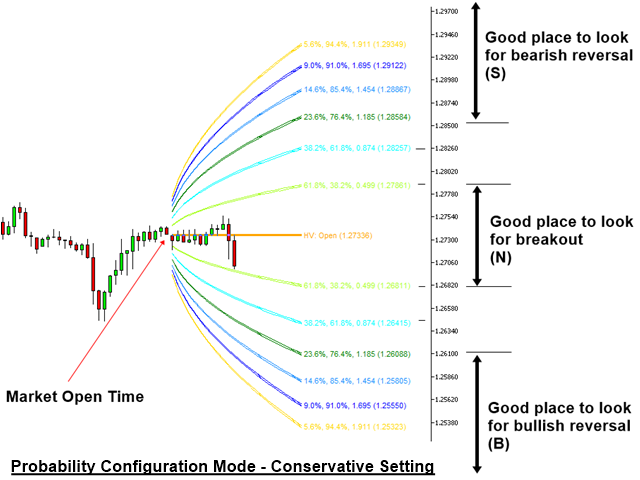
- Fibonacci-Volatilität im Wahrscheinlichkeits-Konfigurationsmodus
- Täglicher, wöchentlicher, monatlicher und jährlicher Volatilitätsmodus
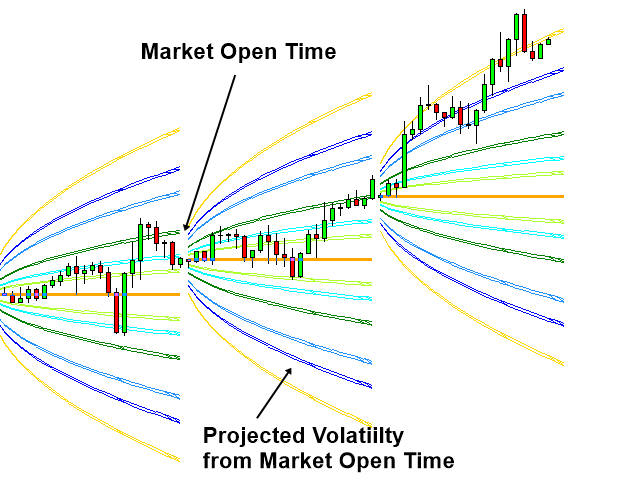
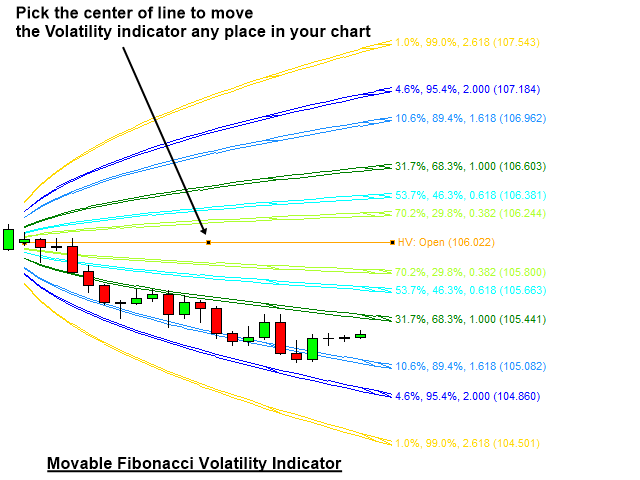
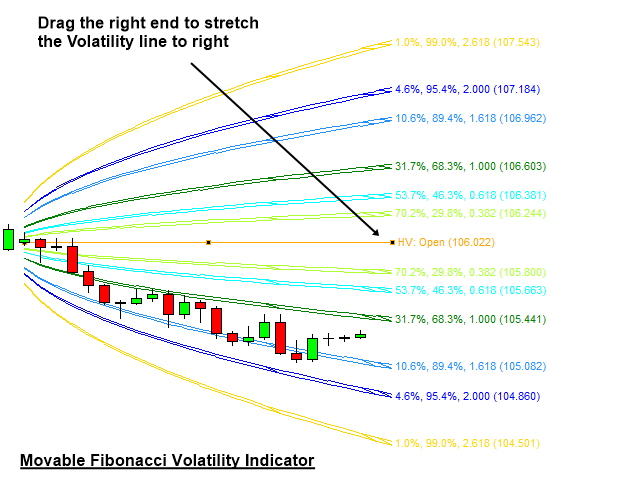
- Bewegliche Volatilität - Nützlich für die Analyse geometrischer Muster
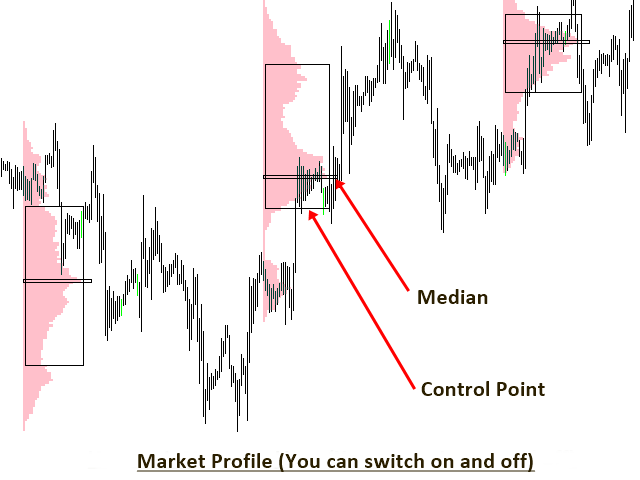
- Marktprofil-Analyse
- Unterstützung und Widerstand durch Volatilitätsprojektion
- Warnung bei niedriger Volatilität
- Warnung für hochvolatilen Bereich
Leitfaden zur Handelsstrategie
Eine detaillierte Anleitung zur Verwendung des Volatilitätsindikators finden Sie unter dem unten stehenden Link. Wir empfehlen Ihnen dringend, diesen Artikel zu lesen, bevor Sie den Volatilitätsindikator für Ihren Handel verwenden.
https://www.mql5.com/en/blogs/post/750389
Einstellungen
Um den Z-Score-Konfigurationsmodus zu verwenden, setzen Sie "Z-Score-Konfiguration verwenden" = true. Wenn Sie "Use Z Score Configuration" = false einstellen, dann verwendet der Indikator den Wahrscheinlichkeits-Konfigurationsmodus. Der Wahrscheinlichkeitskonfigurationsmodus ist der gleiche wie der Harmonic Volatility Indicator. Die folgenden Eingaben steuern die globalen Einstellungen des Indikators.
- Anzahl der täglichen Sitzungen: 0 bedeutet, dass der Indikator keine täglichen Volatilitätslinien zeichnen wird. 1 bedeutet, dass der Indikator einen Satz von täglichen Volatilitätslinien zeichnet. Sie können mehrere Sitzungen mit täglichen Volatilitätslinien erstellen. Allerdings können zu viele Sitzungen Ihren MetaTrader verlangsamen. Verwenden Sie daher die richtige Anzahl für Ihren Computer.
- Anzahl der wöchentlichen Sitzungen: Dies ist dasselbe wie die Eingabe der täglichen Sitzung.
- Anzahl der monatlichen Sitzungen: Entspricht der Eingabe für die tägliche Sitzung.
- Startindex: 0 ist der Standardwert. Bei 0 beginnt der Indikator mit der Sitzung 0 zu zeichnen.
- Weißes Diagramm verwenden: True bedeutet, dass Sie ein weißes Hintergrunddiagramm verwenden werden.
- Individuelle Linienfarbe verwenden: Wenn false, dann wird das globale Farbschema verwendet. Wenn true, können Sie ein individuelles Farbschema verwenden.
- Tägliche Linienfarbe: Farbe der täglichen Linie
- Wöchentliche Linienfarbe: Farbe der wöchentlichen Linie
- Farbe der monatlichen Linie: Farbe der monatlichen Linie
- Wahrscheinlichkeitslinien anzeigen: Ein- und Ausschalten der gekrümmten Wahrscheinlichkeitslinie
- Endgültige Projektion anzeigen: Ein- und Ausschalten der Handelszonenbox
- Endgültige Projektion Marge: Größe der Box
Eingabeeinstellungen für jede Wahrscheinlichkeitslinie
Jede Wahrscheinlichkeitslinie kann nach Ihren Wünschen ein- und ausgeschaltet werden. Sie haben für neun Linien die gleiche Einstellung.
- Verwenden Sie Zeile 1: Sie können die Linie ein- und ausschalten
- Wahrscheinlichkeit von Zeile 1: Dieser Eingang ist nur aktiv, wenn Sie das Kennzeichen für den Wahrscheinlichkeits-Konfigurationsmodus setzen
- Z-Score von Zeile 1: Diese Eingabe ist nur aktiv, wenn Sie das Kennzeichen für den Z-Score-Konfigurationsmodus gesetzt haben.
- Wahrscheinlichkeit Zeile 1 Farbe: Farbe für Zeile
- Wahrscheinlichkeit Linie 1 Breite: Breite der Linie
- Wahrscheinlichkeit Linie 1 Stil: Stil für Linie
Tastatur-Kurzbefehl
Drücken Sie Tastatur D: Zeichnen Sie den Volatilitätsindikator aus Ihrem Chart neu.
Wahl des Zeitrahmens
Wenn das tägliche Marktprofil aktiviert ist, können Sie die Zeitrahmen H4, D1, W1 und MN nicht verwenden.
Wichtiger Hinweis
Dies ist ein Standardprodukt. Daher akzeptieren wir keine Änderungen oder Anpassungswünsche für dieses Produkt. Darüber hinaus bieten wir keine Code-Bibliothek oder Unterstützung für Ihre Codierung für dieses Produkt.


This Fibo Volatility is really a hidden gem, try it and you know how accurate price reacted to the zone, Author is reaally a Genius very talented developer and very helpful responsive to customer query and supportive with video tutorial, best buy for 2023!