
Introduction to Volatility Indicator
For the financial trading, the Volatility is widely used. It is common to see that many trading strategies are based on the Volatility. However, when we try to apply the Volatility in our chart, the standard deviation or variance is not too user friendly. For this reason, some traders created the chart friendly version of the Volatility indicator. One of the several Volatility tools can include Harmonic Volatility indicator. Harmonic Volatility indicator is simple but robust in its concept. In this chapter, we will provide the brief explanation on Harmonic Volatility indicator. Harmonic Volatility indicator is the Volatility indicator that can draw the projection of the daily, Weekly, or Monthly Volatility in your chart. It draws the several probability lines derived from the 0.618 Golden ratio. Hence, it is the Fibonacci Volatility indicator. The derived probability lines are fully described in Table 5.1-1. These probability lines project the future Volatility from the market opening time or from the specific time point in your chart. They can help you to tune your entry or exit in several different ways. In this chapter, we are interested in using this Volatility indicator for both reversal and breakout trading.
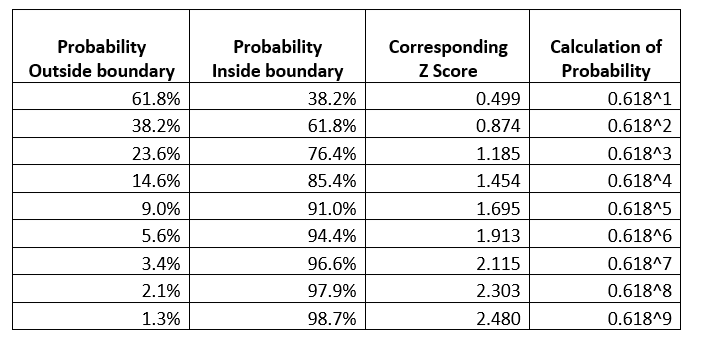
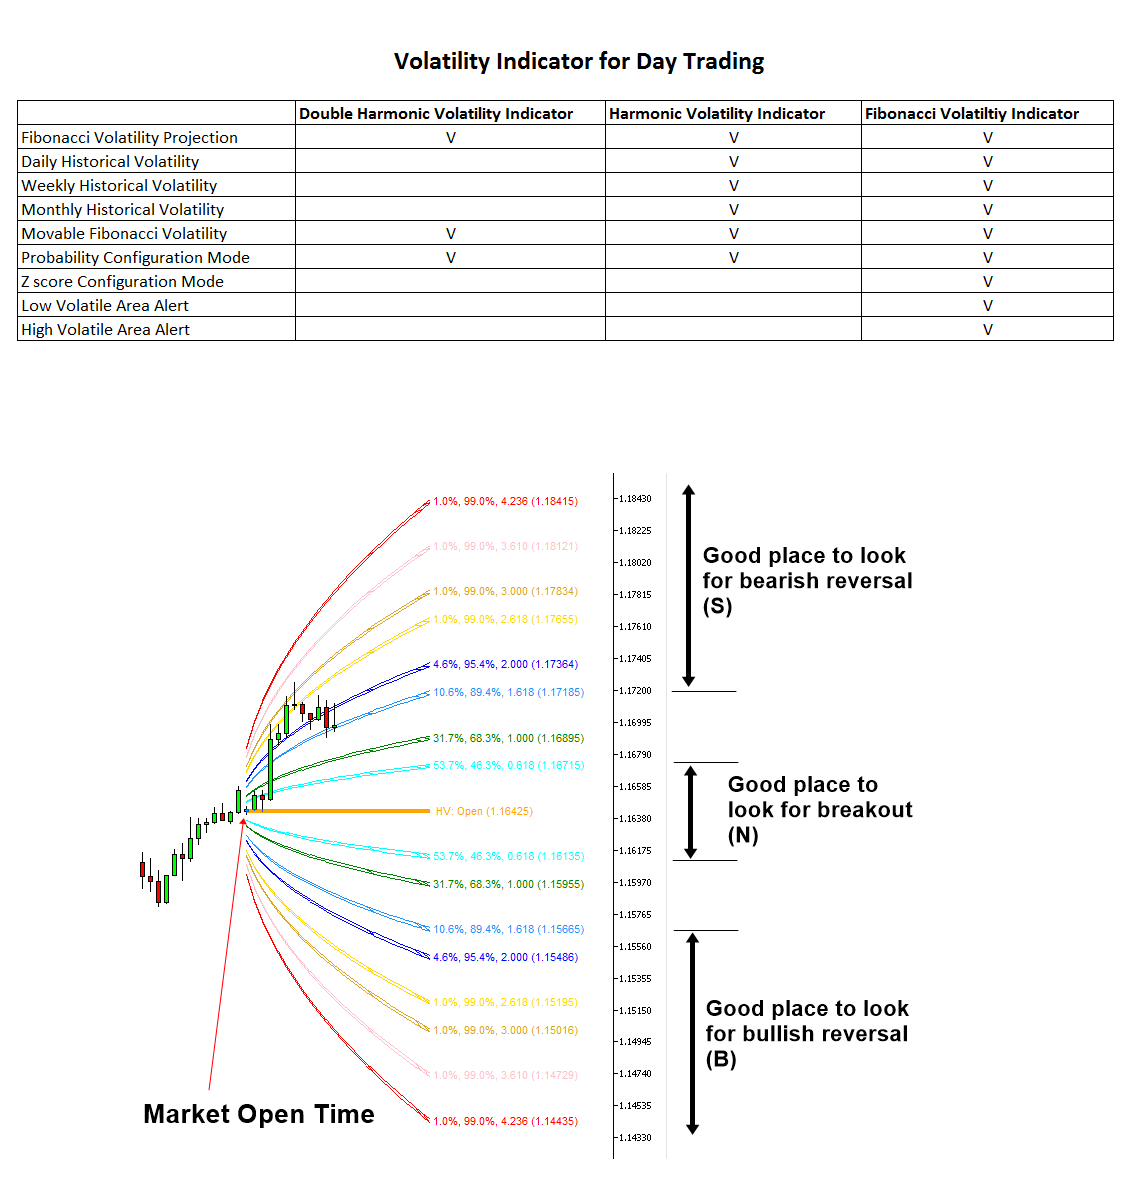
Table 5.1-1: Derived probability using 0.618 Golden ratio for Harmonic Volatility indicator
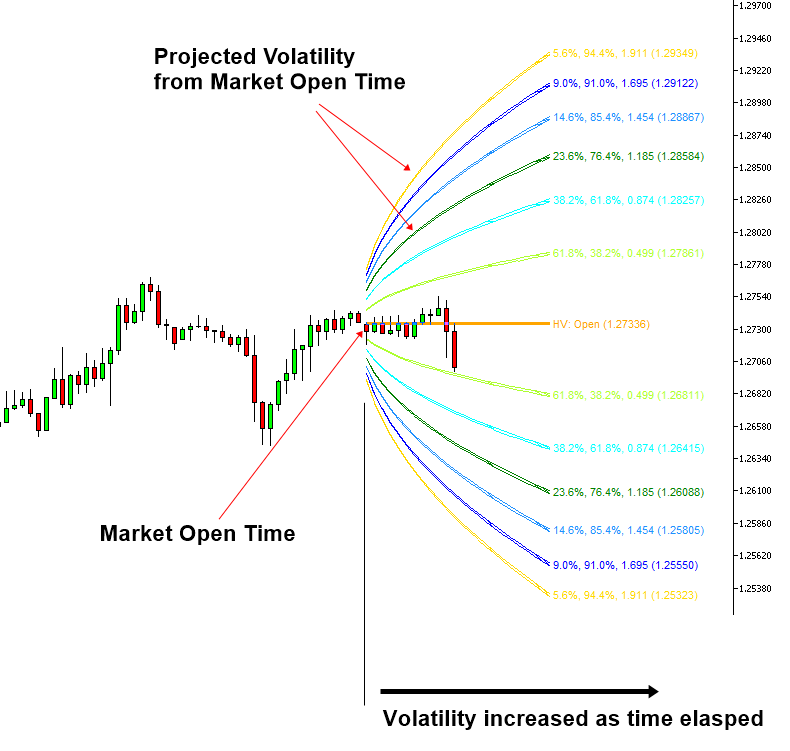
Figure 5.1-3: Harmonic Volatility Indicator on GBPUSD H1 timeframe
To use Harmonic Volatility indicator for either reversal or breakout trading, we need to define the three Volatility areas. Firstly, the area where the probability inside boundary is within 61.8% can be considered as the neutral area or low volatile area (N). If price is staying inside this low volatile area, then we can tell that power of bull and bear is pretty even. The corresponding Z score (i.e. standard deviation) is 0.874. You can check where this area is located in Figure 5.1-4. In this neutral area (N), we can often pick up the good breakout trading opportunity. When we want to apply more conservative criteria, you can set the neural area (N) within the 38.2% probability at the Z score of 0.499 (Figure 5.1-5).
Secondly, the bullish reversal or potential buy area (B) can be defined below the 61.8% probability line (Figure 5.1-4). The corresponding Z score is 0.874. If price was moved below this 61.8% probability line, then we can assume that selling pressure can slow down. When you want to apply more conservative criteria, we can define it below 76.4% probability line at the Z score of 1.185 (Figure 5.1-5).
Thirdly, the bearish reversal or potential sell area (S) can be defined above the 61.8% probability line (Figure 5.1-4). The corresponding Z score is 0.874. If the price was moved above this 61.8% probability line, then we can assume that buying pressure can slow down. When you want to apply more conservative criteria, we can define it as above 76.4% probability line at the Z score of 1.185 (Figure 5.1-5).
Both bullish reversal area (B) and bearish reversal area (S) are useful when you want to pick up the turning point whereas the neutral area (N) is useful when you want to pick up the breakout trading opportunity.
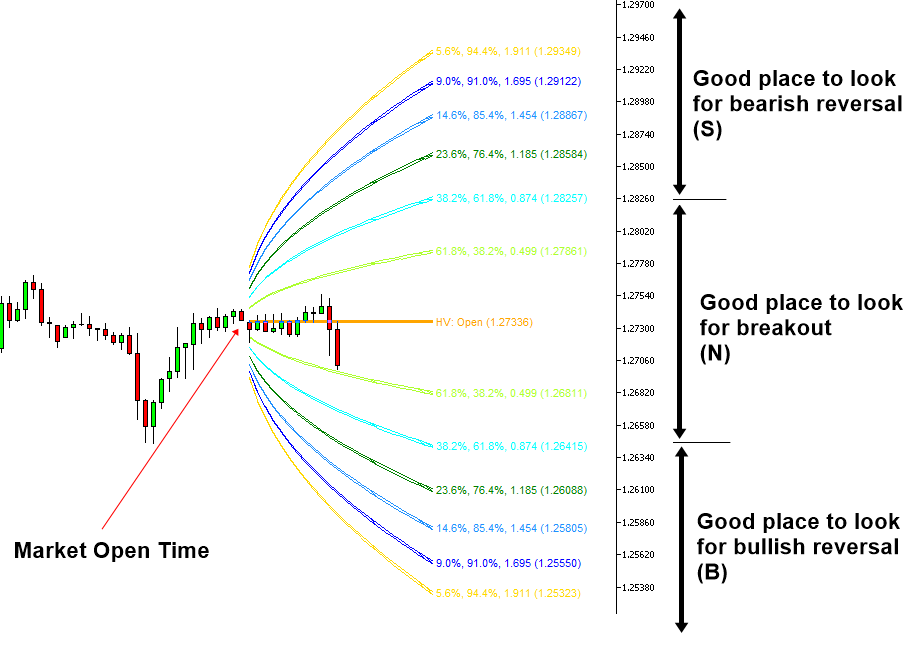
Figure 5.1-4: Bullish reversal area (B) and bearish reversal area (S) in the Harmonic Volatility Indicator in less conservative definition
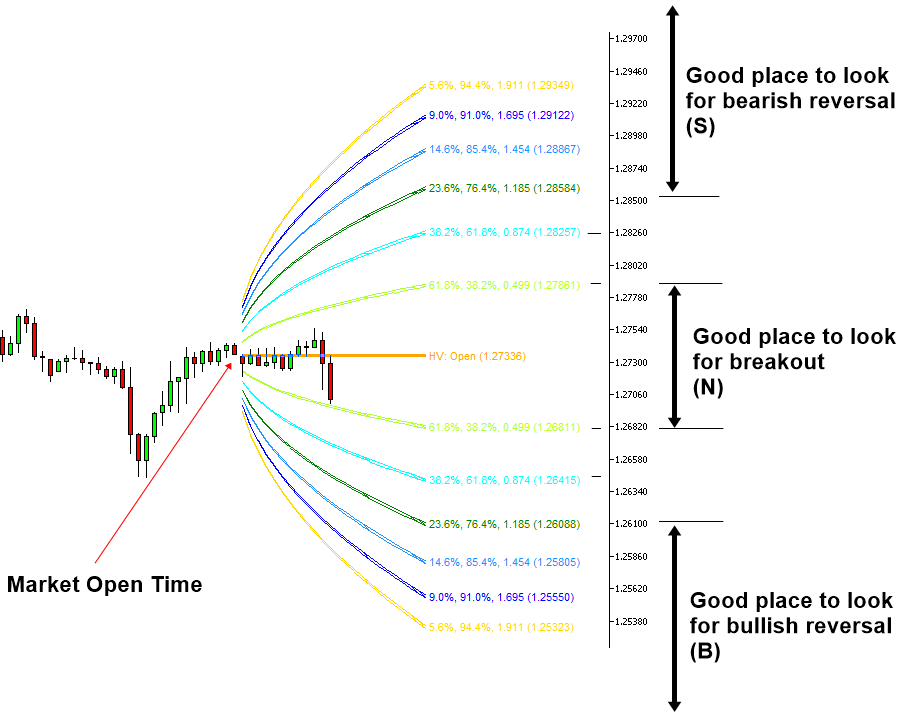
Figure 5.1-5: Bullish reversal area (B) and bearish reversal area (S) in the Harmonic Volatility indicator in the conservative definition
Fibonacci Volatility Indicator
Fibonacci Volatility indicator can provide the market volatility in visual form in your chart for your trading. You can use Daily, Weekly, Monthly and Yearly Volatility for your trading. The most important application of this Volatility indicator is to detect the potential breakout area, potential bullish reversal area and potential bearish reversal area. When you want to visualize the Volatility for your trading, this is the best tool available in the market. Additionally, you can also use the Movable Volatility indicator too.
Fibonacci Volatility Indicator for MetaTrader 4
Fibonacci Volatility Indicator for MetaTrader 5
Harmonic Volatility Indicator
Harmonic Volatility indicator also provides the market volatility in visual form in your chart for your trading. This tool can be used to visualize the Daily, Weekly, Monthly and Yearly Volatility. The difference between Harmonic Volatility indicator and Fibonacci Volatility indicator is that you can only use Probability Configuration mode in the Harmonic Volatility indicator whereas in the Fibonacci Volatility indicator you can access both Probability Configuration and Z Score configuration. This is cheaper than Fibonacci Volatility indicator.
Harmonic Volatility Indicator 4 for MetaTrader 4
Harmonic Volatility Indicator 4 for MetaTrader 5
Double Harmonic Volatility Indicator
This indicator is specialized in the Movable Volatility indicator mostly. Hence, if you only need the Movable Volatility indicator and you want to have more cost effective tool, then use this. However, if you want to have more choice in the Volatility visualization, then use either Harmonic Volatility indicator or Fibonacci Volatility indicator.
Double Harmonic Volatility Indicator for MetaTrader 4
Double Harmonic Volatility Indicator for MetaTrader 5
GARCH improved Nelder Mead (Free)
This is free Volatility indicator that implements the Generalized Autoregressive Conditional Heteroskedasticity (GARCH) methods with Nelder Mead algorithm. This is bit of experimental indicator to realize the GARCH (1,1) model. Hence, we provide this indicator for free. It would be interesting to see how this Volatility indicator works for your trading.
GARCH improved Nelder Mead for MetaTrader 4
GARCH improved Nelder Mead for MetaTrader 5
Summary about Volatility Indicator
We have provided a list of volatility indicator. Hence, it might be good to summarize what is included in each volatilty indicator. Hence, we provide this screenshot.
Trading Strategy Guide
Articles below contains the further guidance for the trading strategy guide for Volatility Indicator.
- Harmonic Volatility Indicator and Movable Harmonic Volatility Indicator
- Reversal Trading using Fibonacci Expansion Pattern with Volatility Analysis
- Breakout Trading using Fibonacci Expansion Pattern with Volatility Analysis
-
Fibonacci Volatility Indicator with the Z score Configuration
Book for Volatiltiy Trading
Any article has limited space comparing to the book. Although we have provided some trading guide using volatility indicator, you can find more details about Volatility Trading from the book below. Unlike our other Financial Trading book, this volatility trading book is only available from amazon.com.
Harmonic Volatility Line Indicator: https://www.amazon.com/dp/B071Z4FC8H
If you want to access the free forex trading education, then you can also visit our website here.
https://algotrading-investment.com/2019/07/23/trading-education/


")

")