Sideways Market Statistical Analyzer MT4
- Indikatoren
-
Young Ho Seo
 Harmonic Pattern Indicator - Repainting + Japanese Candlestick Pattern Scanner + Automatic Channel + Many more
https://www.mql5.com/en/market/product/4488 - Version: 8.9
- Aktualisiert: 19 November 2021
- Aktivierungen: 5
Einführung in Sideways Market Analyzer
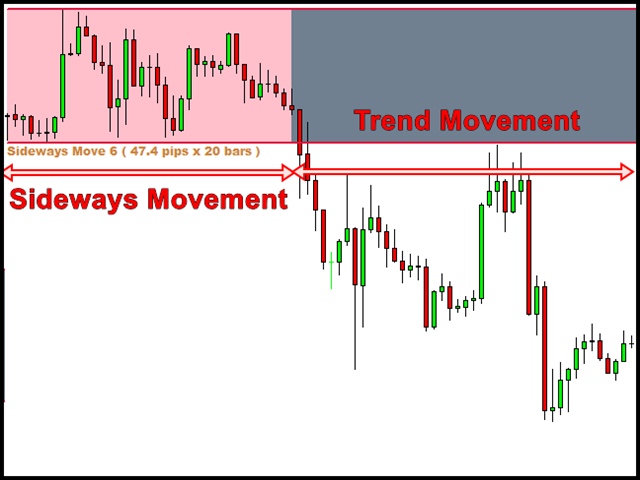
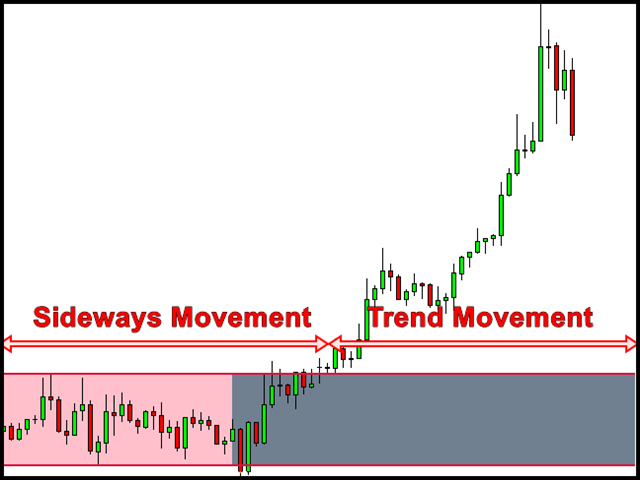
Ein bemerkenswerter Zeitraum mit geringer Volatilität und trendlosen Bewegungen auf dem Finanzmarkt wird als Seitwärtsmarkt bezeichnet. Früher oder später wird die geringe Volatilität zunehmen und der Kurs wird nach dem Seitwärtsmarkt einen Trend aufnehmen. Unter Handelsgesichtspunkten kann ein Seitwärtsmarkt als sehr guter Einstiegszeitpunkt für Händler dienen. Ein Sideways Market ist auch häufig Ausdruck einer Ansammlung von Großaufträgen von Großanlegern. Daher kann das Wissen um das Vorhandensein eines Sideways Market Ihnen helfen, ein gutes Timing für den Ein- und Ausstieg zu wählen.
Traditionell wurde der Indikator Average Directional Index (ADX) oder der gleitende Durchschnitt der Standardabweichung verwendet, um das Vorhandensein eines Seitwärtsmarktes grob zu bestimmen. Beide Indikatoren sind jedoch nachlaufend und weisen eine sehr geringe Korrelation mit der zukünftigen Kursbewegung auf. Sie liefern keine klare Vorstellung davon, wann der Seitwärtsmarkt begonnen hat und wann er endet. Wenn all diese wichtigen Informationen fehlen, haben Händler ein sehr unsicheres Bild von der aktuellen Marktsituation.
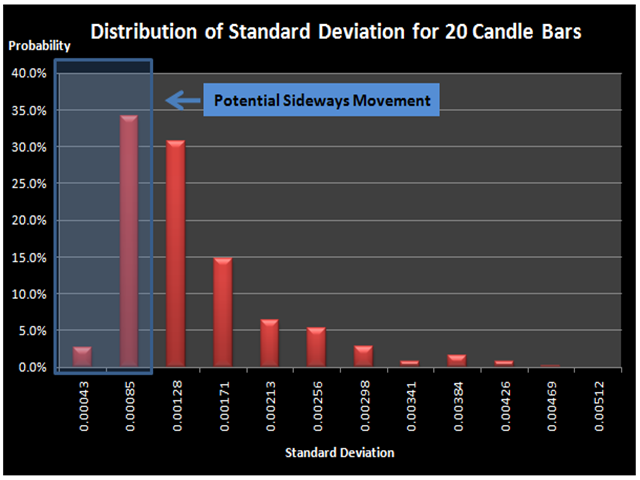
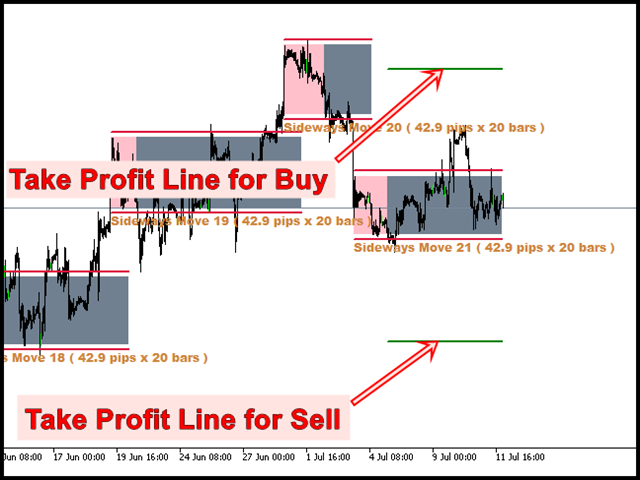
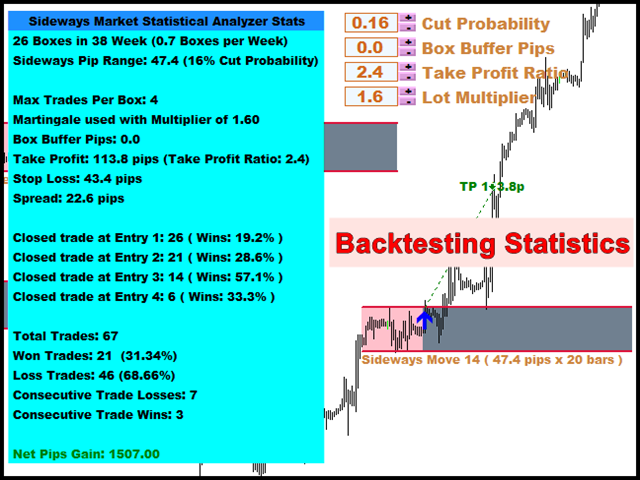
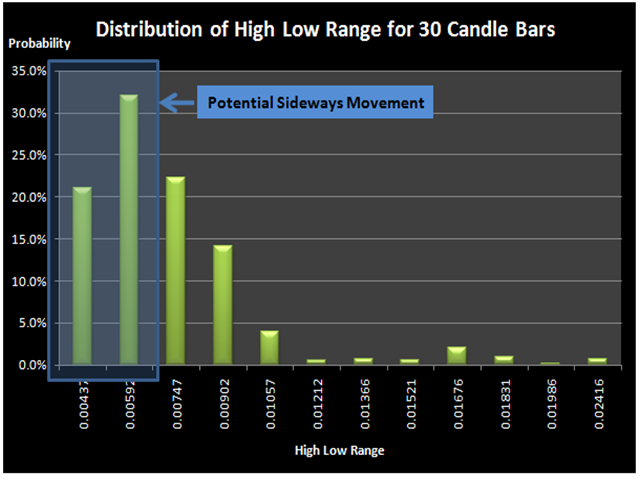
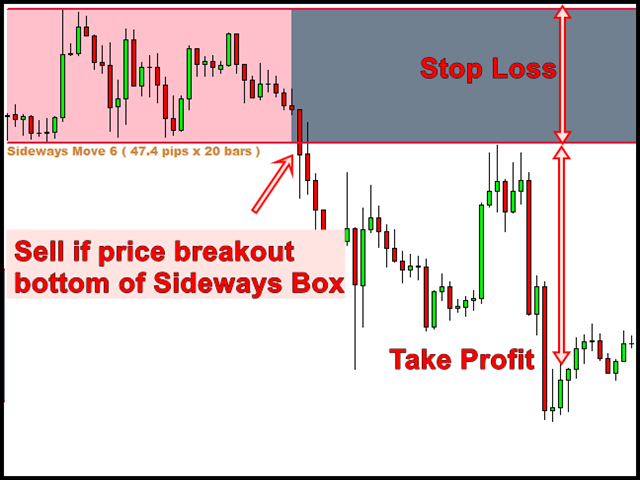
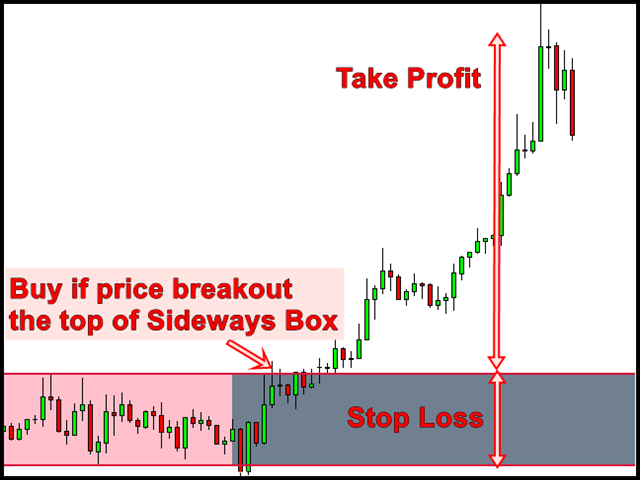
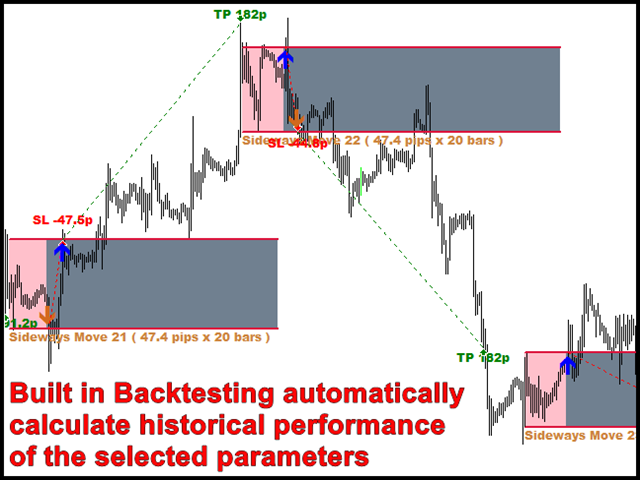
Hier haben wir einen sehr genauen Sideways Market Analyzer, der von der statistischen Theorie inspiriert ist. In der Tat kann dieser Sideways Market Statistical Analyzer den Sideways Market genauso erkennen wie das menschliche Auge. Was das Handelssignal betrifft, so eröffnen Sie einen Kaufauftrag, wenn der Preis die Oberseite der Sideways erreicht, und einen Verkaufsauftrag, wenn der Preis die Unterseite der erkannten Sideways-Box erreicht. Der Sideway Market Analyzer bietet Ihnen feste Stop-Loss- und Take-Profit-Niveaus. Der Sideways Market Statistical Analyzer funktioniert für die meisten Währungspaare gut.
| Symbol | Cut-Wahrscheinlichkeit | Box-Puffer Pips | Gewinnmitnahme | Lot-Multiplikator | Gesamtnetto-Pip-Gewinne (9 Monate) | Monatliche Pip-Gewinne |
|---|---|---|---|---|---|---|
| AUDCAD | 0.26 | 2 | 3.2 | 1.6 | 1 519.00 | 159.89 |
| GBPUSD | 0.16 | 0 | 2.4 | 1.6 | 1 607.60 | 169.22 |
| ERUUSD | 0.34 | 0 | 1.4 | 1.6 | 1 684.00 | 177.26 |
| EURJPY | 0.43 | 0 | 2.6 | 1.6 | 1 550.30 | 163.19 |
| EURAUD | 0.30 | 7 | 2.4 | 1.6 | 3 316.20 | 349.07 |
| Summe | 9 677.10 | 1 018.64 |
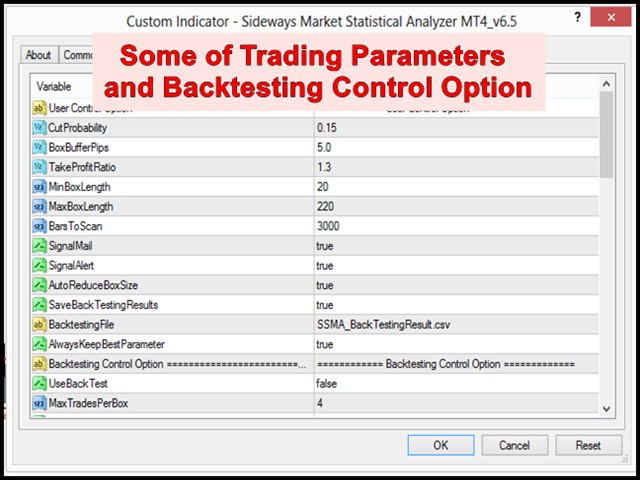
Für XAUUSD (Gold), Cut Probability = 0.15, Box Buffer Pips =0, Take Profit = 1.3, Lot Multiplier = 1.6 ergibt sich ein Gesamt-Netto-Pip-Gewinn von 27 265 Pips während des 9-Monats-Zeitraums und ein monatlicher Pip-Gewinn von 2 870 Pips. Es funktioniert also auch für Gold sehr gut.
Wichtige Handelsparameter
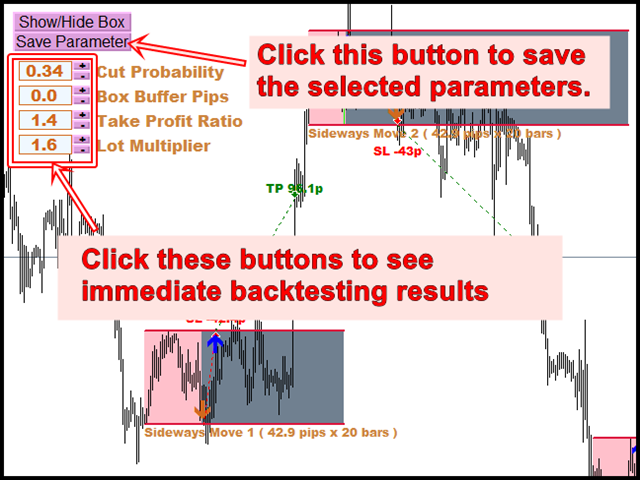
- Schnittwahrscheinlichkeit - Sie können zwischen 0,01 und 0,99 eingeben. Der Wert wird meist zwischen 0,05 und 0,5 liegen. Diese Schnittwahrscheinlichkeit ist das Kriterium, um die Seitwärtsbewegung der aktuellen Gruppe von Kerzenbalken auf der Grundlage der Wahrscheinlichkeitsverteilung zu qualifizieren.
- Box Buffer Pips - Sie können einen Wert zwischen 0 und 100 eingeben. Der Wert wird meist zwischen 0 und 10 liegen. Der Pip-Wert ist der Offset-Abstand vom erkannten Seitwärtsmarkt. Dieser wird durch die lange horizontale Linie oberhalb und unterhalb des erkannten Seitwärtsmarktes auf Ihrem Chart dargestellt. Diese Linie kann als Auslösepunkt für Ihre Kauf- und Verkaufsaufträge verwendet werden.
- Take Profit Ratio - das Verhältnis Ihrer Take Profit Pips/Boxhöhe. Der Wert liegt meist zwischen 1 und 3. 1 bedeutet, dass die Pips Ihres Take Profits gleich der Höhe der Box sind.
- Lot-Multiplikator - Der Lot-Multiplikator wird verwendet, wenn Ihr vorheriger Handel den Stop-Loss erreicht. Der Wert liegt meist zwischen 1,5 und 2,0. Es wird empfohlen, einen Wert von weniger als 1,7 zu verwenden.
Handelsstrategie-Leitfaden
Sie können Sideways Market Analzyer zusammen mit einer der folgenden technischen Analysen verwenden. Im Allgemeinen kann die Kombination von einer oder zwei Preisaktionsanalysen die Handelsgenauigkeit verbessern. Dies ist eine bekannte Tatsache, die von vielen erfahrenen Händlern bestätigt wird.
Leitfaden für Volume Spread Analysis
Leitfaden für Harmonic Pattern Detection Indikator
Leitfaden für den Momentum-Indikator
Leitfaden für den Angebots-Nachfrage-Indikator
Leitfaden für Dreieck-Muster, fallende Keil-Muster, steigende Keil-Muster und Kanal
Leitfaden für den Elliott-Wellen-Indikator
Wichtiger Hinweis
Dies ist ein Produkt von der Stange. Daher akzeptieren wir keine Änderungen oder Anpassungswünsche für dieses Produkt. Darüber hinaus bieten wir keine Code-Bibliothek oder Unterstützung für Ihre Codierung für dieses Produkt.


Sideway Market very unique product it really detect sideway and giving signal when to enter and wait, well worth purchase for 2023!